NASA here reports…
A Great Freeze Over the Great Lakes
Ice cover on North America’s Great Lakes reached 88 percent in mid-February 2014—levels not observed since 1994.
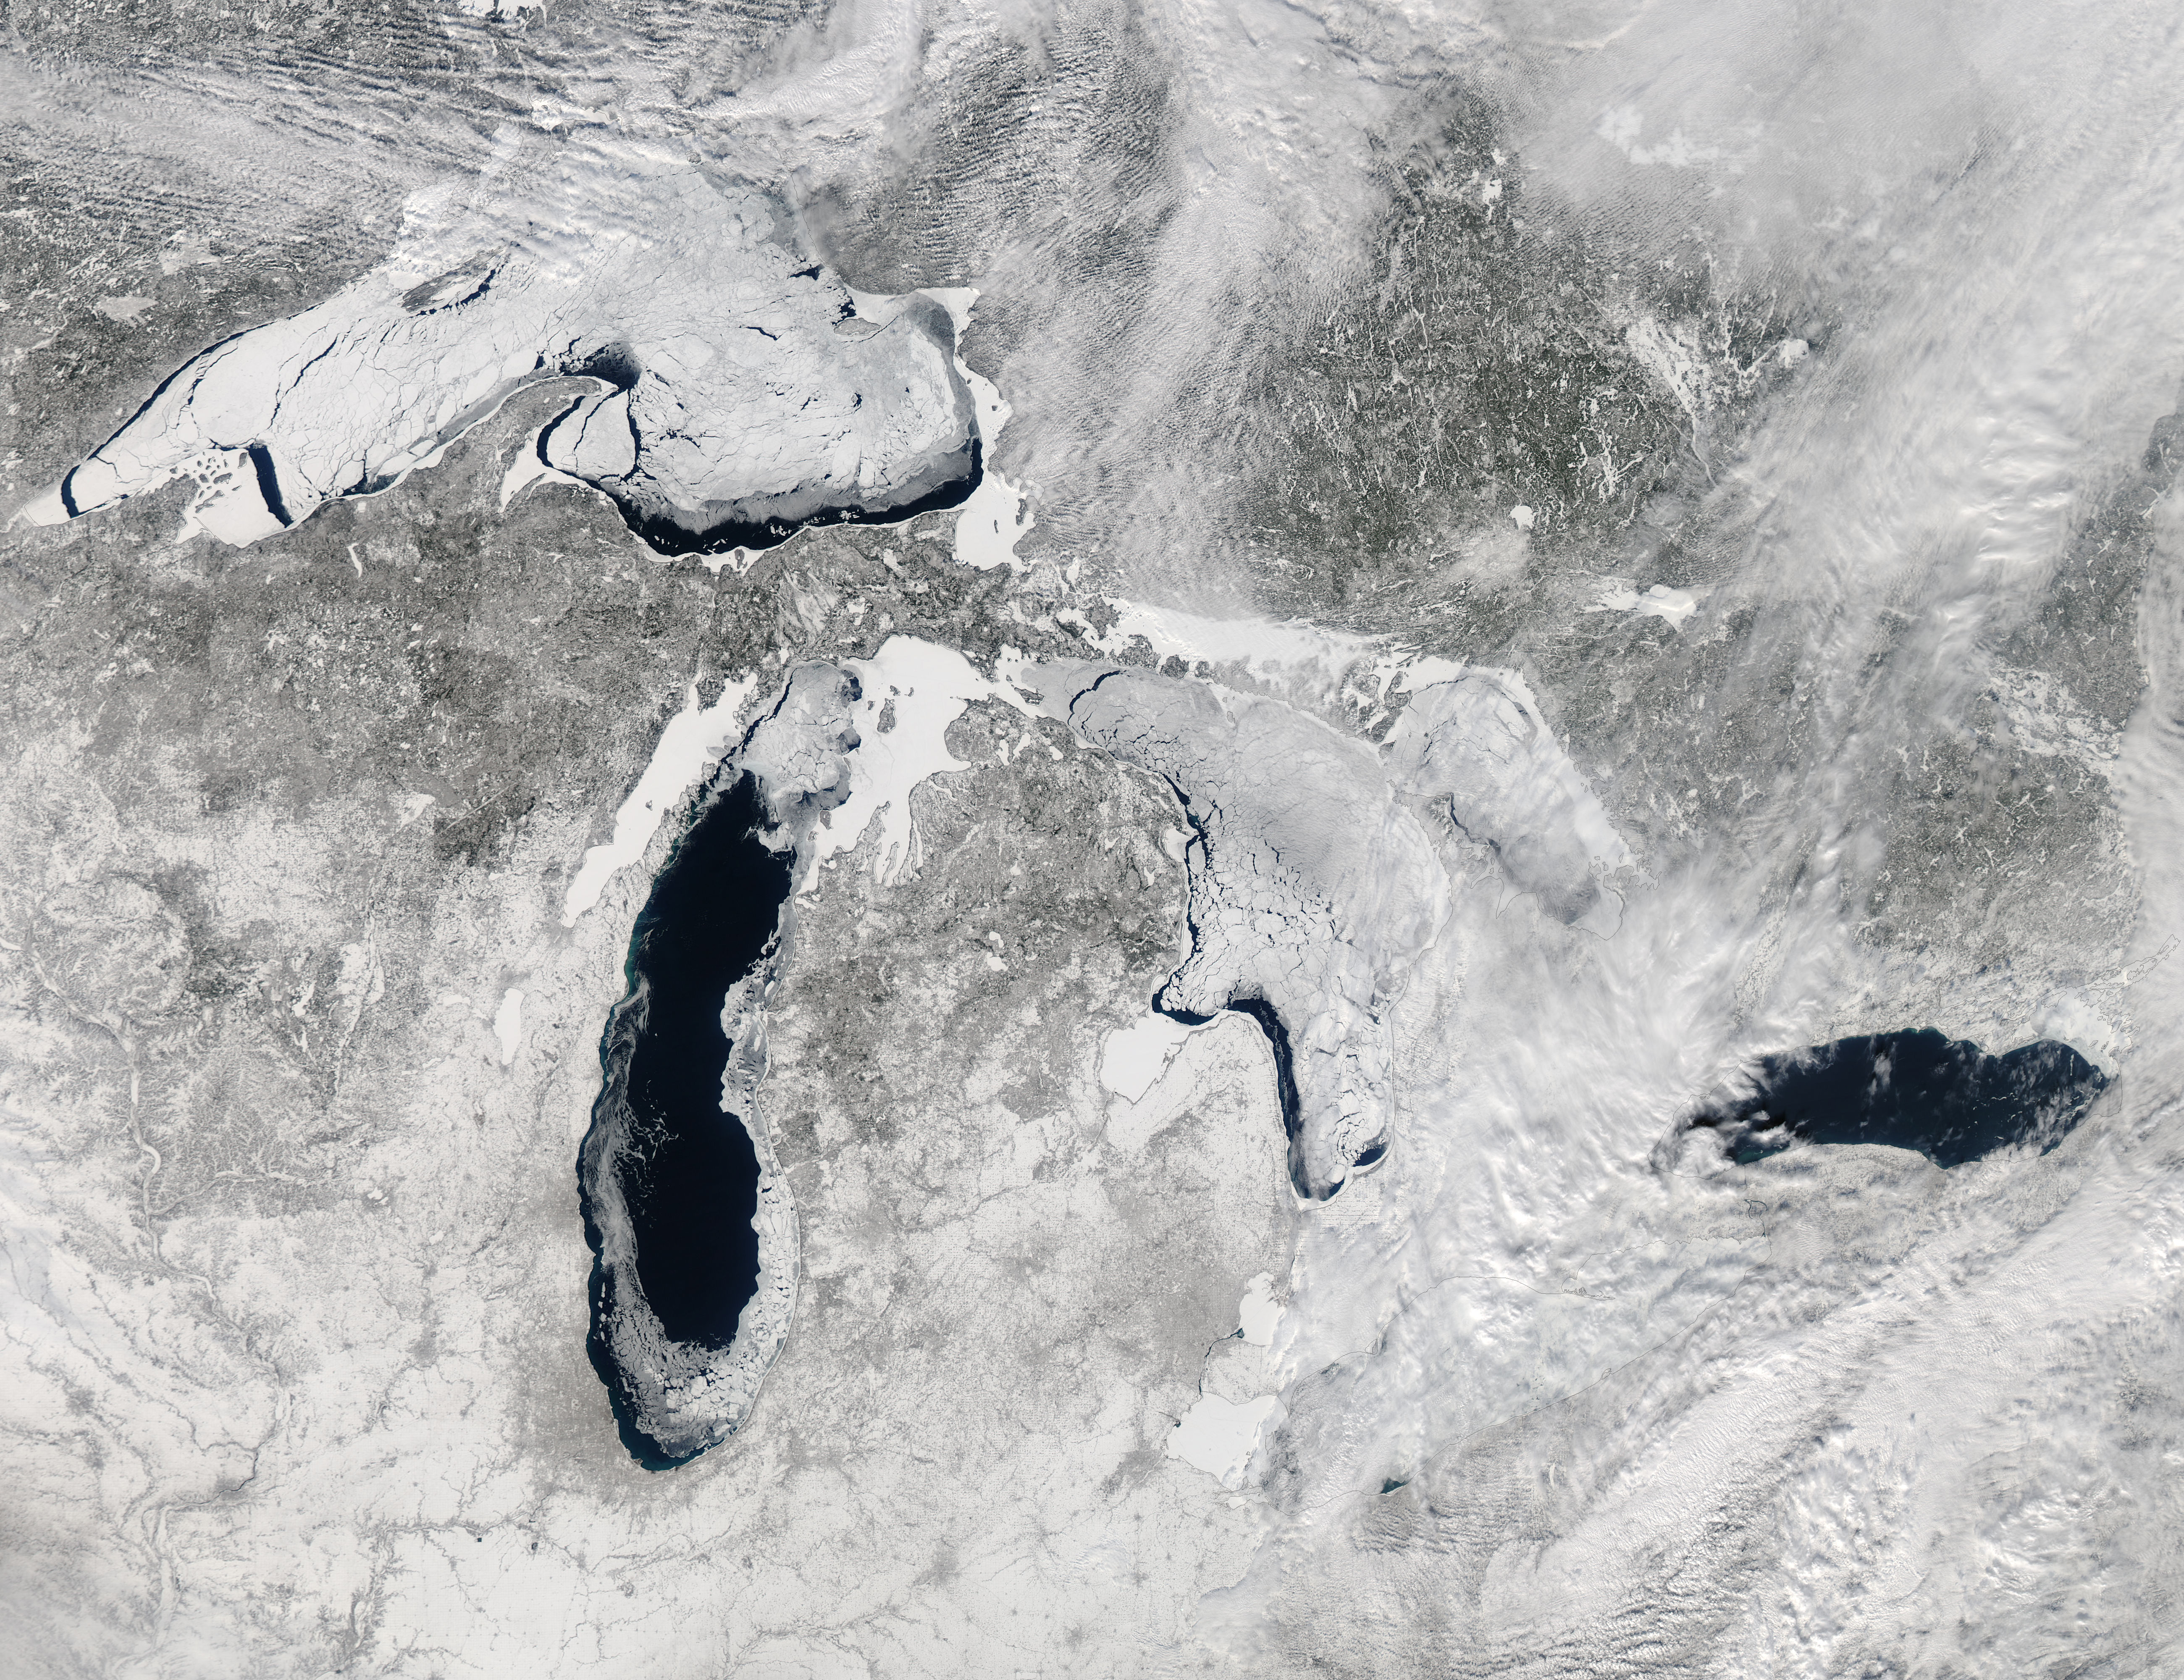
Photo: NASA
The average maximum ice extent since 1973 is just over 50 percent. It has surpassed 80 percent just five times in four decades. The lowest average ice extent occurred in 2002, when only 9.5 percent of the lakes froze.
The image above shows the Great Lakes in natural color in the early afternoon, when ice covered 80.3 percent of the lakes, according to NOAA’s Great Lakes Environmental Research Laboratory.
“Persistently low temperatures across the Great Lakes region are responsible for the increased areal coverage of the ice,” said Nathan Kurtz, cryospheric scientist NASA’s Goddard Space Flight Center. Cold air and winds remove heat from the fresh water until it reaches the freezing point, at which point ice begins to form on the surface. “Low temperatures are the dominant mechanism for thickening the ice, but secondary factors like clouds, snow, and wind also play a role.”
“We had an early ice season this year, owing to cold temperatures in the fall and early winter,” added George Leshkevich of NOAA’s Great Lakes lab. “Ice was reported on bays and harbors of the Great Lakes as early as the end of November, as opposed to the normal timing of mid-December.”
The frozen lakes have implications well beyond the water surface and the winter. Extensive ice cover on the Great Lakes can change the patterns and amounts of the famous “lake effect” snowfall in the region, explained Walt Meier, a cryospheric scientist at NASA Goddard. When the lakes are mostly ice free, cold west or north winds blow over the warmer water, pick up moisture, and then drop snow on the lee side of the lakes (usually eastern and southern shores). When the lakes freeze, the effect generally shuts down. However, the region is still receiving a fair amount of snow this winter due to other weather patterns, Meier noted.
Lake levels could be affected in the summer. Winter ice cover generally reduces evaporation during winter months. If that turns out to be the case in 2014, it would be “good news for local water supplies, as well as for shipping and recreational use,” Meier said.
A 2012 study published in the Journal of Climate by scientists from NOAA’s Great Lakes lab found that winter ice cover on Lake Superior decreased 79 percent from 1973 to 2010. The study also showed that ice cover on the lakes is highly variable and difficult to predict.
You also can view images of Great Lakes ice cover on February 15 and February 16.
Read NASA report here.


It’s also one of the snowiest winters on record.
http://www.freep.com/article/20140217/NEWS05/302170093/snow-metro-detroit
I’m right in the middle of it in suburban Detroit. We had a little melting in the last 24 hours, but it is now spitting snow again. By next week all snow records for the season will be broken for this area, as we are going into another Polar Vortex cycle and temperatures will drop again to zero F (-17 C).
Well thank goodness for “Persistently low temperatures across the Great Lakes region are responsible for the increased areal coverage of the ice,” said Nathan Kurtz, cryospheric scientist NASA’s Goddard Space Flight Center. Cold air and winds remove heat from the fresh water until it reaches the freezing point, at which point ice begins to form on the surface. “Low temperatures are the dominant mechanism for thickening the ice, but secondary factors like clouds, snow, and wind also play a role.”
Aren’t Experts wonderful?
Hi Ed, I hope you are OK and have enough wood to keep you warm and cosy until Spring.
On the other hand, I see the the NyMex Natural Gas is just a cat’s whisker short of US6-00 this afternoon. Happy Days for those with gas shares! I do not have to look at the weather reports to see whether it is cold or not, the gas price tells the story.
Firewood and road salt are in short supply and prices for both are way up. The authorities have used double their usual amount of road salt.
The road salt comes from here:
http://scribol.com/anthropology-and-history/news-salt-city-1200-feet-beneath-detroit
Thanks, Ed.
I had not known of the Detroit mine. There is another near Cleveland that NBC (I think) did a segment on about 20 years ago. Then it was owned by Akzo Nobel. There are worked out mines in the mid-west now used for distribution centers as they make good storage places. Those are not so deep. Eastern Ohio and into Pennsylvania the salt is close to the surface and was “mined” very early by drilling a hole and pouring hot water down. Salt dissolved and then the material was pumped out, dried, and sold. My wife’s great grandmother (from Ljubljana) worked off the fee of her passage to America by bagging salt near Akron. The Drake Oil Well in nearby PA was drilled by a salt well driller. Lots of such history in that region.
That is VERY good news indeed:) The Great Lakes have warmed about 3 – 4 F over the last 30 years…..so this is certainly GREAT to have them “cool” for a year.
I am curious to know where you have been for the last 20 years as they warmed, Pierre? Where were you?
And although the Great Lakes were cool…..guess what areas were warmer than normal? Yip. You guessed it……the Arctic ice sheet……and the western US (Alaska was unusually warm…..and of course California continued in drought).
So….as much as I would like to do summersalts (Wintersalts?)…..we all know that the trend of warming is much bigger than one year.
So while I’ll be glad to dance with you this year regarding the cool and snowy winter in the middle of the US (no slow dance…..I’ve heard about you)…..the trend will unfortunately pick up again in a year or two.
And take a look at the second and third charts on this link:
http://climatechangegraphs.blogspot.com/2012/08/arctic-sea-ice-volume-extent-charts_30.html
Buddy, that’s all weather.
…we all know that the trend of warming is much bigger than one year.
Wow. What an Einstein-level deduction. Of course, 30 years is also inadequate for determining long-term climate change (talk about a ridiculously tiny sample size!), but pointing that out makes me an evil denier. Real science must give way to “settled science”.
At any rate, have you ever considered a remedial course in basic statistics? You seem to need it.
“the trend will unfortunately pick up again in a year or two. ”
Buffy, you think you can look into the future? Maybe with a climate model? Have the last decades of failure of the climate models not taught you better?
Whoever is your handler – please send a troll who is less delusional.
“…the trend will unfortunately pick up again in a year or two.”
We’ve been hearing it 15 years now.
Pierre:
Really? You’ve heard that the 30 year trend of rising temperatures in the Great Lakes will pick up in a year or two? Wow….I had not heard that yet.
I suspect that most climate scientists suspect that…..but since this was the first significant freeze of the Great Lakes since the 1990’s…..and IT JUST HAPPENED…..I hadn’t yet heard a lot of scientists dicuss the likely continuation of the 30 year trend.
Looks like we have another nice blast of winter in several more days……
except for Easy Ed down in Arizona…..
Have a great weekend guys (and girls:)
You really don’t pay attention, do you. I stated just today that I am in Michigan. I have never lived in Arizona. Or are you referring to some other Ed.
Paying attention is above his pay grade.
Here in New Hampshire, I had 30″ of snow on the ground a couple days ago. Some rain yesterday and today is knocking that back. That 30″ (75 cm) is the 3rd greatest snowpack for a season in my 15 year record, higher values are 33″ and 39″ (2000-2001 and the incredible 2007-2008).
See what all the additional water vapor in the air will do during winter? Now, if Sean Hannity could just figure out that winter has NOT been cancelled as temperatures SLOWLY rise…….he’ll get this global warming thing figured out.
Sean has trouble with “snow” and “climate change” in the same paragraph. Too many years of pretending to be a journalist.
Ric….I’m afraid you’re probably going to have many more winters of heavy snow, as will many in the northeast US.
And all that additional water vapor was NOT welcomed by our friends the British this year….was it. They are expected to keep trending towards more rain. Talk about dreary……….
I think it’s about time to stop answering to Troll Buddy. We are loosing much better comments from commenters when they are not trying to discuss with him. The level of exchange is becomming very low and a lot less interesting.
Just ignore him. He will go away. If not, do as most people do, ban him for 6 months.
Pierre, you don’t have to display my message. Just block it. I don’t want this troll know he is having a sort of influence on the quality of your blog.
For the troll’s homework assignment; explain the dark colors on these maps:
http://droughtmonitor.unl.edu/
http://www.bom.gov.au/climate/drought/archive/20140204.2.col.gif