Ice Core CO2 and Temperature
The “Delay”
By Ed Caryl
There has been some interest in the lag in ice cores between temperature as measured from oxygen isotope differences, and the CO2 content as measured directly in gas bubbles. The literature seems to agree that the lag is something between one millennium and 800 years. As I had downloaded the EPICA Dome C data for both, resolved to 100 years, I decided to play with the numbers.
The first thing discovered is that the CO2 data resolution for times older than 22,000 years was not 100 years, but a variable number much coarser than that, interpolated in 100 year intervals, The original data resolution is up to more than a thousand years for some stretches of time.
The other thing discovered in the charted data are three groupings in time: the ice age time up to 20,000 years ago, the melt interval from 20,000 to 10,000 years BP, and the recent 10,000 years. The following charts show what the whole 100,000 year time interval looks like. The first figure is an XY plot of temperature versus CO2 concentration for the last 100,000 years.
Figure 1a is the CO2 plotted against temperature with no delay. Figure 1b is a plot of best fit for delays between plus 1000 years and negative 2500 years. For best R2 value the delay is 900 years. For highest temperature response versus CO2, the steepest linear trend line, it is at 2200 years.
An 800 to 1000-year value is what most researchers are finding looking at ice core data. Look here, here, and here. But in the current era, the last 50 years, lag times are less than a year. Look here, here, and here.
But notice the grouping in Figure 1a. There seems to be a difference between colder and warmer times, and a large gap where the temperature was increasing rapidly. What do we see when these groups are isolated and measured?
Figure 2a is the CO2 plotted against temperature with no delay for the time period from 100,000 years BP to 20,000 years BP. Figure 2b is a plot of best fit for delays between plus 0 years and negative 2500 years. For best R-square value the delay is 2100 years. The highest temperature versus CO2 response (the steepness of the trend line) is 2200 years.
During the ice age, the data has low resolution leading to low R2 values, but the delay is longer than 900 years. It is now measured at 2100 and 2200 years for the R2 and temperature response values, a much longer delay. For the emergence interval when the ice is melting and temperature and CO2 are rising sharply, and the CO2 data resolution is much higher, we should get a clearer picture of the delay, and indeed we do.
Figures 3a and 3b are of the time period from 20,000 years BP to 10,000 years BP. During this interval the delay is much shorter, the R value much higher, and the delay is about 400 years. It is longer at 1000 years for the maximum temperature change for a CO2 change (the trend slope).
So now that it has warmed up, and again holding a more or less constant temperature and a more or less constant CO2 value, what is the delay during the last 10,000 years?
Figures 4a and 4b show a multiple number of delays, including zero delay, 300 years and 700 years for the last 10,000 years. It looks like multiple delays are happening in this interval.
In Figure 4a, there appear to be two groups of data points, above and below 265 ppm CO2. The dividing point happens to be at 5000 years ago. If we split the data at 5000 years BP, we get these two sets of plots.
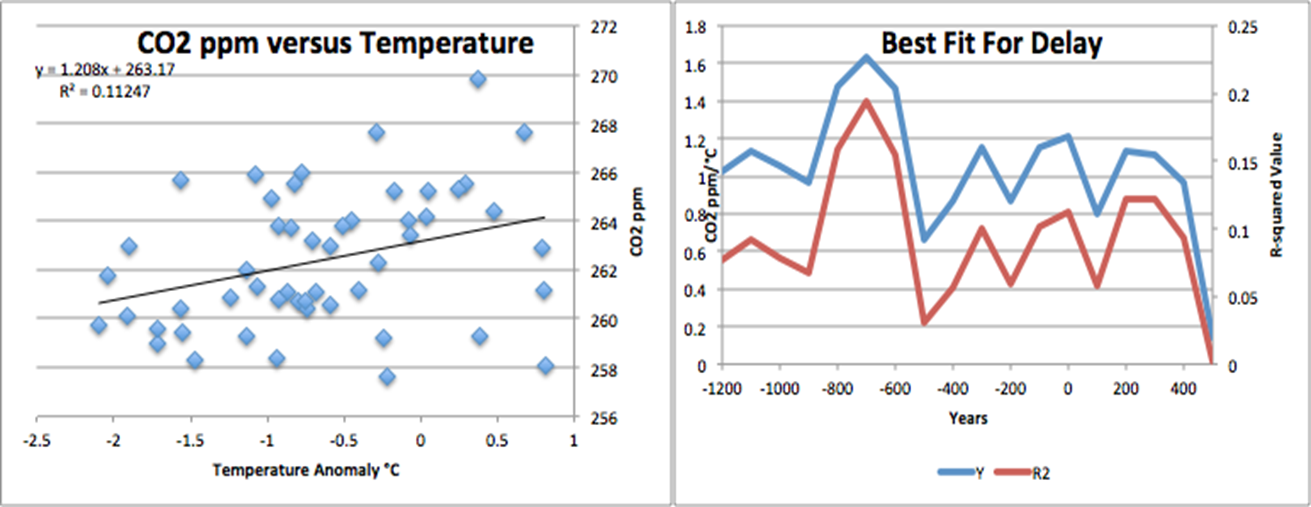
Figure 5a and 5b are plots from 10,000 year BP to 5000 years BP. In this period the delay is 700 years and both methods agree.
Figures 6a and 6b are plots from 5000 year BP to the present. The delay is zero but the R2 values are very low. The relationship between temperature and CO2 appears to be very low.
I will summarize with two more plots. Figures 7a and 7b are summaries of the previous plots:
Figure 7a is a plot of delay versus the R2 value, and 7b is the delay versus the average CO2 concentration during each interval.
As the CO2 concentration goes up, the delay, and the R2 value goes down, until at the present time, and indeed for the last 5000 years since the CO2 concentration has reached 265 ppm, there has been no delay.
There are several possible interpretations for these observations.
First, there is a delay dependent on CO2 concentration. The difficulty with this interpretation is that no one has proposed a mechanism for such a delay. Indeed, few have even noticed that the delay changes over time.
The second possibility is that there is no delay, and that what we observe is simply due to gas rising in the firn before it closes off. This has been proposed, here, as at least a partial explanation. But this doesn’t explain the variation in the delay, and certainly does not explain why there is no delay at all for ice less than 5000 years old.
A third explanation might be that the delay is due to the thermohaline oceanic circulation. When the ice age is at maximum, the circulation slows and large temperature fluctuations (see Dansgaard–Oeschger events below) during the ice age get embedded in the circulation, reappearing as large CO2/temperature differences when sea water returns to the surface after one cycle. When it warms up, the circulation speeds up again. When it gets as warm as it is now, the constant ocean surface temperatures completely hide the delay as the temperature differences are lower, and short term temperature versus CO2 solubility in the surface ocean dominates.
A fourth explanation might be that the delay is related to Dansgaard–Oeschger (D-O) events. These occur at multiples of 1470 years, and a few missing ones in the record would account for the average delay measuring 2200 years with a rather broad peak. The third and fourth explanations might be combined. The equivalent Bond events in the Holocene are of a much lower magnitude, and may not appear in the last 5000 year record.
During the ice ages the atmosphere was much drier than during interglacials. We know this because we know that deserts and grasslands were much larger and rain forests smaller. There is much less evaporation over ice than over open water. The greenhouse effect would be lower due to both CO2 and water vapor reductions. During the Holocene, CO2 increased along with water vapor. The temperature response to both is logarithmic, the same added CO2 and H2O has less and less effect. However, the larger variable is H2O. It can vary from nearly zero over deserts to saturation over tropical seas. Of these two gases, water vapor in all forms is the control on temperature, not CO2. This is why we see temperature driving CO2, and not the other way around.
Nowhere here do we see any indication that CO2 is driving temperature.


Hi Pierre
Nice work. The aspect I see with the relationship between CO2 and Temp in the Ice core data is that every time CO2 continues to rise for a period of time after temp starts to fall then and this is the item that confirms CO2 is not a major driver of temperature, it starts to fall and is dragged down by the falling temperature.
If CO2 was a major driver of temperature, then the CO2 would have stopped the temperature fall when CO2 continues to increase as Temp begins its decline.
This falsifies the whole premise of CO2 being a main driver of temp.
Agree this is nice work…but the credit goes to Ed. The notion that temperature lags CO2 is one of the greatest scientific absurdities of the last century.
A minor remark, when the ice age is at maximum the thermohaline circulation has come to a hold, because the sealevel was that much lower that there is no circulation possible thru the Bering strait, so the Arctic ocean was a dead end.
Reversed flow from the Arctic ocean to the Antlantic took place due to snowfall on the Arctic displacing water from the Arctic ocean.
Thermohaline Circulation doesn’t go through the Bering Straits.
http://en.wikipedia.org/wiki/Thermohaline_circulation
Scott, that brings up a good point. If CO2 had any effect, the delay in any of the time intervals examined would have two values, one when going up and one going down. That doesn’t happen. In the interval from 20,000 years BP to 10,000 years BP, for instance, when temperatures and CO2 were wildly changing during and before the Younger Dryas, there is only one peak in each delay. The delay is the same going up and going down.
A belated nice work Ed sorry for the delay.
So the temperature goes up before the CO2 rises and
the temperature goes down before the CO2 falls.
So anybody claiming that CO2 drives the global temperature must be fodder for a psychiatrist?
Or else there is a very big problem with using ice cores to determine past conditions.
“So anybody claiming that CO2 drives the global temperature must be fodder for a psychiatrist?”
Thieves are normally a case for the courts.
Graeme No.3: “or else there is a very big problem with using ice cores to determine past conditions.” Yep – long established but not widely recognized. See Jaworowski’s 1997 description of why CO2 in ice cores is not CO2 in the ancient atmosphere.
The delay appears to be reproduced in Salby’s calculated CO2 (near 20:30 in his Hamberg lecture). If I understand what he did, the delay depends on dissipation in ice which in turn depends on CO2 concentration.
W.H.
Thanks. I have read Jaworowski, and anybody who says “I can describe himself as an expert because he has made all the mistakes possible” is obviously confident of his knowledge.
I have been sceptical (there’s that word again) of the accuracy of ice core figures ever since I read that they had to be interpreted with a variable time factor.
The most interesting thing about them though is that the figures produced completely demolish the idea that CO2 controls the Earth’s temperature. The last 4 inter glacials are all supposed to have had CO2 levels below 300 ppm yet with temperatures up to 3℃ higher than present. Somehow Al Gore missed mentioning that.
You guys may find this interesting:
That antarctic discrepancy is old information. They rise together. See:-
Parrenin, F. et al., Synchronous Change of Atmospheric CO2 and Antarctic Temperature During the Last Deglacial Warming. Science 339, 1060-1063 (2013), http://www.sciencemag.org/content/339/6123/1060.
Pedro, J. B., Rasmussen, S. O. & van Ommen, T. D., Tightened constraints on the time-lag between Antarctic temperature and CO2 during the last deglaciation. Climate of the Past 8, 1213-1221 (2012), http://www.clim-past.net/8/1213/2012/cp-8-1213-2012.html.
Shakun, J. D. et al., Global warming preceded by increasing carbon dioxide concentrations during the last deglaciation. Nature 484, 49–54 (2012), http://www.nature.com/nature/journal/v484/n7392/full/nature10915.html.
Solar activity (and cosmic rays) have minimal effect – 0.1% of observed changes. The solar cycle has been steady at least since 1.2 billion years ago. See:-
IPCC AR5 2013/14; National Research Council, Workshop Report, 2012 , http://www.nap.edu/catalog.php?record_id=13519.
Andrews, S. D., Trewin, N. H., Hartley, A. J. & Weedon, G. P., Solar variance recorded in lacustrine deposits from the Devonian and Proterozoic of Scotland. Journal of the Geological Society 167 (2010), http://jgs.lyellcollection.org/content/167/5/847.abstract.
On rate of change this paper will answer that:-
Zeebe, R. E., History of Seawater Carbonate Chemistry, Atmospheric CO2, and Ocean Acidification. Annual Review of Earth and Planetary Sciences 40, 141-165 (2012), http://www.annualreviews.org/doi/abs/10.1146/annurev-earth-042711-105521.
“The solar cycle has been steady at least since 1.2 billion years ago.”
Falsified by the last two cycles. (Duh.)
What is this, statistics consensus gymnastics?
I investigated bubbles rising in the ice as an explanation for the delay, but discarded (perhaps erroneously) that idea because the rate of rise would need to be on the order of 1 mm/year for the Dome C core, and would be a different rate for other cores based on the snow accumulation rate. That didn’t pass my smell test.
Dirk H. of course the Thermohaline circulation doesn’t go thru the BS, but once the sea level is that low the BS is running dry, so there is no flow to the Arctic Ocean possible.
Another ref.
Nature Geoscience 2010, Influence of BS flow and North Antlantic circulation on glacial sea level changes.
Given that I don’t buy Nature, I can’t follow the argument.
I expect that the delay is frequency dependent. For the past 56 years, at least, the relationship has been
dCO2/dt = k*(T – To)
where To is a nominally constant baseline, and k a nominally constant scale factor. So, you have a 90 deg phase lag, i.e., put a sinusoid forcing into T with radial frequency w0, and you get a time delay of pi/(2*w0).
Over long periods of time, there might be something of the flavor
dCO2/dt = k*(T – To) – CO2/tau
so that, for higher frequencies, you get a 90 deg phase lag, declining to zero lag for very long term T components. A step change in T would produce a step change in CO2 with a time constant of tau.
A cross-spectrum analysis could arrive at an appropriate transfer function, with full frequency dependent phase response, though the data may be so poor that the results would be somewhat speculative.
Dirk H
There are more sources of info, Journal “Proceedings of the National Academy of Sciences” april 9 2012 doi:10.1073/pnas.1116014109
Subject: Role of the Bering Strait on the hysteresis of the ocean conveyor belt circulation and glacial climate stability.
If that’s as fact-based as other climate theories I’ve heard off I’ll pass.
Gavin Schmidt and others have explained all of Earth’s climatic history with the SAME models that have now failed abysmally for the last 26 years, so I take all climatic models as falsified and all their explanations as fiction until the field completely reforms itself. Which might never happen. Currently it’s a non-science.
The argument is that a “third explanation” is the “delay in the oceanic thermohaline circulation”
O/T Spread this everywhere – topic nutrition
Dr Joe Wallach presents his book EPIGENETICS
http://www.infowars.com/epigenetics-you-really-are-what-you-eat/
Gives you the complete rundown about modern nutrition deficiencies.
Yes, I know, Infowars, ignore Jones; listen to Wallach.
And buy the book.
Sorry, small mistake in name
Joel Wallach – and he has a website
http://www.wallachonline.com/
you are spending too much energy to falsify a wrong claim..just because al gore used the correlation.
CO2 in atmospher must be controled by temperature ( of what? essentially the ocean) …we may imagine to that after a rise of CO2 and temperature some of the COé is pumped out of atmosphere OK..
but it is hard to compare such a situation with the case of adding CO2 in the system…
the CO2 equilibrium is a slow process, the time resolution of ice core data doesn’t help much to understand what can occure in case of CO2 added in atmosphere…
You simply had to laugh at people who showed you T vs CO2 to prove their case…
I think events such as volcanic activity with release of large amount of CO2 ( unfortunalely with other stuffs) would be more appropriate.
Al gore is a crook, the point is made since a while.
Which holds the most co2 cold water or hot water? When the sea gets cold it takes in more co2 when it gets hot it releases co2 . The sun is the main supplier of heat to the oceans so it is the sun and Ocean heat content that determines climate. All other variables are nuances.
I am so bored with the AGW scam. You know it’s a scam because they have to keep renaming it. The persons getting the money will lie all they can to keep the money rolling. The power it gives to the political class is immense. Our efforts should be to find honest scientists and honest politicians ( if there are any) and to push them to make statements. Do not buy any paper or MSM product that pushes the scam.
Rant over have a nice day.