The CO2 concentration in the atmosphere has been steadily increasing since regular measurements began at the Mauna Loa Observatory. This increase is partially driven by fossil fuel use but the year to year rate of increase is driven by ocean temperature. This was discussed in October 2012 here.
The International Energy Agency (IEA) tracks fossil fuel use and has reported here that emissions due to fossil fuels have flatlined for the last two years. Actually, it has nearly flatlined for the last four years according to their own figures. The increase from 2011 to 2012 was less than 0.5%, and from 2012 to 2013 it decreased by 0.03%.
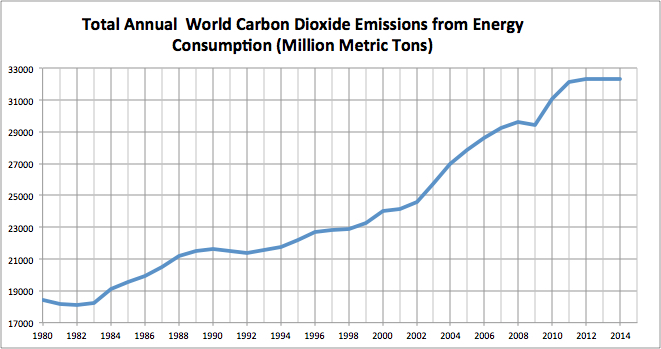
Figure 1 is a plot of annual world fossil fuel CO2 emissions since 1980 from IEA.
In that time, CO2 in the atmosphere has grown from 338 parts per million (ppm) to 398 ppm. In the next figure, that quantity has been converted to metric tonnage.
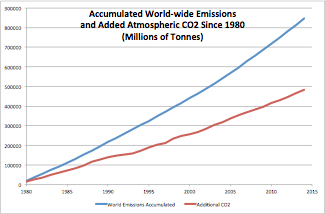
Figure 2 is the accumulated emissions compared to accumulated CO2.
Note that only about half the emissions have stayed in the atmosphere. The remainder has been absorbed somewhere else.
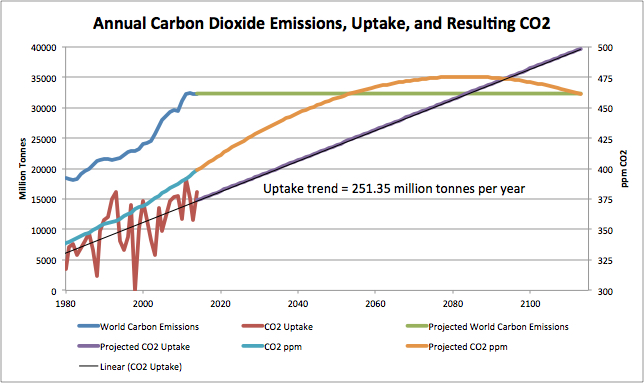
Figure 3 is a plot of annual Carbon Dioxide emissions, the annual uptake by the biosphere, and the resulting atmospheric CO2 concentration, with projections of each into the future.
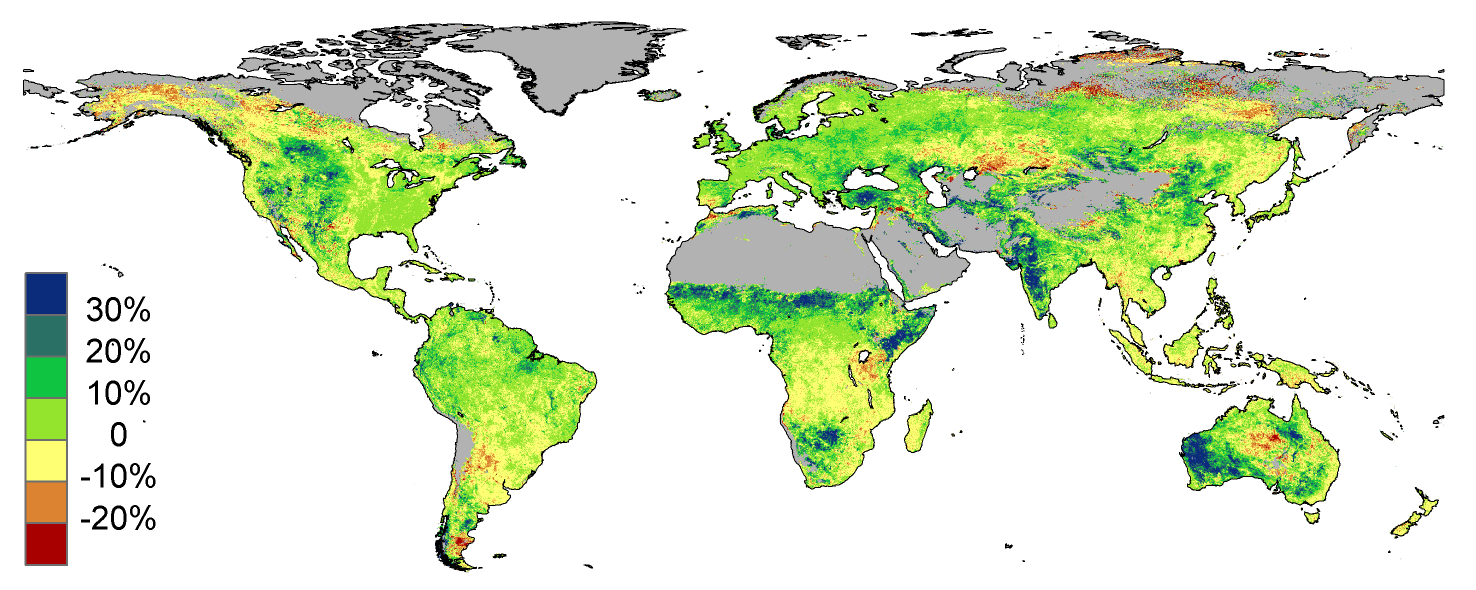
Figure 4. Estimated changes in vegetative cover due to CO2 fertilization between 1982 and 2010 (Donohue et al., 2013 GRL). For a discussion of this image and other similar images see Roy Spencer here.
The “somewhere else” is the biosphere, the “greening” of global photosynthetic life along with absorption by the oceans. Each year, on average, those sinks take up 251.35 million extra metric tonnes of CO2 as the biosphere pulls things back into balance. That sounds like a lot, but keep in mind that the atmosphere contains more than 3 trillion tonnes of CO2, land based vegetation about 4 trillion tonnes, the surface ocean something like 5 trillion tonnes, and the deep ocean 150 trillion tonnes. The total annual flux from atmosphere to the biosphere and back is about 400 billion tonnes. So that annual difference is only about 0.5%. (I am using the American counting system: 106 is a million, 109 a billion, 1012 a trillion. I’m also using the weight of CO2, not just the carbon atoms.)
The uptake decreases with increasing temperature. The downward spike in uptake in 1998 was due to the El Niño of that year. The increase in uptake in 1992 and 1993 was due to the Mount Pinatubo cooling. The uptake also increases with increasing CO2. On average, the uptake is increasing. Over the last 35 years, it has increased by 251.35 million extra tonnes per year.
If this increase holds, and the global fossil fuel emissions remain constant at the same level as the last four years, the uptake will equal the emissions late in this century, in about 2083. At that time, CO2 in the atmosphere will reach a maximum at about 475 ppm and begin to decrease. In my humble opinion, this projection is pessimistic. If emissions are reduced below the current level, the date and level of the maximum will be earlier and lower. If ocean temperatures decrease, the same thing will happen. If warming occurs, and/or emissions increase, the date of the maximum will be pushed toward 2100, and the maximum level will be slightly higher. Ocean temperature is a positive feedback on CO2 increase and a negative feedback on CO2 uptake. A cooler ocean takes up more CO2, a warmer ocean less.
The current policies in most developed countries are toward lowering emissions. To date, these policies have been successful in holding emissions at the current level for the last four years. If governments allow the development of nuclear power, other renewables increase in a non-destructive fashion, and if natural gas continues to replace coal-fired power plants, carbon dioxide emissions will likely fall below the current level. This will pull the CO2 peak to an earlier date and a lower level. That date is where emissions cross the uptake trend line. Here is my optimistic view: If emissions fall back to the level of the year 2000 by 2050, looking at Figure 3, one can imagine that the CO2 level will peak at about 450 ppm near that year and fall after that.
What will this do to global warming? The slight increase in CO2 induced warming might just offset the coming sun-induced cooling. Perhaps we will have a century of constant temperature.


“Note that only about half the emissions have stayed in the atmosphere. The remainder has been absorbed somewhere else.”
No, they haven’t. They’ve been almost completely absorbed. The rate of change of atmospheric CO2 flatlined over a decade ago and, according to this data, emissions did only recently. Cause must precede effect.
Emissions have little to do with atmospheric concentration, which is set by the temperature dependent boundary conditions with the oceans and land. Murry Salby has recently estimated that atmospheric concentration is, at most, responsible for 30% of the atmospheric rise, but this is overly generous. There is no actual correlation between emissions and atmospheric concentration rate of change beyond the coin flip that both have been going up, up to now.
I suspect this new claim for emissions flatlining is an attempt to fudge the data to claim that they are now consistent with the rate of change of atmospheric CO2. But, it is too late. Atmospheric concentration rate of change flatlined long ago, and cause must precede effect. Soon, temperatures will decline, and atmospheric rate of change with it. They will soon have to start claiming declining emissions to remain consistent with it. When that happens, you will know for certain that they are just making things up. But, then, that wouldn’t be anything new, would it?
BTW, the degree to which the surface temperatures do not match the rate of change of atmospheric CO2 is the degree to which the surface temperature data are simply poor. There is even better agreement between the higher accuracy satellite temperatures and the rate of change of atmospheric CO2.
Thanks for the graph, i had not seen this in this detail before.
I ll have to think about this!
The temperature used was satellite (UAH) sea surface temperature.
I actually didn’t use SST in this article, though I did look at it for the clues about the effect of Pinatubo and the 1998 El Niño.
The surface temperature series simply tell us the relationship has held for the entire interval since MLO started recording data.
Note: Salby’s 30% max means that, if the rise happens to be 50% of total anthropogenic input, then at most anthropogenic CO2 is responsible for 15% of the rise. We have
Rise = f*Anthro + Nat = 0.5*Anthro
The ratio of f*Anthro/Nat is at most 0.3/0.7, so f*Anthro*(1+0.7/0.3) = 0.5*A, which implies f = 0.15 or 15%.
The rate of change of CO2 uptake has certainly not “flatlined”. See the red trace in Figure 3. All these numbers are calculated from the IEA data and the annualized CO2 data from Mauna Loa.
Rate of change flat = no acceleration. And, it’s been that way for over a decade for atmospheric concentration, while emissions have been accelerating.
“Flatlined” is commonly used to say a quantity is not increasing (and certainly not in this case), not that its rate of change is not increasing.
Thus, CO2 has not “flatlined.”
Yeah, the rate of change is not increasing. The rate of change is a “quantity”. Quote from above: “The rate of change of atmospheric CO2 flatlined over a decade ago and, according to this data, emissions did only recently.”
What is your problem? Get a grip.
Note the link I showed above. The rate of change of atmospheric concentration has, indeed, flatlined for over a decade.
I think what you are showing as “uptake” is the difference between the atmospheric concentration and the emissions. If so, it is showing what I am saying – that the uptake seems to be accelerating. But, all it really means is that the rate of change of atmospheric concentration did not increase, while emissions did.
There is no need to make an epicyclic assumption that the world’s CO2 sinks somehow became more aggressive and increased their uptake of anthropogenic CO2 for reasons unknown. They’re as aggressive as they’ve always been. Which is to say, they’ve always been taking out almost all of the human input. That is not the drum they march to. Atmospheric concentration keeps pace with the level dictated by the atmospheric land/ocean interface, and that level is temperature dependent.
Yes, it is temperature dependent in the short term, due to ocean flux. But in the long term, atmospheric concentration of CO2 feeds plant growth, thus feeding increasing uptake. I think we agree more than you think.
I hope I’m not coming across as disagreeable. Just trying to lay things out as I see them for any who are interested.
There is a long term dependence of CO2 on temperatures evident in the data. The trend in temperatures over the 20th century produced a trend in the rate of change of CO2.
If, as I suspect, all or nearly all of our emissions are absorbed by the local biosphere and all or nearly all of the global increase in atmospheric CO2 is ocean / sun driven then the above article becomes pointless since it is based on inaccurate assumptions.
It is not, in the long term, ocean temperature driven. There has not been sufficient ocean warming to explain the CO2 long term increase. I will explain why in a future post.
I have in mind increased sunlight at times of less cloudiness driving CO2 out of the sun warmed water rather than ocean temperatures as a whole.
http://www.newclimatemodel.com/evidence-that-oceans-not-man-control-co2-emissions/
If one assumes a static configuration, temperature alone is not enough. However, new parcels of CO2 are upwelling in the lower latitude oceans at every instant of time. Similarly, more are downwelling at high latitudes.
Any net imbalance between what is coming up and going down will produce a continuous change in the pCO2 content of the surface oceans. And, if the ocean surface is experiencing a continuous net increase in pCO2, then that will lead ineluctably to a continuous rise in atmospheric pCO2.
Temperature rise restricts the amount downwelling, while the amount upwelling depends on downwelling centuries previous, and can be taken as an exogenous input for near term (relative to circulation timelines) characterization. So, a temperature rise results in accumulation of CO2 in the surface oceans, and thence to the atmosphere. And, that is why, yes, temperature change alone can indeed explain the rise in CO2 observed over the last century. A more technical discussion follows.
——————————————————
So, for example, suppose dCin/dt is the input from upwelling, and dCout/dt is the output from downwelling. The amount upwelling is essentially an external input, independent of surface conditions – it will force its way in no matter what. The downwelling is going to be proportional to the amount at the surface, with the proportionality factor depending on temperatures, dCout/dt = f(T)*Csurf. We have
dCsurf/dt = dCin/dt – f(T)*Csurf
Suppose at some time and temperature T0, these are in equilibrium with one another, such that dCin0/dt = f(T0)*Csurf0. Then, approximately
dCsurf/dt := – f(T0)*(Csurf-Csurf0) – (f(T)-f(T0))*Csurf0
Suppose Csurf is much larger than dCin/dt such that f(T) is necessarily quite small. Then, we have approximately
dCsurf/dt := -(f(T)-f(T0))*Csurf0
Let us assume that the function f(T) is decreasing as a function of T, such that df/dt = -alpha, for some parameter alpha. Then
dCsurf/dt := alpha*Csurf0*(T – T0)
alpha is small, but Csurf0 is large, so alpha*Csurf0 can be significant.
Atmospheric CO2 must necessarily equilibrate with the oceans, so define a factor k proportional to alpha*Csurf0, and we get
dCatm/dt = k*(T – T0)
This is the form of the dynamic we see in the data, where the rate of change of atmospheric CO2 is observed to be an affine function of T. It is not merely the proportionality of Henry’s law that defines the atmospheric sensitivity to termperature, it is Henry’s law times the flow sensitivity. The units are ppmv per degC per unit of time, and not just ppmv/degC. The amount released to the atmosphere increases over time, until such a time as either the temperature goes back down to the equilibrium level, or until some other limiting factor asserts itself.
If one assumes a static configuration, temperature alone is not enough. However, new parcels of CO2 are upwelling in the lower latitude oceans at every instant of time. Similarly, more are downwelling at high latitudes. Any net imbalance between what is coming up and going down will produce a continuous change in the pCO2 content of the surface oceans. And, if the ocean surface is experiencing a continuous net increase in pCO2, then that will lead ineluctably to a continuous rise in atmospheric pCO2.
Temperature rise restricts the amount downwelling, while the amount upwelling depends on downwelling centuries previous, and can be taken as an exogenous input for near term (relative to circulation timelines) characterization. So, a temperature rise results in accumulation of CO2 in the surface oceans, and thence to the atmosphere. And, that is why, yes, temperature change alone can indeed explain the rise in CO2 observed over the last century.
I do not mean to claim that temperature rise alone is responsible for the rise in the last century. But, it could be. Other factors may come into play. However, we can say with surety that a temperature modulated process is what is driving the rise. Human inputs are not dependent on temperatures, therefore, humans are not responsible for the rise.
A more technical discussion follows.
——————————————————
So, for example, suppose dCin/dt is the input from upwelling, and dCout/dt is the output from downwelling. The amount upwelling is essentially an external input, independent of surface conditions – it will force its way in no matter what. The downwelling is going to be proportional to the amount at the surface, with the proportionality factor depending on temperatures, dCout/dt = f(T)*Csurf. We have
dCsurf/dt = dCin/dt – f(T)*Csurf
Suppose at some time and temperature T0, these are in equilibrium with one another, such that dCin0/dt = f(T0)*Csurf0. Then, approximately
dCsurf/dt := – f(T0)*(Csurf-Csurf0) – (f(T)-f(T0))*Csurf0
Suppose Csurf is much larger than dCin/dt such that f(T) is necessarily quite small. Then, we have approximately
dCsurf/dt := -(f(T)-f(T0))*Csurf0
Let us assume that the function f(T) is decreasing as a function of T, such that df/dt = -alpha, for some parameter alpha. Then
dCsurf/dt := alpha*Csurf0*(T – T0)
alpha is small, but Csurf0 is large, so alpha*Csurf0 can be significant.
Atmospheric CO2 must necessarily equilibrate with the oceans, so define a factor k proportional to alpha*Csurf0, and we get
dCatm/dt = k*(T – T0)
This is the form of the dynamic we see in the data, where the rate of change of atmospheric CO2 is observed to be an affine function of T. It is not merely the proportionality of Henry’s law that defines the atmospheric sensitivity to termperature, it is Henry’s law times the flow sensitivity. The units are ppmv per degC per unit of time, and not just ppmv/degC. The amount released to the atmosphere increases over time, until such a time as either the temperature goes back down to the equilibrium level, or until some other limiting factor asserts itself.
“The amount upwelling is essentially an external input, independent of surface conditions”
This isn’t true, because atmospheric CO2 increases during El Ninos.
http://www.nasa.gov/vision/earth/environment/ElNINO_FIRES.html
Which is part of the surface system.
UAH measures the troposphere, not the surface.
http://www.woodfortrees.org/plot/esrl-co2/from:1979/mean:12/derivative/plot/uah/from:1959/scale:0.22/offset:0.14
Or, surface temperature changes little from 1959-1975, but atmospheric CO2 increased by 5%.
Stupid objections.
Sorry about the double post. It didn’t seem to go in the first time (or second, for that matter).
Why would uptake continue in a linear way, when CO2 concentration in the atmosphere stalls or even is reduced?
Uptake is linked to concentration, of course (the higher the concentration of CO2 in the atmosphere, the more CO2 can be taken up by oceans and plants).
So uptake will b a curve of similar form as concentration, most likely lagging behind a little.
If this was not the case, we would have died from CO2 stravation before we even were alive 🙂
———————
I also think that a flat CO2 output is an extremely optimistic scenario.
As i pointed out in other topics, i expect a serious reduction of CO2 output sooner than assumed as i also see a faster deployment of renewables than assumed today.
BUT: we will need to wait and see, whether the current flatline in CO2 output might just be a pause, caused mostly by economic recession.
we also have to wait and see, what future effects we might get from methan releases or ocean saturation. It is also completely< unclear how price changes for coal, oil and gas will affect future use of these resources.
These are complicated (chemical and economical) feedback mechanisms and i will not claim, that the climate scientists got all their perdictions right.
But i also would not want to plan a future, baesed on the optimistic view that increased CO2 in the atmosphere will be exactly counterbalancing sun-induced cooling.
The premise of flatlining of global emissions seems counterintuitive, given continued growth in Asia and increased population.
The EU has a department focused solely on CO2 emissions growth. Their latest report (2014) indicated 2% year-on-year growth:
http://edgar.jrc.ec.europa.eu/news_docs/jrc-2014-trends-in-global-co2-emissions-2014-report-93171.pdf
I recall a peer-reviewed summary from Sept. 2014, which stated that global CO2 emissions were still increasing at a dangerous rate, thus immediate action was beyond urgent. I recall that there were several dozen authors.
Shout if you’re interested – I’ll dig it up.
Suddenly everything has changed? Doesn’t add up.
Someone’s wrong – as both can’t be right.
I suppose the agenda / strategy has changed from,
“It’s worse than we thought” to
“Look, all our efforts are bearing fruit, look! Just think how much more we could accomplish!”
But none of this need bear any correlation with reality.
Seriously, any loud pierce of P.R. today has one goal: success in Paris.
That emissions growth might be possible. The IEA figures are for fossil fuel emissions. There are other sources, such as biofuels, forest fires, etc.
I read that report. The difference is 3 Billion Tonnes, and includes Cement Production as well as the items I mentioned above. Adding all that doesn’t change much.
Wait … I am curious why atmospheric concentrations of CO2 are being measured from the slopes of a volcano, when volcanoes produce CO2 … it’s like measuring ‘atmospheric temperature’ by installing thermometers in the middle of hot cities …. makes no sense.
My fear is not increasing CO2 in the atmosphere and hydrosphere but it’s the opposite. Decreasing CO2 levels result in decreasing photosynthesis and therefore less vegetation and therefore less food and life.
At 200ppm life on earth will start taking a beating. Imagine our planet without any volcanic activity? How much hydrocarbon fuels will we have to burn to replace that lost CO2?
Pete: Volcanoes emit less than 1% of the CO2 now emitted by humans:
“Volcanic vs Anthropogenic Carbon Dioxide,” T Gerlach, EOS v92 n24, June 14, 2011.
http://www.agu.org/pubs/pdf/2011EO240001.pdf
> I am curious why atmospheric concentrations of CO2 are being measured from the slopes of a volcano, when volcanoes produce CO2
Don’t worry about it. It’s easy to tell when the data has recent volcanic CO2 in it, see http://wattsupwiththat.com/2010/06/04/under-the-volcano-over-the-volcano/
“…might just offset the coming sun-induced cooling.”
What methodology are you using to see into the future?
Projection of current trends. With as little bias as possible.
Oh, that. I thought it had something to do with scientific expectations.
Like the ‘scientific expectations’of temperature rising for the last ~18 years. Riiiiiiight
The global temperature *has* risen over 18 years, according to 6 of 7 global datasets. Only RSS is flat for that time, and there are reasons to be wary of (for example, its global coverage is significantly less than UAH’s).
And of course, the continued rise in ocean heat content shows the planet still has an energy imbalance due to GHGs.
There are many reasons to be wary of the other six!
Such as?
Wait for it.
RSS is the definite outlier, and there are reasons to doubt it — lower global coverage, and a decaying satellite orbit that is adjusted for with a climate model.
“The global temperature *has* risen over 18 years, according to 6 of 7 global datasets.”
No, it has not. “Statistically insignificant” means you cannot way one way or the other.
Moreover, specific temperature sets, such as HADCRUT4 NH, show a definite, statistically significant, decline.
“…cannot say one way or the other.”
Ric, remember a few years ago when the CO2 number DROPPED?? When asked they figured out that too many samples had been dropped for being out of spec. After that they implemented the old infill from past data regime.
At the time I was wondering how too many samples being dropped could cause the reduction in the CO2 level. Wouldn’t it still be an average of the number of days used?? I still am wondering about their relatively closed system.
KuhnKat:
the Mauna Loa Observatory on the side of a volcano gets gusts rich in CO2.
The computer drops out all readings outside of a narrow band of “expected results” – around 80-83% of the total are dropped. Possibly someone forgot to update the computer on what to expect.
The failure of the CO2 level to rise is totally unexpected in Climate “Science”.
There has probably been a drop in emissions in China as their economy slows, but there still has to be faster up-take by nature. Faster plant growth for one and the other major factor might be cooler oceans; so Henry’s law would indicate greater solubility of CO2.
Wow, I had not heard of this. Do you have references on this unbelievable episode of post-modern science?
The methane/CH4 levels stopped increasing in 2001. Why? I agree that some of the CO2 is coming from the oceans, but the CH4 has me beat. The CH4 stopped increasing at the same time global temperatues stopped increasing. Cattle numbers? Termites? Rate of decomposition in the tropics, rate of warming of tundra?
Should we be looking at other atmospheric constituents to solve the problem of how much fossil fuels are responsible for CO2 increases?
Possible answers:
The trend toward lean beef (less corn fed, more grass and hay) would lead to lower flatulence. The price of corn has gone up, so feed lots are using more hay and other grains. Another effect of ethanol production.
Termites are likely temperature dependent.
Decomposition in the tropics has been replaced by burning. This may be the largest change.
In tundra areas, the easily released methane may have been used up.
No, CH4 hasn’t been flat since 2001 — it started increasing again around 2007, and its level is now about 45 ppb higher than 2001.
Data here:
ftp://ftp.cmdl.noaa.gov/data/greenhouse_gases/ch4/in-situ/surface/mlo/ch4_mlo_surface-insitu_1_ccgg_month.txt
I don’t think anyone knows for sure why CH4 was flat from 2000-2007, but more than one scientist has told me it might have been in part due to the collapse of Soviet industry after the end of the USSR.
“There has probably been a drop in emissions in China as their economy slows…”
A recession can cause a decline in the rate of use of fossil fuel, but the effect lasts only as long as the recession.
Possibly a graph of World real GDP would show a similar flatlining. Real GDP removes the effect of inflation, in contrast to nominal GDP.
http://www.indexmundi.com/g/g.aspx?c=xx&v=66
There is a nice graph showing CO2 and GDP. 2014 really looks different:
http://www.theguardian.com/environment/climate-consensus-97-per-cent/2015/mar/18/fossil-fuels-are-way-more-expensive-than-you-think#img-2
The whole article is worth reading:
http://www.theguardian.com/environment/climate-consensus-97-per-cent/2015/mar/18/fossil-fuels-are-way-more-expensive-than-you-think
(end of the article)
BUT: In the past, the connection was simple: More GDP was caused by more production which needed more power which came from coal which gave significantly higher CO2 output
Today, GDP comes from stuff that produces hot air, but no CO2 (insurance, banking, …). And power might come from renewables or gas plants, with no CO2 output or at least significantly less.
And companies using a lot of power have started to *shock* save energy (funny new concept).
So the direct link might be broken at several points, so i would not put too much convidence into a single point of data!
Looking at the 2014 BP Energy report,
http://www.bp.com/content/dam/bp/pdf/Energy-economics/statistical-review-2014/BP-statistical-review-of-world-energy-2014-full-report.pdf
Oil, Coal and Nat Gas consumption has done nothing but go up the past few years. How are emissions flatlining?
As i have pointed out in the past, this BP resource might not be a good source.
Over the last couple of years, BP has been constantly massively underestimated the growth of renewables.
http://wwfepo.blogactiv.eu/files/2015/02/Graph2.jpg
In the latest BP report (alos discussed on this blog) BP simply ignored electric vehicles.
http://www.bp.com/content/dam/bp/pdf/Energy-economics/energy-outlook-2015/Energy_Outlook_2035_booklet.pdf
Even though there was a massive change in that sector:
http://wwfepo.blogactiv.eu/2015/02/18/bp-out-of-touch-on-climate-and-clean-energy-technology/
—————
So my advice: Take the BP outlook/report with enough scepticism.
It is a low range for deployment of alternative power, the real world will see much bigger numbers.
But do electric vehicles even exist? They are like solar. Solar is much less than 1% of global electricity produced, and same goes for miles driven by electric vehicles. Right now the concept of solar and electric vehicles being meaningful in the discussion of global energy consumption is just a figment of the imagination.
The switch from coal to natural gas for power generation. Natural gas releases something like 30% less CO2 per BTU than coal. Of course, this can’t be sustained. We will need to wait and see if renewables will bridge the gap until nuclear (thorium and fusion) start replacing fossil fuels.
If A-CO2 has flat-lined for four years and Mauna Loa CO2 shows the same rate of increase in atmospheric CO2 concentration, where is the additional CO2 coming from?
Why is the amount of additional CO2, whatever it’s provenance, just enough to compensate for A-CO2 emissions?
Abe
The rate of increase has flat lined. As long as the emissions stay higher than can be absorbed, CO2 will increase.
“As long as the emissions stay higher than can be absorbed, CO2 will increase.”
GOOD !!
Ed Caryl,
Thank you for your reply. I’ll have to give it some thought.
Abe
Two things –
(1) we shouldn’t expect an instant response in the atmospheric CO2 levels just because emissions are claimed flatlining – it may be several years before the relationship becomes clear.
(2) Can we RELY on the statement that anthro emissions of CO2 have not increased? Seems rather unlikely to me. Where do the emissions figures come from? I guess they are not being measured directly, but estimated by adding up the estimated//reported emissions from each nation, in which case error bars must be very large..
Anyone help with this?
Annual increase is stabilizing at about 32 GtCO2, give or take.
32 / 3.67 = 8.75 GtC
8.75 GtC / 2.12 = 4.1 ppm of which almost half is absorbed in the oceans.
What’s all the fuss?
The land CO2 sink has been growing over the last 30 years, and is now at least as big as the ocean sink, but these sinks aren’t guaranteed to stay the same. The current issue of Nature (March 19) has an article saying the Amazon may have reached CO2 saturation and the growth is leveling off.
So, David, you still think that the Amazon is the Green lung of the Earth. Now here’s a trick question for you. What do you think happens to a tree after it dies when no humans are around to loot the lumber.
You’re welcome to read:
“Long-term decline of the Amazon carbon sink,” R. J. W. Brienen et al, Nature 519, 344–348 (19 March 2015) doi:10.1038/nature14283
http://www.nature.com/nature/journal/v519/n7543/full/nature14283.html
And you’re welcome to explore a forest to find out.
These researchers explored a forest for us.
David Appell,
In the world of pure logic and rational discourse, of which the scientific method is an integral part, the word ‘may’ is technically categorized as a ‘weasel’ word. Other words in this category are, could, might, maybe, etc. You get the picture, right?
The fact of the matter is that plants, such as ferns, (and many others), continue to absorb more co2 in concentrations of up to 600ppm. (conservative figure) The biosphere has not reached that level, far from it.
Therefore, as long as this fact remains a fact, the Amazon and all other forests that contain ferns, (and other such greenery) will continue to absorb more co2 than presently found in the atmosphere.
Abe
“the word ‘may’ is technically categorized as a ‘weasel’ word”
False. It’s reflection of the science, which has uncertainties.
Science usually does not make definite predictions or provide definite empirical results, except when a theory is very well developed, like thermodynamics or quantum mechanics or quantum electrodynamics. Notice the predictions for the Higgs boson mass were all predicated on certain assumptions….
David Appell,
You said: “False. It’s [a] reflection of the science, which has uncertainties.
Science usually does not make definite predictions or provide definite empirical results,…”
What you describe here is not science at all. You describe post-modern pseudo-science.
To demonstrate what I mean, I’ll quote your words further:
“…except when a theory is very well developed,…”
The scientific method proscribes as a first step the proposal of a hypothesis, not a theory. A theory is only designated as such after the hypothesis has been shown to stand up to scrutiny. But, the most important part of the hypothesis is that it must be falsifiable. If it cannot be falsified it’s not science.
Therefore, if the hypothesis is, ‘the Amazon has reached peak greening because of co2 saturation’ and the conclusion is ‘it may have, or it may not have’, then this is no conclusion at all.
Also, as I pointed out: “…plants, such as ferns, (and many others), continue to absorb more co2 in concentrations of up to 600ppm. (conservative figure) …”
The hypothesis you present from that Nature paper, has already been falsified by previous work. Scientific work. Work that has withstood falsification and so is valid.
Abe
“Therefore, if the hypothesis is, ‘the Amazon has reached peak greening because of co2 saturation’ and the conclusion is ‘it may have, or it may not have’, then this is no conclusion at all.”
That isn’t how science works — hypotheses are rarely proven by one prediction, because there are uncertainties to all observational and empirical data. In fact, strictly speaking you can never prove a hypothesis at all, you can only disprove it.
Thus, in the Nature paper I linked to, every measurement has an error bar. Ever data point has an error bar. So the trends have error bars, from uncertainties about both the observations and due to the statistics.
Scientists spend a lot of time and effort figuring out the uncertainties. They preclude definitive statements. It’s only when a wide set of observations support the hypothesis does language loosen to where we say something is proven or a fact.
One measurement tomorrow could, in principle, overthrow the first law of thermodynamics. (In fact, Pauli pondered doing so as neutrinos were being discovered, to account for the missing energy claimed to be seen in experiments.) But it better be one hell of a measurement.
David Appell,
In the world of pure logic and rational discourse, of which the scientific method is an integral part, the word ‘may’ is technically defined as a weasel word. Let me show you why.
Nature says that the Amazon ‘may’ have reached saturation. But, then again, the Amazon ‘may not’ have reached saturation.
You see how that works, David?
The fact is, many plants continue to consume co2 well above the current level of concentration. As much as 600ppm, (conservative figure).
Therefore, as long as this fact remains a fact, I’ll go with ‘may not’ have reached saturation. As far as science is concerned, this is the expected outcome.
Abe
Abe, why should I believe you know more about this subject than the scientists who study it for a living, collect all the data, and analyze it?
“Long-term decline of the Amazon carbon sink,” R. J. W. Brienen et al, Nature 519, 344–348 (19 March 2015) doi:10.1038/nature14283 – See more at: https://notrickszone.com/2015/03/29/co2-emissions-have-been-flat-for-four-years-what-does-this-mean-for-the-future/#comment-1021861
I suspect it’s just that you don’t want to believe the data….
Problem is that too many scientists have become psychologically obsessed with a certain outcome, and so they can no longer be believed. Some are actually re-writing data.
“Problem is that too many scientists have become psychologically obsessed with a certain outcome, and so they can no longer be believed.”
So-calleld “skeptics” display nothing like that, do they? (eyeroll)
“Some are actually re-writing data.”
Who, specifically?
Every month GISS completely rewrites their entire data base, after GHCN also rewrites theirs. The changes are small, but, in sum, they are continuously one way: cooling the past, warming the present. It is a continuously shining example of confirmation bias. Just like yours.
“Every month GISS completely rewrites their entire data base, after GHCN also rewrites theirs.”
So do UAH and RSS rewrite theirs. So does BEST. So does *everyone*.
This is called “doing science.” All these published numbers come from models, and not unexpectedly shift a little as new numbers come in.
“doing science” LOL.
“come from models” and we all know that the models can’t go wrong.
/sarc off
All data comes from models. ALL OF IT.
The data models used by UAH, RSS, GISS, HadCRUT, etc, in effect predict what current station temperatures would be *if* the stations had been unperturbed.
But only a small minority of stations are unperturbed over the decades — most break down, or are moved, or adopt a newer technology, or are read at a different time of the day, or several of these. It requires a model to account for these biases and remove them from the raw data.
David Appell,
“Abe, why should I believe you know more about this subject than the scientists who study it for a living, collect all the data, and analyze it?”
Your appeal to authority won’t work. It’s what I was referring to when I said: “In the world of pure logic and rational discourse, of which the scientific method is an integral part,…”
Post-modern pseudo-science accepts appeals to authority. Because of this, having a consensus has become valid within it. The scientific method rejects illogical fallacies and non-rational statements for what they are. Junk.
Abe
“You are not supposed to believe anything. You are obligated to evaluate all claims for yourself.”
I’m 100% (plus or minus 0%) you don’t do this. Nor does anyone, anywhere — there is too much information to process.
It took these scientists decades to collect the Amazon carbon data. You haven’t gone out and done your own data collection.
Some trust is inevitably required in any field of inquiry, unless you are prepared to say you know nothing at all except what you have proved personally. Peer review, quality journals, replication, reputations, experience etc all help. But in the end some trust is required.
David Appell,
“Abe, why should I believe you know more…”
That’s the point right there. You are not supposed to believe anything. You are obligated to evaluate all claims for yourself.
Abe
I wrote a long reply here, but it wasn’t approved by the moderator. Not writing it again.
My apologies for the duplicate post. 🙁
Thought the first one got lost.
Abe
Pierre, are you now blocking my comments?
No. Obviously not. There’s this thing called moderation. I know that in these times when everyone expects everything to happen instantly waiting a bit can be bothersome. But in the dream future of the warmists, people will have to get used to walking, biking and having things get done slowly. You of all people should welcome the slower, gentler pace.
Moderation seems to be sometimes, others not. Apologies if I’m wrong.
It seems you don’t moderate my comments until you’ve noticed I’ve made a couple of them. Then moderation gets turned on.
Why moderate, anyway? What does it accomplish?