Now that it’s spring, it’s as good a time as any to look at polar sea ice. Climate scientists have told us time and again that global warming would first be been at the Earth’s poles.
Well, if that is true, then we need to start worrying about cooling.
In the Arctic the following chart shows a clear stabilization taking place over the past 8 years with an upward trend over the last five years:

Source: Cryosphere Today, Arctic Climate Research, University of Illinois
It needs to be pointed out that there are many factors impacting sea ice. Among them are ocean currents and cycles, and prevailing weather patterns. In summary, however, the once feared “death spiral” remains totally absent.
Had the past five years been centered about the -1.75 million sq km anomaly in the Arctic, then the warmists may have had a point. But that is not the case as the Arctic sea ice is close to 1 million square kilometers above the alarm level.
A number of high-profile scientists and meteorologists also are now projecting growth in Arctic sea ice over the next 10-20 years as major oceanic oscillations shift to their cooler phases.
Record-smashing Antarctica, warming totally AWOL
If you are a global warming alarmist, then the situation is even more confounding at the south end of the Earth. Especially at the Earth’s southern pole is warming totally AWOL.

Source: arctic.atmos.uiuc.edu/cryosphere
Because Antarctica is surrounded by water, trends there do behave differently then what goes on in the land-surrounded Arctic.
Consider the following stunning points about Antarctica:
1. Antarctic sea ice has been above normal for almost 3 years uninterrupted.
2. Three years uninterrupted above normal sea ice is unprecedented over the satellite record.
3. Record after record sea ice highs have been set during that period.
4. The trend for the last 10 years has been stunningly strong.
5. The long-term 30-year trend is strongly upwards.
From Antarctic sea ice trends, there’s absolutely no indication that there’s any warming going on down there. If scientists had been warning of cooling, they’d be having a much easier time today convincing the public.
Indeed Antarctica is the very place that AGW alarmist scientists don’t want anyone to look at. In fact today there’s almost no climate data they want you to see – only the “adjusted” surface temperatures that they themselves cook, manipulate and alter.
Global sea ice trend positive since 2006!
Finally charts and data on total global sea ice show absolutely no alarm. Global sea ice has been at a normal level for almost 3 years now. Overall the recent trend is upward, thus indicating cooling – and not warming:
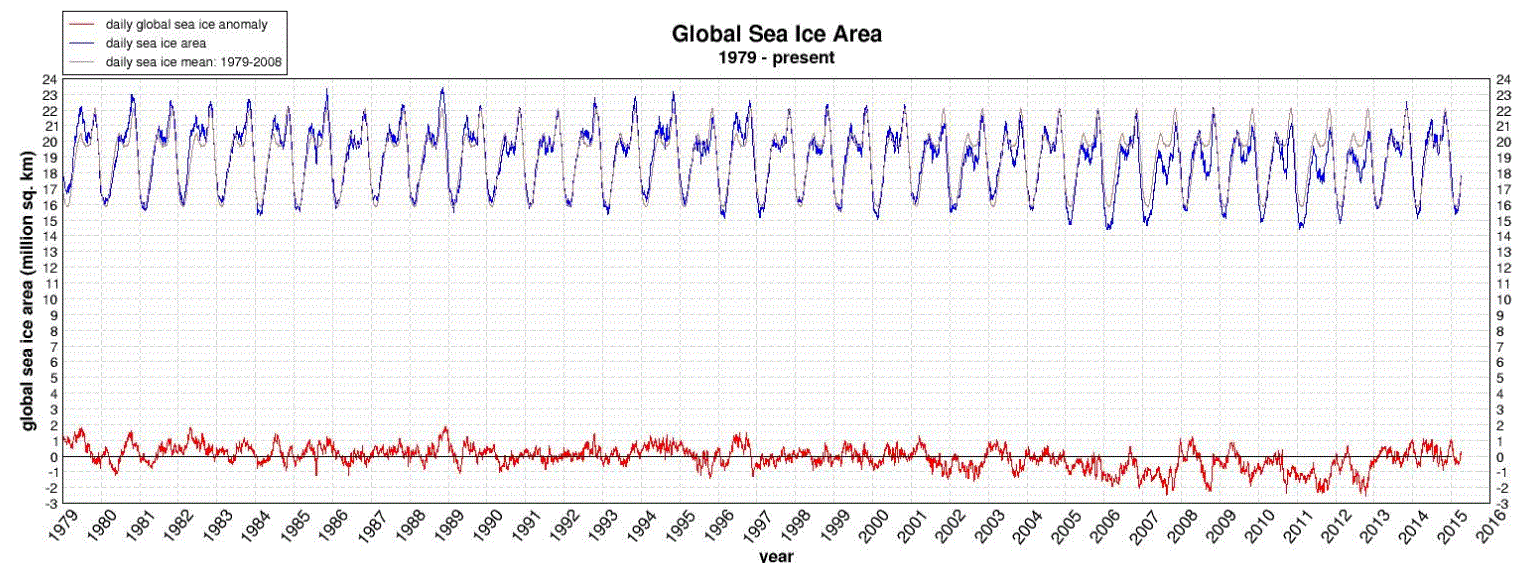
Source: arctic.atmos.uiuc.edu/cryosphere
The above global sea ice anomaly chart shows that there was a brief downward trend from 2004 to 2012, but that loss has since been completely wiped out. The overall trend since 2006 is upwards. In fact the mean of the last 2 years is as high as it was 35 years ago.
Don’t listen to the doom and gloom of the government bought climate scientists. You can look at the data yourself. A good place to do this is over at Anthony Watts’s sea ice page here.


Question I’ve had for awhile: Is the polar-sum sea ice chart more or less useless?
I ask because the Arctic and Antarctic are vastly different from each other. Isn’t adding them together akin to homogenizing the earths’ temperature into a single number?
The two polar regions are different in that one is an ocean surrounded by land and the other is land surrounded by ocean, but the same in that both are the cold polar regions. The two regions tend to see-saw a bit due to ocean cycles, so summing the ice makes more sense than treating them individually. The sum indicates that nothing much is happening regarding global temperature.
” The sum indicates that nothing much is happening regarding global temperature.”
sorry, but that is false. Only the arctic has big amounts of multiyear sea ice.
When you are adding areas. you are adding multiple meter thick 7 year old arctic ice to thin 1 year antacrtic ice.
and with current trends, you are replacing the former with the latter. that does not make any sense.
If 1 year old ice melts, it might take a year to replace it. Can you guess how long it takes to replace 7 year old sea ice?
Just for the fun of it, how much of the Antarctic ice is 1 year old, Sod?
You are getting really desperate now boyo!
sod 11. April 2015 at 20:02 | Permalink | Reply
“If 1 year old ice melts, it might take a year to replace it. Can you guess how long it takes to replace 7 year old sea ice?”
Now the existence of ice is no longer the criterion, but its age? Like with wine?
Sod, you warmunists only obsess over polar ice in the first place because you need SOME kind of “bad” news to hang your movement on. What value has a frigid icecap in the first place? Life on Earth thrived much more than it does now when there were no icecaps at all, and a much higher CO2 content in the atmosphere. At least according to the orthodox, current view of history.
Also, it does not matter how old ice is when it melts – replacing it takes exactly the SAME time. Think rationally for a second.
multi-year sea ice is an important thing. Read about it:
https://nsidc.org/cryosphere/seaice/characteristics/multiyear.html
Pathetic Sod, you are the one who should be reading. Piece of advice, stay away from topics you obviously know nothing about, it will save you from ridiculous mistakes.
“stay away from topics you obviously know nothing about.”
Then we would have a silent sod.
“The two regions tend to see-saw a bit due to ocean cycles, so summing the ice makes more sense than treating them individually.”
It’s exactly the opposite, for the reason you gave: one is an ocean surrounded by land, the other is land surrounded by ocean.
That makes the Antarctic much more susceptible to changes in winds, and, along with freshwater melt from Antarctic glaciers, they seem to go a long way to explain the increase in Antarctic sea ice extent.
http://www.realclimate.org/index.php/archives/2014/12/clarity-on-antarctic-sea-ice/
Finally, “summing” the SIE from both poles shows a large decrease, as Arctic sea ice has been melting about 10 times faster than Antartic is gaing sea ice, by volume (which is the appopriate metric here).
The “appropriate metric” to use for alarmists is always the one that supports their doomsday visions. One tornado or a hurricane often suffices. When you get down to it, almost every appropriate metric is not cooperating.
Explain to me why sea ice extent is a better metric than sea ice volume for detecting changes in climate.
The only reason extent matters is for the ice-albedo feedback. Volume is a much better indicator of changes of temperature for the air and ice.
The only physical reason extent matters is for the ice-albedo feedback. Volume is the indicator of temperature (ocean and air).
When the ice was melting, albedo was the accelerating factor – one of those scary tipping elements. Suddenly that the ice is expanding, it’s not that important anymore? You guys stopped being serious 15 years ago.
“Volume is the indicator of temperature (ocean and air).”
“Volume is a much better indicator of changes of temperature for the air and ice.”
This shows your sloppy thinking. Make up your mind. Is volume of ice
a) indicator of temperature
b) indicator of CHANGES in temperature (what is the CHANGE of a value ALSO called mathematically?)
c) SOMETHING ELSE
We are NOT at Common Core here, David.
“Suddenly that the ice is expanding, it’s not that important anymore?”
That is not what I said at all. The negative ice albedo effect from any positive change in Arctic SIE in the last couple of years is dwarfed by the positive feedback since 1979.
How quickly the moderation gets turn back on when your narrative is countered by the facts…..
You have no facts, you never have had.
Did you ever get around to answering Gator’s questions.
or are you still running with your head up your a*** ?
No Andy, he never did. And he never explained his bipolar (certainly no pun intended) attitude toward radiosondes. Just ask amirlach.
http://www.climatechangedispatch.com/scientists-debunk-climate-models.html#comment-48977
Heh. Pierre challenged David Appell’s evolving narrative and Appell responded by arm waving about moderation.
David has been thrown out of so many sites that he now has this expectation that it must happen everywhere. Genius, Pierre is a one man operation and uses wordpress’s automatic spam detection. Your MODEL is wrong. (Nothing new there)
This is how moderation works, Appell:
https://coloradowellington.files.wordpress.com/2015/04/this-is-how-moderation-works.png
How about using the time and publishing the ordered list of forcings you are rumored to have?
Yep CW, Pierre’s auto-mod has some strange features 😉
Would be interesting to know what trigger’s it.
lol.. my comment about the auto-mod, just got caught.
Pierre only moderates me when he starts to get afraid of losing the narrative. It happens every time after I make a few comments — immediate moderation. In this case, comments are even being censored.
Typical of you to make things up, David. The rules apply to everyone here equally. Many comments are held up for moderation. And because I am not generously funded like those on the alarmist side, my site is a one-man volunteer operation and I have to get sleep at night. That means comments that are held up have to wait until morning to be approved. Obviously this post has got you peeved. A little good news and you flip out and go on a commenting marathon with the hopes of defending your end-of-world view.
You are an IDIOT, Appell.
And a cry-baby to boot.
GROW THE F*** UP !!
Time zones, David, time zones!
You made a silly and pathetic complaint about moderation. I offered you a chance to respond like a grownup. You choose to continue with infantile attacks on the host instead.
While arctic ice extent was indeed lower this year due to winds, the ice VOLUME is actually higher than last year. We actually have more arctic ice, it is just thicker and more compact in area. I noted at various times this winter that the sea ice was actually flowing NORTH up the east coast of Greenland rather than flowing south into the Atlantic. Anthony’s site has a daily Arctic Sea ice drift map and a volume model. It certainly looks to me like the downward trend in sea ice volume has reversed the past few years.
” It certainly looks to me like the downward trend in sea ice volume has reversed the past few years.”
A shift in trend needs to be demonstrated with statistical tools. But if you use those, you will find only one significant sea ice trend: The arctic going down.
Please provide me a link showing the opposite!
“” It certainly looks to me like the downward trend in sea ice volume has reversed the past few years.”
If so, that is a pity. Russia and other northern countries would have benefitted immensely from having their Arctic shorelines accessible for more of the year.
If it had kept decreasing, it may have reached to the low levels of the mid 1930’s.
Global warming, up to the peaks of the MWP and earlier Holocene periods would have been an absolute Godsend to nearly all life on Earth, especially with the increased atmospheric CO2.
Very unfortunately, that appears not to be happening. 🙁
“Global warming, up to the peaks of the MWP and earlier Holocene periods….”
1) We’re past the peak of the Holocene:
http://www.realclimate.org/images//Marcott.png
2) “…would have been an absolute Godsend to nearly all life on Earth…”
This is a simplistic statement with not a shred of science behind it. It avoids discussing droughts, increase in low oxygen zones in the ocean, threats to crop production, changes in crop nutrition and minerals with higher CO2, changes in ocean pH and cadbonate saturation state and their impact on calcifiers, and more.
Marcott as been totally debunked and trashed.
You know that, yet you still use it. Fool.
Just like all your other nonsense and what’s with that utter strawman of the last paragraph.
There is zero evidence of any climate disruption by CO2. Just natural weather variations. Only modelled fabrication of ocean pH changes. Droughts have been less severe.
The whole paragraph is a nonsense.
Increasing areas of ocean oxygen depletion..
Nope. You are wrong again.. nothing unusual about that, is there, putz.
https://www.sciencenews.org/article/world%E2%80%99s-largest-ocean-dead-zone-may-shrink-earth-warms
“Smothered oceans: Extreme oxygen loss in oceans accompanied past global climate change,” University of California at Davis press release, 1/28/15.
http://news.ucdavis.edu/search/news_detail.lasso?id=11129
Read bozo,
the areas of oxygen depletion are DECREASING.
Its one fabricated, erroneous scare after another from you lot.
NONE OF IT IS HAPPENING. !
From that text..
“Our modern ocean is moving into a state that has no precedent in human history.”
roflmao !! very funny stuff, that is for sure.
The temperature has, thankfully, climbed maybe 1ºC since the LIA, which was the coldest period in the whole of the Holocene and not up to the MWP or anywhere near the Holocene optimum.
That warming has unfortunately CEASED, and all real predictions point to a cooling trend again. A big pity, because another 1ºC would have done wonders for the planet.
Sea levels can be shown to have been higher by at least a couple of metres in many areas, have maybe been on a constant very slow rise, that seems to be slowing down.
The only difference is that the atmosphere now has a tiny, but highly beneficial, amount extra plant food to keep the carbon cycle clicking over.
“It avoids discussing […] threats to crop production,”
Hey, David, yeah, let’s discuss how a C3 plant likes it when there’s 30% more CO2 in the air shall we… or even a C4 plant like corn, because while a C4 plant CAN photosynthesize down to 0 ppm CO2, it DOES stop once it has depleted all of it in its proximity, and therefore can photosynthesize for longer if more of it was around. Which helps explain current record c rop production, and the greening of the Sahel.
Yeah, let’s discuss crop production in detail, you’ve opened up a stimulating area there. Also, let’s discuss which areas are more bioproductive, cold ones or warm ones. Costa Rica or Greenland? Any guesses?
The really big threat to crop production is the moronic anti-CO2 brigade.
Those idiots actually want to slow down the supply of nature’s main building block.
That would be stupidity to the max !!
Why are you concerned about how plants are doing? They were doing fine at 280 ppm. More CO2 harms their value to the things that eat them:
It’s now known that elevated-CO2 decreases the nutritive value of crops like wheat, rice, barley and potatoes, which are major food sources for the world. Even with CO2 fertilization, wheat protein concentrations decrease by 3% at CO2=559 ppm.
http://www.yaleclimateconnections.org/2014/10/crop-nutrition/
http://davidappell.blogspot.com/2014/04/wheats-nutritive-value-decreases-under.html
http://news.ucdavis.edu/search/news_detail.lasso?id=10886
“Increasing CO2 threatens human nutrition,” Samuel S. Myers et al, Nature 510, 139–142 (05 June 2014).
http://www.nature.com/nature/journal/v510/n7503/full/nature13179.html
“They were doing fine at 280 ppm”
What absolute BS.. again.!
How about you go on diet of stale bread and water… basic subsistence level.
The nutrition in that study dropped because they didn’t have the basic nouse to realise that when something is growing 20-30% faster, it need more trace nutrient.
ie they were incompetent.. just like you.
But even then, while the percentage nutrition understandably dropped due to their incompetence, the total nutrient in the plants still increased.
Real horticulturalists using real greenhouses know better, and have for ages.
Trends starting in 1979, at the bottom of the ice age scare, are not particularly meaningful, except to portray a false sense of CAGW
The Antarctica trend is up and has been throughout the period
A) Trends start in 1979 because that’s when satellites starting providing good data.
B) There was no “ice age scare” except for a few hyped articles in a major magazine or two and a TV program narratred by Leonard Nimoy. A thorough, peer reviewed search of the literature of that time found no consensus on global cooling:
“The Myth of the 1970s Global Cooling Scientific Consensus,” W. Peterson et al, Bull. Amer. Meteor. Soc., 89, 1325–1337, 2008.
http://journals.ametsoc.org/doi/abs/10.1175/2008BAMS2370.1
In fact, by then plenty of scientists were already worried about CO2 (and modeling its impacts).
Talk about being in denial. The talk and consensus indeed was global cooling and ice age dread. Even in Spiegel in Germany wrote in 1974 that scientists said the chances of any warming in the future were “1 in 10,000 at best”. Sorry, as much as you’d like to forget the cooling scare, it’s right there in bold print.
“The talk and consensus indeed was global cooling and ice age dread.”
Prove it.
A detailed literature search of the time found no such consensus. Why should I believe you?
Whose search? Oreskes? Cook?
C’mon! The major outlets were fretting over it. Stephen Schneider was even in Nimoy’s show. You’re being very obstinate, David. You’re not open.
Pierre and David, here’s documentation of the 1970’s ice age scare:
http://www.populartechnology.net/2013/02/the-1970s-global-cooling-alarmism.html
Appell is known to be an ardent denier of the 70ies cooling scare.
Walter Cronkite certainly that it was a real concern back in 1972:
http://cdn.mrctv.org/sites/default/files/videos/converted/14255594643.mp4
Video clip
sod 11. April 2015 at 18:23 | Permalink | Reply
“A shift in trend needs to be demonstrated with statistical tools.”
Ach, sod, sod, sod. A TREND, what is that? A trend is a MODEL. What are you talking about when you say “a shift in trends”. Are you talking about a linear trend, a periodic function? Your statement is undecipherable. Maybe you mean, the FAILURE of a MODEL (a.k.a. trend) needs to be demonstrated. Well we’ve been doing that for years now with the hopelessly derailed IPCC models. Why don’t you go to w.m. briggs and read a little about statistics so that you stop torturing the language.
http://wmbriggs.com/
Also notice that the doomsters favorite TREND or MODEL or PREDICTION , PIOMAS, gets a facelift EVERY YEAR. Yes, they change it every year! It always predicts less ice in the future (which would be a good thing in my book, the doomsters of course are terribly worried about one of the two regions on the planet with the lowest biodiversity, they cherish their lifeless regions don’t they). In other words, the “shift in trends” can best be seen in the annual discarding of the previous best guess of Government Scientists. This is really beyond parody.
“..the doomsters of course are terribly worried about one of the two regions on the planet with the lowest biodiversity….”
a little look back to 1951 and as the Northern regions warmed , wildlife started to flourish-
http://trove.nla.gov.au/ndp/del/article/139508884?searchTerm=glaciers%20in%20south%20america%20%20disappeared&searchLimits=
“PIOMAS, gets a facelift EVERY YEAR. Yes, they change it every year!”
What is wrong with that? The whole point of a model is to make a better model.
Therefore you CANNOT compare year to year.. which make it basically POINTLESS. !!
“According to scientific measurements, both the thickness and extent of summer sea ice in the Arctic have shown a dramatic decline over the past thirty years. This is consisistent with observations of a warming Arctic.”
https://nsidc.org/cryosphere/seaice/characteristics/difference.html
So you’re not exactly right. In fact you’re completely wrong. I also notice this post doesn’t mention land ice, which is melting at an increasing rate in antarctica and greenland. Over 140 gigatons annually. Sea ice freezes every year, land ice is what has people concerned.
Rick, at 140 gigatons of Land Ice Melt a year as you noted, how long would it take to melt Antarctic Land Ice. And is the melt due to Man Made CO2 being added to the atmosphere? Is it a catastrophe?
“land ice is what has people concerned.”
Arctic is nearly all sea ice.. so no concern.
Antarctic land ice is nearly all many many degrees below zero… so no concern.
Glaciers have been receding since the LIA, quite naturally…. so no concern.
So…….
DON’T PANIC !!
rick 12. April 2015 at 18:07 | Permalink | Reply
“Sea ice freezes every year, land ice is what has people concerned.”
So you warmunists shift the goal posts from sea ice to land ice when the sea ice extent does not play along.
I understand that, as I have never understood your movement as scientific.
The graphs of both the Arctic and Antarctic sea ice suggest 60 + year cyclic activity, similar to what we see in the PDO and AMO. I don’t think there is enough information yet on the “Southern annular Mode” (Antarctic Oscillation) to know it’s periodicity.
Jut found this ice-related video on WUWT, h/t newsel, hope it works:
http://vimeo.com/14366077
“A number of high-profile scientists and meteorologists also are now projecting growth in Arctic sea ice over the next 10-20 years as major oceanic oscillations shift to their cooler phases.”
Who?
Gees, I thought you tried to come across as actually having done some research on the whole subject.
Although, from your posts, obviously very little.
Just the normal 10 year old propaganda based on alarmista non-science.
Pierre wrote:
“In the Arctic the following chart shows a clear stabilization taking place over the past 8 years with an upward trend over the last five years.”
Come on — what is the statistical significance of that statement?
In my calculations, using the monthly Arctic SIE from NSIDC, I find a positive trend statistically significant at the 95% confidence level (barely) for the last 2.8 years.
There is a negative trend that is barely statistically signficant at the same level for the 7.3 years.
All trends 10.7 years or longer are negative and statistically signficant at 95%.
That’s if you assume no autocorrelation, which isn’t a very good assumption. You need a lot of years to get a statistically significant trend in that case.
Short trends like over 5 years mean absolutely nothing about climate change. All they mean is that a month with relatively low SIE is more likely to be followed by another month with relatively low SIE, which is obvious.
NSIDC SIE data:
ftp://sidads.colorado.edu/DATASETS/NOAA/G02135/
“That’s if you assume no autocorrelation, which isn’t a very good assumption. You need a lot of years to get a statistically significant trend in that case.”
Ah! Suddenly you think there MIGHT be some autocorrelation? Not bad, David, not bad.
The data here clearly shows once again that all AGW has to offer is talk and to make wild claims based on no hard data but rather speculation at best which is to kind of a word to use.
AGW theory is the only theory I have ever come across that lives on, with out any data to back up anything that it says or claims from the various atmospheric processes it has predicted which have all failed to materialize, to the global temperature trend which is being proven more incorrect as each month passes, to not be able to reconcile this theory in any way ,shape or form, that shows a correlation between CO2 concentrations being the driver of the past climate when contrasted with the historical temperature record, to not being able to establish that the temperature change over the last 150 years is somehow some kind of a first time occurrence, when the reality is the climate over the past 150 years is quite stable when contrasted with earlier periods of time when looking at the historical temperature record.
This theory have nothing to back up any of the claims it keeps making and yet it lives on.
Salvatore, you have a lousy track record:
“…here is my prediction for climate going forward, this decade will be the decade of cooling.”
– Salvatore del Prete, 11/23/2010
http://ourchangingclimate.wordpress.com/2010/10/20/andrew-dessler-debating-richard-lindzen/#comment-8875
“Temperatures in response to this will decline in the near future, in contrast to the steady state of temperature we presently have,or have been having for the past 15 years or so.”
– Salvatore Del Prete, 11/6/2012
http://www.drroyspencer.com/2012/11/uah-v5-5-global-temp-update-for-october-2012-0-33-deg-c/#comment-64939
“you have a lousy track record:”
From you, that is hypocrisy/irony/satire.. at its absolute worst. !!
Have you got that list of climate factors for us yet, or are you still going to keep cowardly avoiding and running away.?
You have nothing… and you know it.
David the long term climate trend from the Holocene Optimum some 8000 years ago (6000 BC) to present day is down despite the so called modern warming blip(1850-1998) and it will likely continue going in a jig saw pattern down trend going forward.
David, is 8000 years long enough?
David , how do you reconcile 30 years of Antarctic Sea Ice increases when all of the AGW models predicted the opposite?
Your answer is probably the data is wrong, not long enough or misleading because like always if the data does not support AGW something with the data is wrong instead of the theory.
This the first time in history when data is suppose to conform to the theory rather then the other way around, and if the data does not conform to the theory instead of proving the theory is wrong ,it instead proves the data to be wrong.
What absurd nonsense.
“The talk and consensus indeed was global cooling and ice age dread.”
Prove it.
A detailed literature search of the time found no such consensus. Why should I believe you?
There is plenty of evidence of so-called scientists making press statements about catastrophic cooling.
Just because they didn’t have the balls to lie so obviously as now, and didn’t have politically backed agenda to allow them to get away with publishing BS paper, like nowadays, doesn’t mean it didn’t.
Stop DENYING the blatantly obvious.
You KNOW there was a “scare” about global cooling in the lead-up to the farce of the global warming scare.
That means that you are blatantly lying when you deny it.
But that’s what you are.
That’s what you do.
David, this will hurt your beliefs but you really ought to read through this overview of the “consensus” during the 1970’s:
http://www.populartechnology.net/2013/02/the-1970s-global-cooling-alarmism.html
before you continue with your preaching.
and while you are at it, you should take a look at the other lists of publications from the same source.
You keep avoiding this link,by your silence:
1970s Global Cooling Alarmism
http://www.populartechnology.net/2013/02/the-1970s-global-cooling-alarmism.html
I LIVED through that decade as a Teenager, who generally followed it through books,magazines. It was talked about a lot then, David.
Salvatore, the sea ice part of the models aren’t very accurate. At the same time, they are underpredicting Arctic sea ice melting.
“the sea ice part of the models aren’t very accurate”
None of the climate models are anywhere near accurate about anything. You know that, thanks for the confirmation, bozo.
“Salvatore, the sea ice part of the models aren’t very accurate”
So, there’s an error in each time step while they try to simulate a chaotic system… and the error accumulates and propagates… and as the system is chaotic, deviations get amplified, not dampened…
…which tells me that the climates models have no chance at all to get 2100 right. But you know that. Just like the makers of the Limits To Groth model KNEW they were just using computers for agitprop, so do todays Government Scientists know what they are doing. This is not incompetence, it is corruption.
David is in the world of denial.
I am a Naval atmosphere control tech. All this AWG is complete malarkey. Give me a 2 million dollar grant and I’ll prove it. I’ll even have a computer model it for you. Idiots.
Question for David A
Is NCEP now a member of the vast denier conspiracy with their much more finely tuned grid that measures global temp. Last year since the PDO decadol flip. Notice what happens after the warm ENSO event.. With the AMO now turning cold, just where do you think temps will go after this enso event. But I am curious, has NCEP suddenly become a denier in the last 10 years
http://models.weatherbell.com/climate/cfsr_t2m_2005.png
The answer will be given to us in the next 20 years. I offered this several times on national TV over 5 years ago, simply watch the temperatures as the oceans complete their cycle, WELL DOCUMENTED BY SOMEONE WHO HAS A TRACK RECORD FORECASTING THE WARMING, AND RESULTANT HURRICANE PICK UP BACK IN THE 1970S, DR WILLIAM GRAY
http://tropical.atmos.colostate.edu/Includes/Documents/Publications/gray2012.pdf
And why doesnt total global sea ice make a difference. It certainly did when it was running below normal several years ago. And why cant we see if the hypothesis is correct, that the increase in temp was a function of the natural cyclical warming of the ocean, which are reversing now. Another 10-15 years, given 20 years of busted hype, is not going to hurt.
And why shouldnt people be very suspicious, given statements like this from the leaders of this movement
http://www.c3headlines.com/global-warming-quotes-climate-change-quotes.html
So why would I not take these people at their words as to their true motives
As I have explained many times, climate is a TOOL for me to make my forecast. I am watching people “blame” the Pacific for the very idea we used last year and this year to forecast a cold winter in the east, simply by using the same idea that we saw before. So it makes no difference to me. I will still use the methodology that people are discovering ( the latest is the warm blob, apparently they are oblivious to 1917-1918, or the late 1950s, or 1970s, which Jerome Nemias wrote about many years ago…. do you know who Jerome Nemias is David? But back to the easier question. Is NCEP, which clearly shows what is going on, now in the denier camp?