By Ed Caryl
In my last article, we discussed the Greenland ice core temperature record. In this article we will discuss the Greenland thermometer record. All the long record thermometer readings are from villages and stations on the coast. Some of these records go back to the early 1800’s, though GISTemp only posts records going back to 1880.
Here is plot of seven stations. Annual averages were downloaded from GISTemp and converted to annual anomalies using the 1951 to 1965 average for each as the baseline, the only years all seven stations had in common.
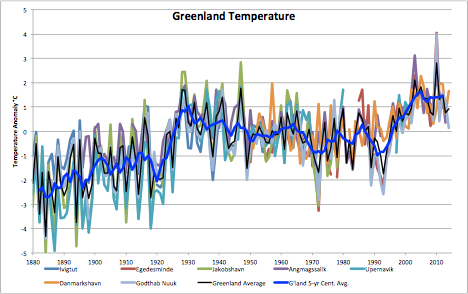
Figure 1 plots seven Greenland temperature records, their average (the thin black trace), and a five-year centered average of the average (wide bright blue trace).
This result agrees with other papers that were found, for example Box et al 2009. Considering that land surface station records warm an average 40% greater than the global land-ocean average, and that Northern Latitude stations warm an average 40% higher than the global land-ocean average, with Arctic stations averaging higher than that, it makes sense that this combination of surface stations in the northern latitudes will warm at twice the rate of the global average.
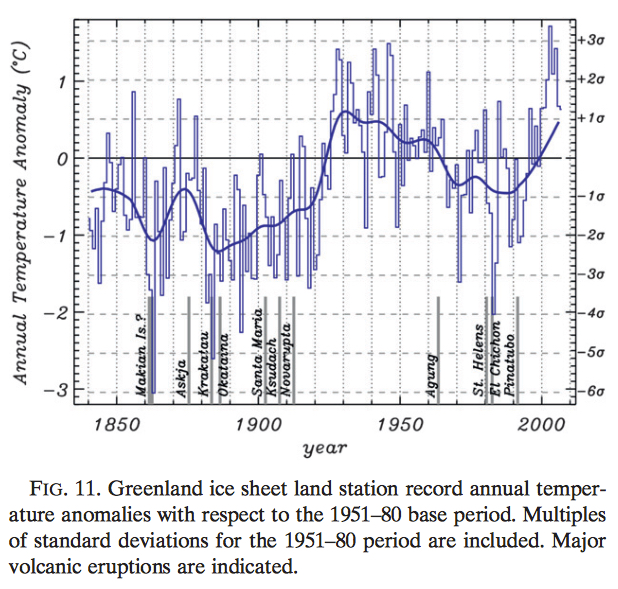
Figure 2 is from Box et al 2009, figure 11.
Jason Box’s paper shows that temperatures before 1880 were generally warmer than the decade after 1880, only about one to one and a half degrees colder than at present. The interesting thing is the step-change in temperature between 1920 and 1930. Greenland temperatures stepped upward by two degrees in this decade, the same step as in the 1990 to 2000 decade. But there was no rise in CO2 in those years. Both intervals are preceded by volcanic activity, as shown in Box’s figure 11. The volcanic activity is blamed for the cooling.
But there was cooling for four decades after 1930 without any major volcanoes. If the lack of volcanic activity is to be blamed for the steps upward in temperature, but temperature declined for four decades without volcanoes, what is left for CO2?
There are several logical twists and turns illustrated here. If volcanic eruptions are blamed for the cooling periods, especially in Greenland, with lack of eruptions blamed for warming, only some of the cooling dips are explained. The other cooling episodes are presumably because of ocean current/temperature cycles or the sun. This leaves only a single one decade warming period, from 1995 to 2005, that can possibly be blamed on CO2, though it still could be from those other reasons. That period is really a step at 1998 which we know was due to the El Niño of that year. This is pretty thin gruel on which to float climate calamity.


Science proves that CO2 has no significant effect on climate. The proof and identification of the two factors that do cause reported climate change are at http://agwunveiled.blogspot.com (now with 5-year running-average smoothing of measured average global temperature (AGT), the near-perfect explanation of AGT, R^2 = 0.97+ since before 1900)
Dan, I note you are a Mechanical engineer. Thermodynamics and Heat transfer are important subjects for Chemical and Mechanical engineers (see Perry’s Chemical engineering Handbook and Mark’s Mechanical Engineering handbook) so instead of talking about science you could say engineering science or plain engineering. Very few scientists have any understanding of the above engineering subjects and that especially applies to so-called “climate scientists”. Even Dr Judith Curry does not fully understand -she fell for the garbage from Pierrehumbert -although she has now changed for mind about him. Dr Gavin Schmidt (NASA-GISS) admitted he did not know about the Schmidt number.
I have two old copies of Mark’s (don’t ask why).
Thanks for the suggestion. I will use it.
I have used the term engineering/science some times. I have also seen engineering referred to as a ‘hard science’.
I have two old copies of Mark’s (don’t ask why).
Thanks for the suggestion. I will use it.
I have occasionally used the term engineering/science. I have also seen engineering referred to as a ‘hard science’. Your comments reinforce my perception that climate scientists, even with a PhD in physics, appear to have a poor grasp of thermodynamics and heat transfer and are unaware of this lack of knowledge.
‘it makes sense that this combination of surface stations in the northern latitudes will warm at twice the rate of the global average’. Why twice that rate?
If you take the sum (or the mean) of a number of measurements, local effects including measurement errors, level out if they are uncorrelated over time. The higher your station number and the broader the coverage area, the less the variance of the means. Probably, this is what you want to say. Ever noticed that a trivial transformation from Celsius to Fahrenheit also changes the variance? The only thing you have to do, is multiplying the Greenland deviation scores (anomalies) with a constant,
c = sqr (Var-World/ Var-Greenland).
In this way you can prevent another round with warmists about trivialities. Apparently, your contribution aims at people who believe their beloved horse is still alive. You can bury a dead horse. You may even invite the Pope for a sermon on that occasion but how do you weaken a dead horse?
1.4 multiplied by 1.4 = 1.96.
OK, Ed, you cannot compare the rate of change of the global average and the rate of change of the Greenland average, because the anomalies are expressed in different units. This is caused by different station numbers at least. On random sampling: Var(mean) = Var (scores)/n, with n sample size or station number. This is a well-known formula in statistics, showing that the variance of a mean decreases proportionally with sample size.
The effect is enormous. Because we are not sampling randomly, we should be cautious, but let the Greenland station number be 7 and the global number 700. Let the single station variance be VAR, then the Greenland variance would be VAR/7 and the global variance VAR/700. So you have to multiply an arbitrary increase of Greenland temperatures with sqr(1/100) = 0.1 for a valid comparison. In this example the Greenland warming rate would be trivially ten times the global rate.
The safe procedure is to compute global and Greenland variances and apply the formula I gave you. In the same way you can calibrate Greenland temperatures from ice core proxies and from thermometers, using a period of overlap.
Your sqrt formula applies the Law Of Large Numbers. This law only holds for properties with a normal distribution. Temperature has no normal distribution but a Cauchy type distribution (as a consequence, the average is not defined, and the law of large numbers is not applicable).
(Even though the warmunists constantly talk about temperature averages, that doesn’t make them mathematically defined)
If we compute the covariance between station time series that statistic goes to zero as the latitude distance increases. In the end their is no common or global signal with notable variance. This may underline your point.
But the measurements are NOT uncorrelated over time.
That’s correct, Ed. In that case the variance of the mean approaches the variance the measurements have in common. Globally that is not very much. See my reply to Dirk.
“This leaves only a single one decade warming period, from 1995 to 2005, that can possibly be blamed on CO2 … ”
I have come to the conclusion that Gerlich and Tscheuschner are correct and an “atmospheric Greenhouse effect” is a complete myth.
There is nothing in the history of the Earth to contradict this
Atmospheric GRADIENT effect !
CO2 does NOT affect the atmospheric gradient.
Sun-Climate 101 illustrations (North & South of Thermal Equator) updated with 17 more months of sunspots & SST (sea surface temperature):
https://tallbloke.wordpress.com/2015/06/05/noaa-tries-to-make-global-warming-slowdown-vanish/comment-page-1/#comment-103130
multidecadal heat engine map-animations before-and-after “official adjustments” to SST & sunspots forthcoming (timing of controversial adjustments in US election cycle = informative)
And now read the following:
http://www.co2science.org//articles/V15/N40/EDIT.php