So, where’s the warming?
Robin Pittwood at the New Zealand Kiwi Thinker here has posted an update on the climate bet for charity that NoTricksZone and its readers entered with a gaggle of global warming cultists, among them Dana Nuccitelli and Rob Honeycutt.
So far we are 4.5 years into the current decade and Robin tells us that it is running cooler using RSS and UAH satellite data, which Messieurs Honeycutt and Nuccitelli agreed to use.
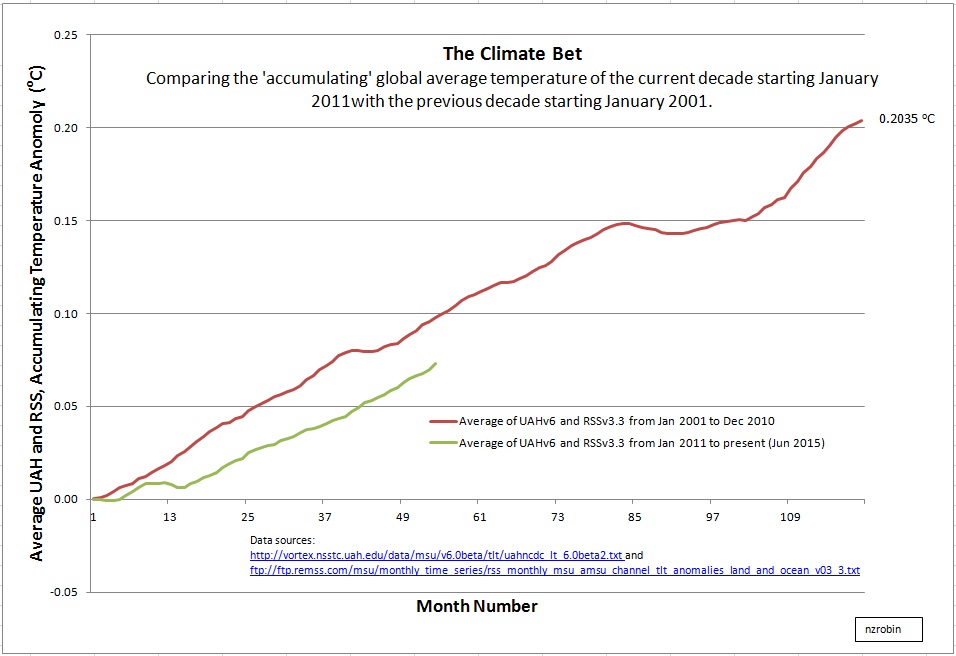
Source: Kiwi Thinker.
Awhile back in comic fashion devout anthropogenic global warming believer William Connelly even demanded the terms of the bet be changed. So clearly we see panic setting in.
At his latest July 18 Saturday Summary here, Joe Bastardi presented the latest NCEP global temperature chart for the past 10 years, and here more confirmation that the globe has cooled off a bit.
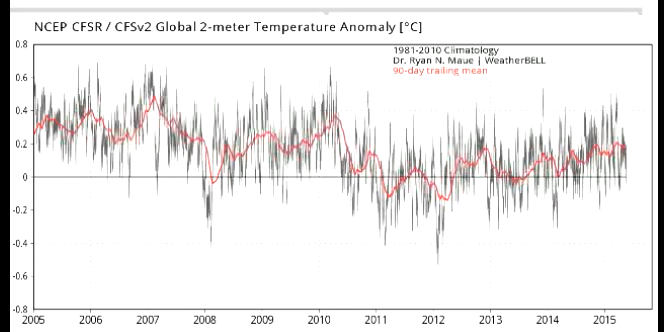
Image cropped from Weatherbell Analytics Saturday Summary.
It really is tough to find warming anywhere outside of models. Joe, as polite as he is, is unable to hold back his ridicule of the warming claims.
Of course this year is an El Niño year and so we are going to see the gap close somewhat, or perhaps even see the current decade become a bit warmer than the last – for a little while. But as many readers here are familiar, cool La Niñas typically follow El Niños. Moreover the North Atlantic has turned cool and that will make the battle that much tougher for those betting on a warmer current decade.
Even if the warmists somehow did manage to pull it off, the trend would end up being far below what the models predicted and so it would be a very hollow victory that we could all live with.


Who was it who paid up at the beginning of the bet? Was it Rob?
I guess it is easier to pay before the bet has begun as it is less painful than at the end when the bet is actually lost. Good forward planning!
Looks like he might have saved himself a bit of pain, but he still has a chance of a token victory.
I am confused. Kiwithinker’s graph shows an increase in temperature of 0.27 C in temperature since 2001 and approximately 0.15 C since 2005.
The weatherbell graph is from a different source (NCEP CSFR global 2m anomoly?) which shows a decline since 2005.
What is the difference between these data sets?
Hi Pierre,
Back to your old tricks again I see? This going to be as easy as stealing sweets from kids. At least the proceeds will go to a good cause.
http://www.reportingclimatescience.com/news-stories/article/has-the-pdo-flipped-to-a-warming-phase.html
Yep getting desperate.
Part of understanding climate change comes from discovering what does NOT cause it.
Proof that CO2 has no effect on climate is expressed in steps as follows:
1) Atmospheric CO2 has been identified as a possible climate change forcing. Forcings, according to the ‘consensus’ and the IPCC, have units of J s-1 m-2.
2) A thermal forcing (or some function thereof) acting for a time period accumulates energy.
3) If the forcing varies (or not), the energy is determined by the time-integral of the forcing (or function thereof)
4) Energy, in units J m-2, divided by the effective thermal capacitance (J K-1 m-2) equals average global temperature (AGT) change (K).
5) Thus (in consistent units) the time-integral of the atmospheric CO2 level (or some function thereof) times a scale factor must closely equal the average global temperature change.
6) When this is applied to multiple corroborated estimates of paleo CO2 and average global temperature (such as extant examples from past glaciations/interglacials ice cores, and proxy data for the entire Phanerozoic eon), the only thing that consistently works is if the effect of CO2 is negligible and something else is causing the temperature change.
Identification of the two factors that do cause reported climate change (sunspot number is the only independent variable) is at http://agwunveiled.blogspot.com (now with 5-year running-average smoothing of measured average global temperature (AGT), the near-perfect explanation of AGT, R^2 = 0.97+ since before 1900).
The ongoing average global temperature trend is down. Monthly reported temperatures are being temporarily propped up by el Nino.