German Professor Fritz Vahrenholt and Frank Bosse present the solar report for October 2015. The current cycle continues to be a weak one.
=======================================
The Sun in October 2015
By Frank Bosse and Fritz Vahrenholt
[Translated/edited by P Gosselin]
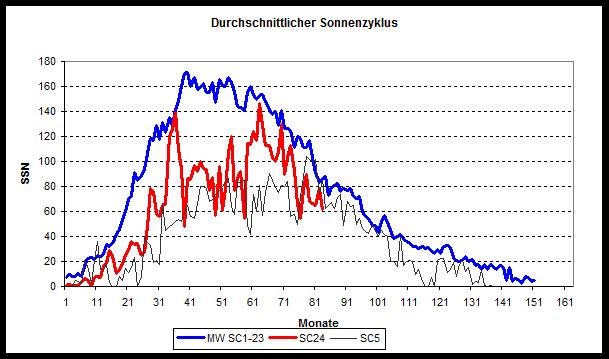
In October, 2015, our mother star was less active than in September. The solar sunspot number (SSN) was 61.7, only 72% of what is normal this month into the cycle compared to the mean of the observed cycles since occurring 1755. In detail:
Fig. 1: Our current Solar Cycle 24, which started in December 2008, is shown by the red curve and is compared to the mean cycle (blue) and to the very similar solar cycle 5 shown by the black curve.
What really stands out are negative anomalies that occurred during the cycle ramp-up and the ensuing plateau phase. Until the 54th month the sun was only 47% as active as the mean. But later beginning at about month number 62 the current cycle followed along below the mean closely. Since then the current cycle has been tracing at about 73% of the mean value. Over the entire cycle so far the current cycle has been running on average at 56% of the mean. What follows is a comparison of all cycles:

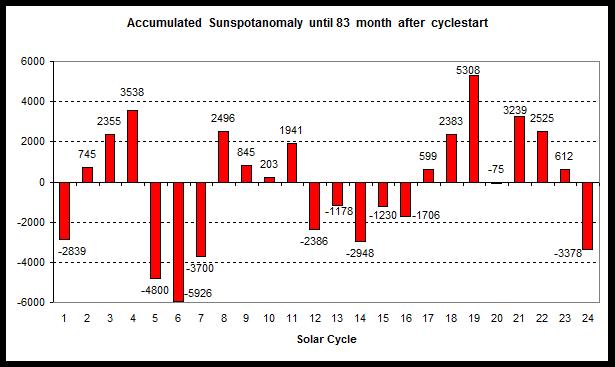
Fig. 2: Comparison of all the cycles. The bars represent the SSN anomaly from the mean for 83 months into the cycle.
One clearly sees the activity hump in the middle of the 20th century, from SC 17 to SC 23. This was recently investigated at a conference at the end of October, 2015, which worked out the solar forcing for a new generation of climate models (CMIP6):

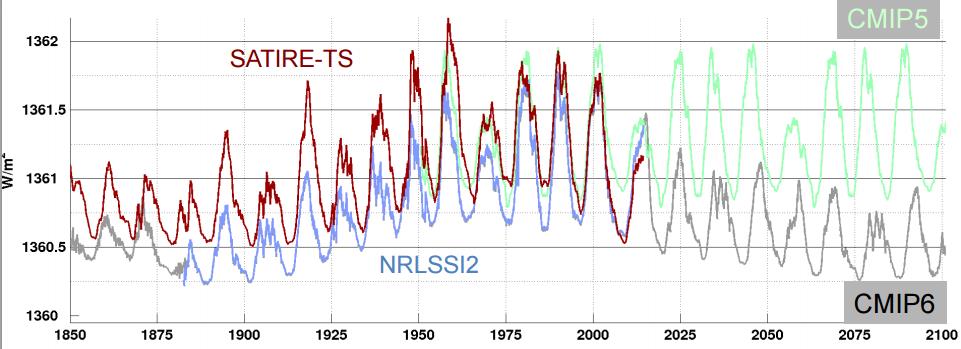
Fig. 3: Solar forcing for new climate models, source: Matthes & Funke 2015.
The contribution by Katja Matthes of the Geomar Center in Kiel, Germany and Bernd Funke of the Astrophysical Institute in Granada sees an increase of approximately 1 W/m² on average between 1880 and the level of 1950 to 2000 (light blue curve in Fig 3). Now a prediction until 2075 sees a drop in value to that of 1880 (grey in Fig. 3). One, however, does need to be careful with the forecast. The sun is a very dynamic star. Yet, the assumption that the solar irradiance is constant, which was the case in the older models (CMIP5 in light green), is being abandoned.
Today the solar forcing of the sun is assumed to be greater by a factor of 5 over what was assumed just a few years ago (e.g. Feulner & Rahmstorf 2010) when conventional climate science and also the IPCC accounted for a solar irradiance TSI variation of only 0.2W/m².
Clearly the sun is gaining more influence in the world of climate modeling, as it is getting neglected less in the new models. However we will not being hearing anything about these findings from the media during the upcoming Paris conference: There the sun will have no effect on our current climate. The only thing of any concern in Paris is trace gas CO2.


And taking our money off us.
[…] Articolo originale […]
Our climate simply isn’t that sensitive to changes in solar irradiance. This is easy to see:
Before the greenhouse effect, Earth’s average surface temperature is well modeled by
S(1-albedo)/4 = sigma*T^4
where T = 288 K and S is the TOA solar insolation, 1365 W/m2. So
dT/dS = T/4S = 0.05 K per W/m2.
As I said, not much of anything.
dT/dS =
Oops. I meant T = 255 K (i.e. before the greenhouse effect).
dT/dS stays the same, 0.05 K per W/m2.
“Oops. I meant T = 255 K (i.e. before the greenhouse effect).”
An earth without the Greenhouse effect MUST be a planet without water and/or without an atmosphere, and with a completely different albedo. Please describe the planet “without greenhouse effect” that you model here. Does it have an atmosphere? Does it have water?
“Our climate simply isn’t that sensitive to changes in solar irradiance.”
As seen from the sun, our planet Earth is a disk with diameter 12750000 meters. The area of this disk times 1 kW/h and square meter insolation divided by 1,700 kW per barrel of oil equivalent, represent the energy content of 20 million barrels of oil of energy bombardement per SECOND. That is 24/7.
A one -1- permille change in insolation over the time since the Little Iceage Through (let’s say 350 years ago) represent the energy content in 230 TRILLION barrels of oil.
This is obviously beyond any doubt an energy amount more than big enough to influence the temperature on Earth, hence the climate.
/
(In paranthesis, one leap year day’s insolation is equivalent to 1,800 billion barrels of oil worth of energy.
Insolation has varied in the 8-9% area over as short a timeframe as the last 9-11,000 years. That is well into the age of Modern Man. As a result of increasing temperatures, Homo not very Sapiens has spread from Africa now to be found all over the planet.
11,000 years worth of 8% variation is equivalent to 5.8*10e17 (or 579 million billion) boe’s worth of energy.)
/
Attn Pierre, I came accross a soest.hawaii paper which argued there for seawater was a pH reduction from 7.000 to 6.997 while adding one millimol H+ per kilo seawater in the form of HCl. That millimol represents what happens with “acidification” for 1 millimol CO2 converting through carbonic acid to bicarbonate and free hydroxyl ions H+.
There are other details as eg the seawater was not seawater but rather a laboratory controlled environment engineered substitute and that the start pH of said nonsense seawater was 7 (also nonsense).
BUT… Said addition of H+, with said concentration calculated up to the full weight of our vast oceans, amounts to 155 billion barrels of oil worth turning into CO2 (at 400 kg/bbl).
Meaning there is no or only a tiny pH reduction for the total amount of planet’s reserves of oil and gas (coal and methane clathrates not included).
Oddgeir
As seen from the sun, our planet Earth is a plate with distance across 12750000 meters. The region of this plate times 1 kW/h and square meter insolation partitioned by 1,700 kW for each barrel of oil equal, speak to the vitality substance of 20 million barrels of oil of vitality bombardement every SECOND. That is day in and day out.
An one – 1-permille change in insolation over the time following the Little Iceage Through (suppose 350 years back) speak to the vitality content in 230 TRILLION barrels of oil.