Last week the media, led by the Washington Post, screamed and hollered the North Pole was in meltdown as temperatures there rose some “5 degrees above normal”. In Europe some media outlets did not even bother converting the 50° Fahrenheit figure to (the less impressive sounding) 32°C.
It is true that the temperature right at the North Pole was “estimated” by “weather forecast models” to have supposedly reached the melting point – for a period of a few hours. But what the news media neglected to tell readers is that the North Pole region itself is actually a vast area – and one that is extremely poorly measured – as even the Washington Post admits. The Arctic region as a whole in fact did not warm up anywhere near 32°K (50°F) last week.
Only a fraction of the Arctic saw a large warm spike
The reality is that weather charts showed only a minority fraction of the Arctic saw temperatures near the melting point, while the vast remainder remained stuck at its usual 25 – 40°C below zero range.
According to the Danish Meteorological Institute here, which has been systematically tracking Arctic temperatures north of 80° latitude since 1958, here’s what the 2015 “North Pole meltdown” really looked like (far right) once the whole Arctic region got factored in:
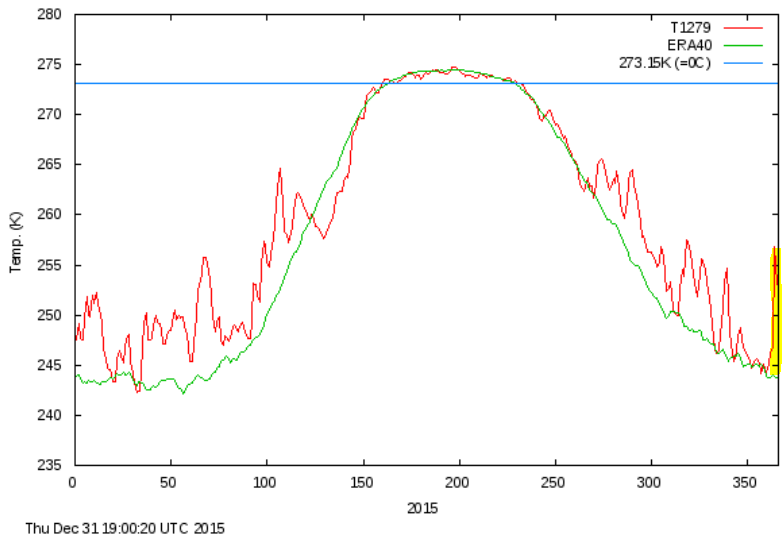
Chart: DMI.
The above DMI figure shows that the temperature in the Arctic above 80°N was estimated to have risen only some 13°K during the event, and not 30°K as the WAPO tried having its readers think. Note how also in early March 2015 the Arctic saw a similar rise.
Just a few hours after the local region near the North Pole saw a burst of warm southern air, almost immediately temperatures there dropped back to -30°C.
Has a 13°K spike happened before?
Is a 13°K temperature spike in the high Arctic something weird and totally unusual that we need to worry about? Going back and looking at the DMI charts over the past 58 years, we find that such temperature spikes in the Arctic for the period early November to late March are nothing new.
For example a look at the year 1959, the chart below shows that a similar temperature spike occurred not just once, but twice! (marked yellow).
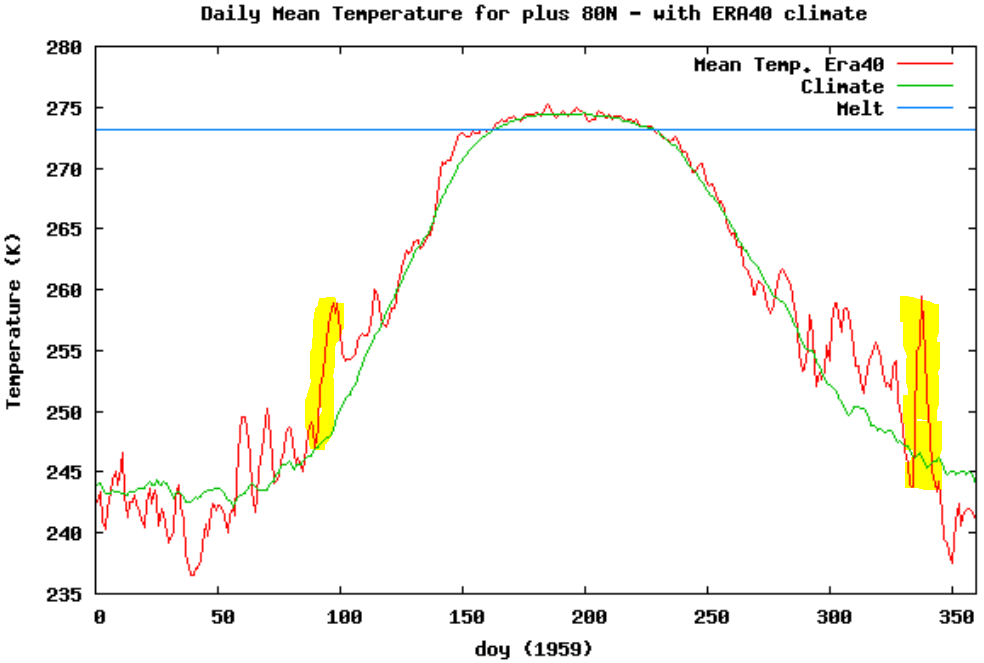
Chart: DMI.
And examining all the years since 1958 we see that a temperature spike of some 12°K or more in a matter of a few days (during the November to March deep winter period) occurred more than 70 times! And over 100 times for spikes of 10°K and more.
Clearly we see fluctuations of 10°K (i.e. similar to what just happened) in a matter of days are actually the norm for the North Pole region.
Also taking a look at the wild fluctuations seen in 1964, 1984, or 1990 – back when CO2 was at levels near or below the “safe” 350 ppm – we see they were far more extreme.
What does this tell us about the reporting by the Washington Post, and all the other media outlets who allowed themselves to be duped and irresponsibly played along? It shows that many mainstream journalists are agenda-driven, not interested in digging, and that their sole aim in reporting climate science is to fabricate junk-science-based scare stories that have no journalistic merit.
They’ve degraded themselves to acting as the mouthpieces for a dishonest agenda.
Also read more here.


“They’ve degraded themselves to acting as the mouthpieces of some dishonest agenda.”
But, just like warm spikes in Arctic winter, this media degradation happens regularly as well – approx. since 1898 when Hearst riled up the US public for the imperial war against Spain (“Democracies” of the West are to the most part not controlled by violence and terror, though there are occasional exceptions, but by propaganda).
I see Warmunism as a normal continuation of this primary motive of Western media. And the collusion of government-payed scientists is entirely normal as well. Warmunism is in this regard the NORMAL progression of science in its MAIN role of deluding the public.
Remember how every libtard troll accuses non-progressives of being “anti-science”. They know what they’re doing; they are using government science as a club to wack all government critics as irrational.
So how can we find the truth? We will not find it in government science – it is a propaganda instrument only – and an enormous waste of resources.
Leftists lie. They always have. It’s one of the personality traits that distinguishes them as Leftists. And it’s understandable why they do, because if they told you the truth, you wouldn’t want to have anything to do with them.
Here, for e.g., is Head (case) of the DNC, Debbie Wasserman Schmutz (see last post on page) caught doing what she does best.
Note the deafening silence of the MSM, and all the Democrats she represents.
I am no longer surprised by their brazenness as they tell their ever more distorted whoppers.
“…the temperature in the Arctic above 80°N was estimated to have risen some 13°K during the event, and not 30°K like the WAPO tried to have its readers think.”
Even if converting from Kelvin to Fahrenheit, it would only be 23.4 Degrees, which to a warmunist is ALMOST 30.
Heck, I’m surprised they didn’t say it was 67 degrees, you know, like 80-13. I mean, like they are both degrees, and all.
(Next time a warmist tells you AGW is “simple arithmetic” tell them to have an adult check their maths.)
[…] https://notrickszone.com/2016/01/04/journalistic-fraud-north-pole-region-saw-similar-warm-spikes-befo… […]
One of the main ways the Earth loses heat is via storms taking heat from the equator to the poles, where any remaining heat is dissipated. Strong storms can give substantial spikes in air temperature, as the normal frigid air is mixed with warm air and condensing water vapour from the equator.
This is an entirely normal and routine process, as is the feeding frenzy of those propaganda websites that nicely feature the count of Hiroshima bombs, warning us not to take anything they say seriously.
Part of the problem is that the AGW charlatans have been successful into somehow convincing the masses that weather, and the planet for that matter, is tranquil. Must be the hippy in them but they think that, or want to, earth should be this utopian wonderland where the temperature is a beautiful 72* where people live and is only frigid at the poles and that the poles always stay so cold that it’s unimaginable. They’ve also been quite successful at changing weather terms even experienced meteorologists use regularly—such as the word ‘normal’. Growing up, I can’t recall even tv mets (who, for the most part, weren’t mets at all but just reporters doing a side gig assigned by seniority) using the word ‘normal’ when referencing anything pertaining to weather. One would never hear them say ‘that was 10* above normal’. They used the word ‘average’ because that’s the baseline current temps are judged against. As in the 30 year average the NWS uses. Today’s temperature was 7*above average. There is no ‘normal’ in weather, only averages. Just as they convinced the masses with the term ‘global warming’ before they realized the warming had stopped and were being mocked. Then they changed their movement to ‘climate change’ to cover everything. The sad part is, the only public figure I’ve seen mock them (and then only briefly) is Donald Trump. He’s not my personal candidate of choice, though I will support him if he’s the nominee, but he’s the only one with the balls, the chutzpah, to challenge the freaks in this country who think every cause of theirs is just and must be tackled immediately without really thinking things through. It’s the way a juvenile perceives the world, which is kind of ironic since that’s precisely the way the emperor acts.
Anyway, we need to start pushing back, and hard. Since media outlets like the NY Times, Washington Post, etc. wouldn’t dare publish articles from anyone who dare challenge the socialists (kind of like the Communist Party run newspapers in countries like China & North Korea) experienced scientists need to pressure outlets like the Wall Street Journal to do a real expose. Not just say the AGW kooks are socialists, anarchists, charlatans, etc., they need to publish a major story on the behind the scenes movers & shakers & their relationships with the emperor & other officials who write policy for the government. The story needs some meteorological history to show this has all happened before, even way before the evil Industrial Age which is when the juvenile thought process begins.
It’s pure propaganda. No way they can reasonably make any assertions regarding temperature records at the pole.
The most northerly land station is a Canadian station at Alert. It is located at 82.5167N 62.2833W and is 833 km from the pole. Any readings north of there must be coming from buoys floating in open water or trapped in the always moving icepack. In either case they are being pushed by random winds and currents with their general motion being away from the pole.
“The most northerly land station is a Canadian station at Alert. It is located at 82.5167N 62.2833W and is 833 km from the pole. Any readings north of there must be coming from buoys floating in open water or trapped in the always moving icepack.”
Here is a plot of some buoys data:
http://gergs.net/wp-content/uploads/2015/12/Buoy_300234062785480.png
You can clearly see the spike above zero, so the claims were no fraud.
The washington post story mentioned above, does not claim an arctic circle above =°C, but some regions close to the pole. They even show a graph:
https://img.washingtonpost.com/wp-apps/imrs.php?src=https://img.washingtonpost.com/blogs/capital-weather-gang/files/2015/12/gfs-actual-temp-and-departure.png&w=1484
The Washington Pest story is titled:
“Freak storm pushes North Pole 50 degrees above normal to melting point”
So, three questions:
1. How is it that the North Pole is not above the Arctic Circle?
2. How is it that a “freak” weather event, which Pierre has shown isn’t unusual, is even newsworthy?
3. Why are they construing that non-unusual WEATHER event as climate?
Many people don’t actually read news items beyond the headline, a fact that El WaPo knows,…
https://www.washingtonpost.com/news/the-fix/wp/2014/03/19/americans-read-headlines-and-not-much-else/
…it doesn’t matter if they correct those errors in the body of the text. The lie will stick, but the facts not so much.
P.S. _ Sod also writes this nonsense:
“The washington post story mentioned above, does not claim an arctic circle above =°C, but some regions close to the pole.”
Sod, if a region is close to the pole, then it is, by definition, ABOVE the arctic circle.
“The North Pole lies about 2,600 kilometers (1,600 miles) from the Arctic Circle.”
http://www.newworldencyclopedia.org/entry/Arctic_Circle
And that, my dear sod, is the distance (as the crow flies) from Tampa FL to Rapid City SD.
http://wdistances.com/tampa-fl/rapid-city-sd
Why, we’re practically next door neighbors!
The buoy is at 86° N, that’s 240 nautical miles from the pole:
You have: 240 nauticalmiles
You want: km
* 444.48
/ 0.00224982
or quite a ways in km.
The Washington Post image is from the NCEP, that stands for the National Centers for Environmental Prediction, so that was just a forecast.
I’m sure it got warm enough around the pole. No big deal, it seems to happen a few times a year.
Meanwhile, at latitude 12°S, there was 10 cm of snow! It happens.
https://endtimeheadlines.org/2015/12/heavy-snowfall-in-peru-in-the-summer/
“You can clearly see the spike above zero, so the claims were no fraud.”
Yes.
But the claims forgot to tell that this is normal and has happened multiple times before.
That’s just not telling the whole truth and is typical left behavior.
“But the claims forgot to tell that this is normal and has happened multiple times before.”
When was it that warm that close to the pole at that time?
Please name a year and provide some data.
Read the article. Do you need to be so obtuse?
Your Morning Cup of Weather Joe – January 4, 2016
https://www.facebook.com/pages/WeatherBELL-Analytics-LLC/136363209762203
That cold air from the arctic is going to visit you guys in the USA.
Thanks Pierre.
That took a nice piece of your time.
I looked at a couple of those “temperatures north of” charts about 3 years ago.
I noticed the spikes. So I checked a few more. Spikes.
So, I looked at an odd dozen or so years. No shortage of spikes.
Conclusion: Temperatures up there are (a) cold; and (b) changeable.
Although winter is not as cold where I live, we do get rapid ups and downs.
Sometimes the warmth is caused by a Chinook.
Don’t tell Leonardo DiCaprio.
Most significant winds have local names. The Harmattan, Mistral, and Santa Ana are 3 well known ones. Because the Arctic Ice is not settled there are no Natives to give a name to the winds that cause these spikes. Perhaps, somewhere along the edges the people might take notice, but if so, I am unaware of it.
Sod gave a link to one buoy, and it shows very erratic temps, with numerous spikes of various sizes. But the one spike everyone is making a fuss over was very narrow and was only a few (about 8) Deg more than the Dec4 spike which was broader. And the early November data had a broad elevated range, the max of which was just 5 Deg lower than ‘the big one’.
See for yourselves.
I’m not impressed.
I tried to find more info on what all the buoys are doing, and came up with what at first looked like pay dirt, but which turned out to be a pack of duds, as far as the ones I wanted to display were concerned. Maybe someone else here can figure out how to do that?
http://iabp.apl.washington.edu/maps_daily_table.html
“. Maybe someone else here can figure out how to do that?”
Here is data showing the spike a little further away from the pole:
http://psc.apl.washington.edu/northpole/AXIB132472_atmos_recent.html
I am also interested in this. Can somebody provide more links?
32C is really warm, that would be 10C you mean.
From the same source as sod’s buoy data (a warmist site) we read that “a huge North Atlantic storm system…” caused “…the North Pole…(to)…experience a short burst of above zero air temperature…”
They show an image of what the temps were forecast to be like due to the storm, as well.
I.e., the poles aren’t warming by themselves.
Living in Florida, I track hurricanes very intently, and have any number of times in the past seen them heading North. I wouldn’t be surprised if recent Arctic warming is at least in part due to heat carried there by these storms.
Note that 2012 had fewer and weaker storms than usual, and none got that far North.
https://upload.wikimedia.org/wikipedia/commons/thumb/f/fc/2015_Atlantic_hurricane_season_summary_map.png/800px-2015_Atlantic_hurricane_season_summary_map.png
Speaking of tropical cyclones. I wonder how much the difference in their behavior below and above the equator has on the fact that the Antarctic ice has been growning, while the Arctic has diminished slightly?
I think Pierre is onto something when he asks “What happens to tropical warmth up north?” Because when you look at the warmth carried North, it appears to very greatly exceed that carried South.
http://www.goes-r.gov/users/comet/tropical/textbook_2nd_edition/media/graphics/GlobalTropicalCycloneMap.gif
No. Nothing to see there. It MUST be the CO2.
Sheesh!
http://blogs.lse.ac.uk/impactofsocialsciences/2014/06/03/the-perils-of-the-press-release/
This is primarily for s*d who does not appear to read widely or sceptically.
I suggest a purchase of a large English Dictionary ( printed ) so he? can find out the meaning of s*d which is nor PC at all.
PC may or may not accept “People who struggle with same sex attraction”, though.
http://blogs.lse.ac.uk/impactofsocialsciences/2014/06/03/the-perils-of-the-press-release/
This is primarily for s*d who does not appear to read widely or sceptically.
I suggest a purchase of a large English Dictionary ( printed ) so he? can find out the meaning of s*d which is not PC at all.
PC may or may not accept “People who struggle with same sex attraction”, though.
[…] The quacks and frauds of the media are pushing their false agenda like charlatans and drug dealers Here is a small sample at Climate Depot: Journalistic Fraud: North Pole Region Saw Similar Warm Spikes Before…OVER 70 TIMES In Last 58 Year… […]