The Sun in February 2016
By Frank Bosse und Fritz Vahrenholt
Translated/edited by P Gosselin
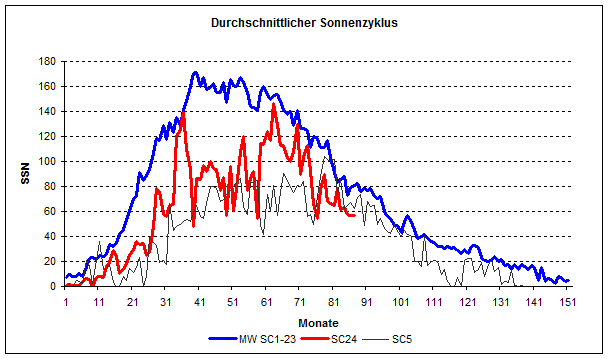
In February 2016 the sun was well below normal in activity, just as was the case for the previous several months. The observed sunspot number (SSN) was 57.2. The mean of previous cycles 1 to 23 for this month into the cycle is 80.8. This means last month of cycle no. 24 was only 71% of what is normal.

Figure 1: Solar cycle 24 activity so far (red) compared to the mean of cycles 1 to 23 (blue) and the similar solar cycle number 5 (black).
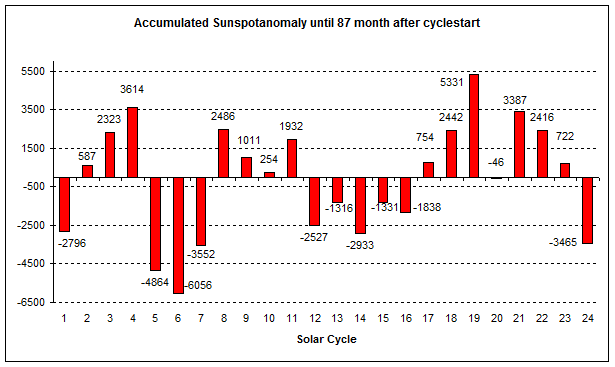
A comparison of all 24 cycles follows:

Figure 2: Accumulated sunspot anomaly for each cycle, 87 months after starting. Each bar shows the accumulated monthly deviation from the mean. The current cycle is the weakest in almost two centuries, since solar cycle number 7.
In total solar activity for cycle number 24 has been a mere 57% of the mean with respect to the number of sunspots. It is very probable that the cycle will be among the 3 weakest since observations began in 1749 and end up in the same category as those occurring during the Dalton Minimum (c1790-1830, SC 5 to 7).
What can we anticipate after solar cycle number 24?
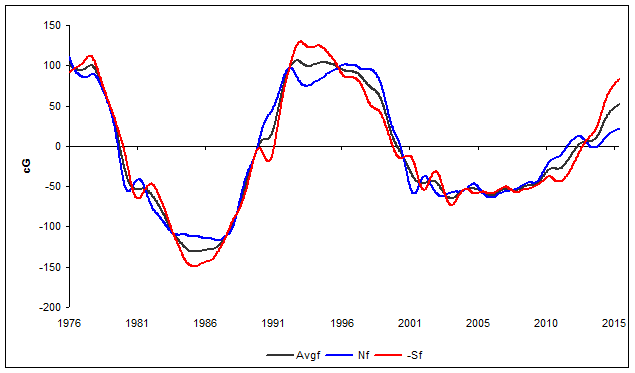
In our last solar report here noted that the first indication for the coming cycle is the strength of the sun’s magnetic polar field during the cycle activity minimum before the start of the cycle. There is still some time to go before we reach this activity minimum, yet we would like to take a glance at the polar fields. The data can be obtained here, and we computed them until the end of February 2016. Here we use the smoothed data (marked with “f” for low-pass filter) because the unfiltered data are characterized by having too much short-term variation.

Figure 3: The smoothed data series of the sun’s polar magnetic fields: the mean value (black), the northern hemisphere (Nf, blue) and the inverted southern hemisphere (-Sf, red).
The polar fields oscillate phase-shifted with sunspot cycles: During the maximum the polar fields have a pole reversal (zero-pass) and vice versa. After the SSN maximum of 2013 especially the fields of the NH are growing significantly slower than the pole reversals measured since the mid 1970s. The SH (red in Fig. 3) is behaving completely normally and is pushing the mean (black in Fig. 3) upwards.
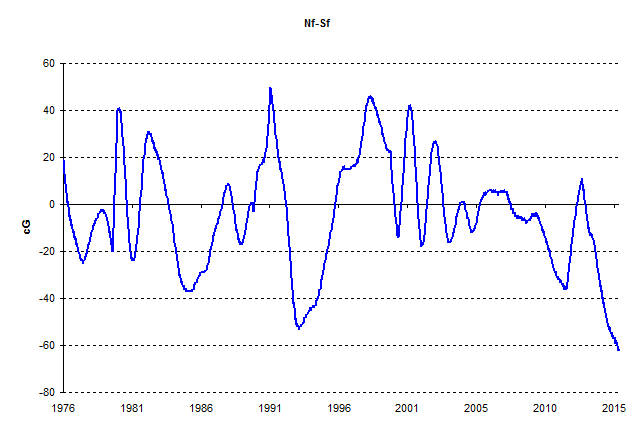
Next we look at the differences between the hemispheres:

Figure 4: The hemispheric differences of the sun’s polar fields. Positive values show stronger NH fields while negative values show stronger SH fields.
We recognize that different fields strengths are not unusual. Except for the polar reversal of SC24, which occurred in 2013, we note that over the entire cycle since 2008 fields in the SH were stronger than the NH and currently we have the largest difference between the fields since 1976.
A number of papers have looked into this phenomenon, e.g. Munoz-Jaramillo et al. (2013) and Ashish Goe et al. ( 2007). They connect asymmetry of the polar fields with a hemispheric decoupling of the solar dynamo. The latter paper also discusses the topic that a strong solar dynamo asymmetry was one of the reasons behind the Maunder Minimum (a phase of very low solar activity from 1645 to 1715).
It is at least worth looking into the varying differences of the sun’s polar field strengths. We will see what happens over the next 1 to 2 years as by then the fields will have reached the maximum and thus possibly make a forecast for the following solar cycle 25 quite robust.


It’s a stroke of luck to live during a time where we can witness the onset of a Grand Minimum ourselves. As to the coming cold, I am optimistic we have enough technology to survive it even here in the North.
I did not sell my overcoat.
A simple conservation of energy equation, employing the time-integral of sunspot number anomalies and an approximation of the net effect of all ocean cycles achieves a 97% match with measured average global temperatures since before 1900. Including the effects of CO2 improves the match by 0.1%. http://globalclimatedrivers.blogspot.com
Thanks Dan! Exactly what I thought about; a giant sawtooth function of the global climate over centuries!
[…] https://notrickszone.com/2016/03/16/record-low-solar-dynamo-asymmetry-may-be-indicate-weak-upcoming-s… […]
There are many things in our world that effect the climate. All of these factors are involved at once and maybe we are lucky the sun is at its coolest when other things seem to be overcoming the effect of the sun causing record thawing of ice packs and the worlds oceans rising.
No further comments