Snowfan at wobleibtdieerderwaermung.de here recently reported on solar activity and ocean cycles. Today we will focus on the ocean cycle part of his post.
====================================
The oceans (SST) have cooled surprisingly over January to February 2016.
While during other El Niño events like in 2015/16 led to a time-delayed warming of the Earth’s atmosphere – as was the case this year, the global oceans have decoupled themselves from this time-delayed warming and are showing a surprising significant cooling from January to February 2016 when compared to the powerful 1997/98 El Nino event:

The plot from BOB TISDALE shows the course of the SSTA during the powerful 1997/98 El Niño and from 2015/16. The monthly mean SSTA from multiple data suppliers show a surprising drop in global SST in February 2016. Source: Global Sea Surface Temperature Responses to the 1997/98 and 2015/16 El Niño Events.
The North Pacific, which since 2014 had been parked off the west coast and known as the warm BLOB, saw the greatest share of the global sea surface cooling. By December 2015 it practically disappeared:
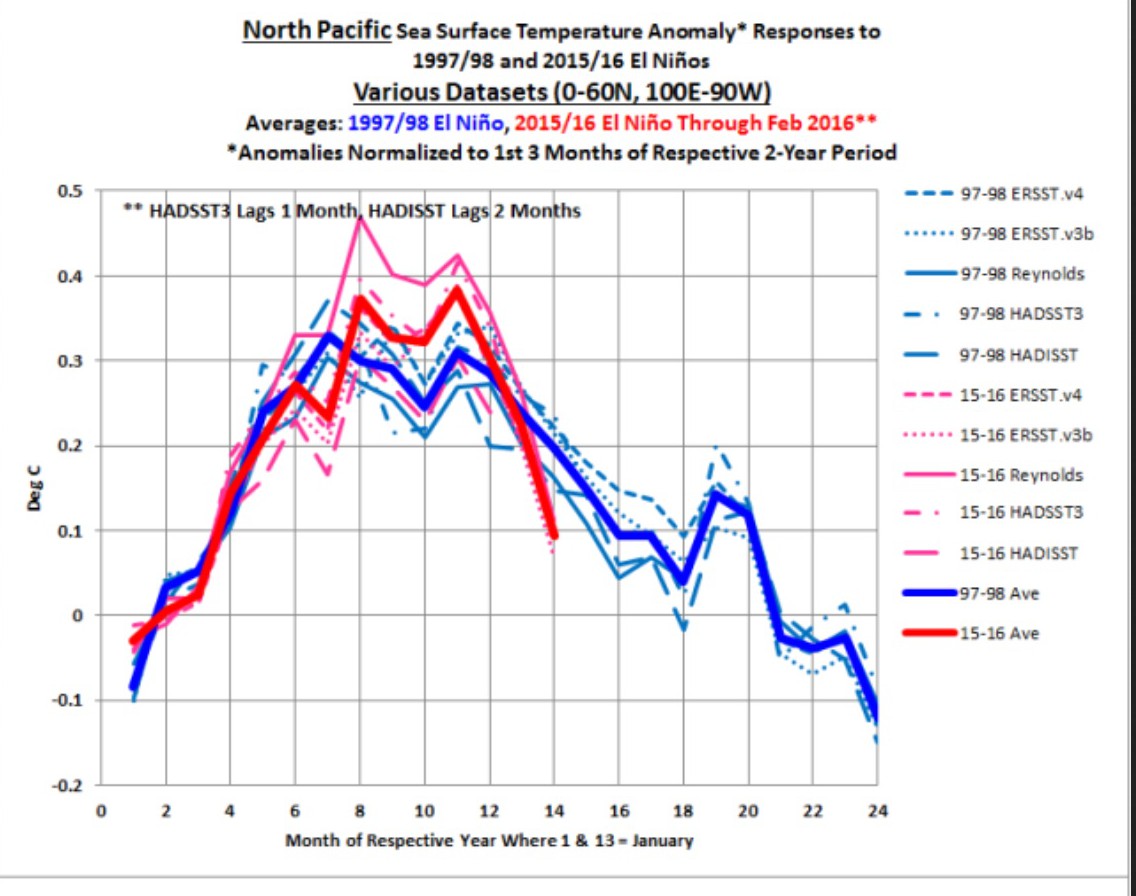
The plot from BOB TISDALE shows the course of the SSTA during the powerful 1997/98 El Niño and 2105/16. The monthly mean SSTA of multiple data suppliers show a surprising drop in global SST in February 2016. Source: Global Sea Surface Temperature Responses to the 1997/98 and 2015/16 El Niño Events.
Global temperatures fell in March 2016
In March 2016 the global temperatures have shown a clear retreat after their three to four-month highpoint February 2016 – time delayed after the El Niño peak at the end of October/start of November 2015. This has also been the case in the tropics as well:
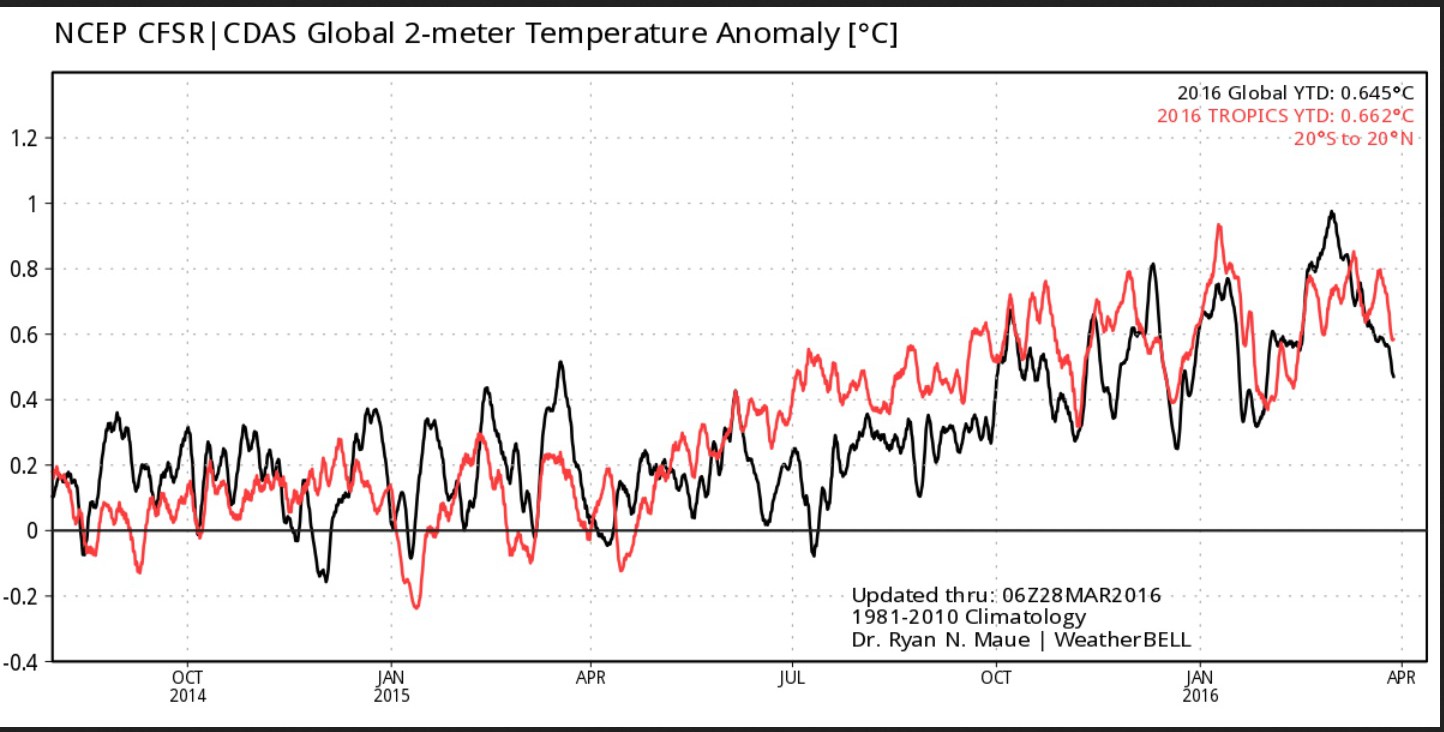
The plot shows the measured/calculated temperature deviation global (black curve) and in the tropics (red curve). After a peak in February 2016, global temperatures have fallen sharply as of 28 March 2016. Source: weatherbell.com/temperature.php.
Therefore it is fully possible that the global temperatures have already begun to gradually ease back from the previous month’s record high in February 2016, although this was not expected to happen until April: Record warmth in the troposphere in February 2016 – Tropical sea surface starts to cool off.
“…With increasing cooling of the tropical sea surface, this means also a gradual cooling of global temperatures will set in by April 2016, which I described here: ENSO update February 2016: El Niño leaving– La Niña arriving…”
Also see the unfalsified facts n: “Global Warming” Reality Check February 2016: The global warming ”pause” since 1997 continues– RSS 0.94.”
The water masses of the equatorial Pacific over the past months have released a considerable amount of energy into the atmosphere. From the end of October 2015 until the end of March 2016, the upper 300 meters have cooled strongly: by 2.6°K.
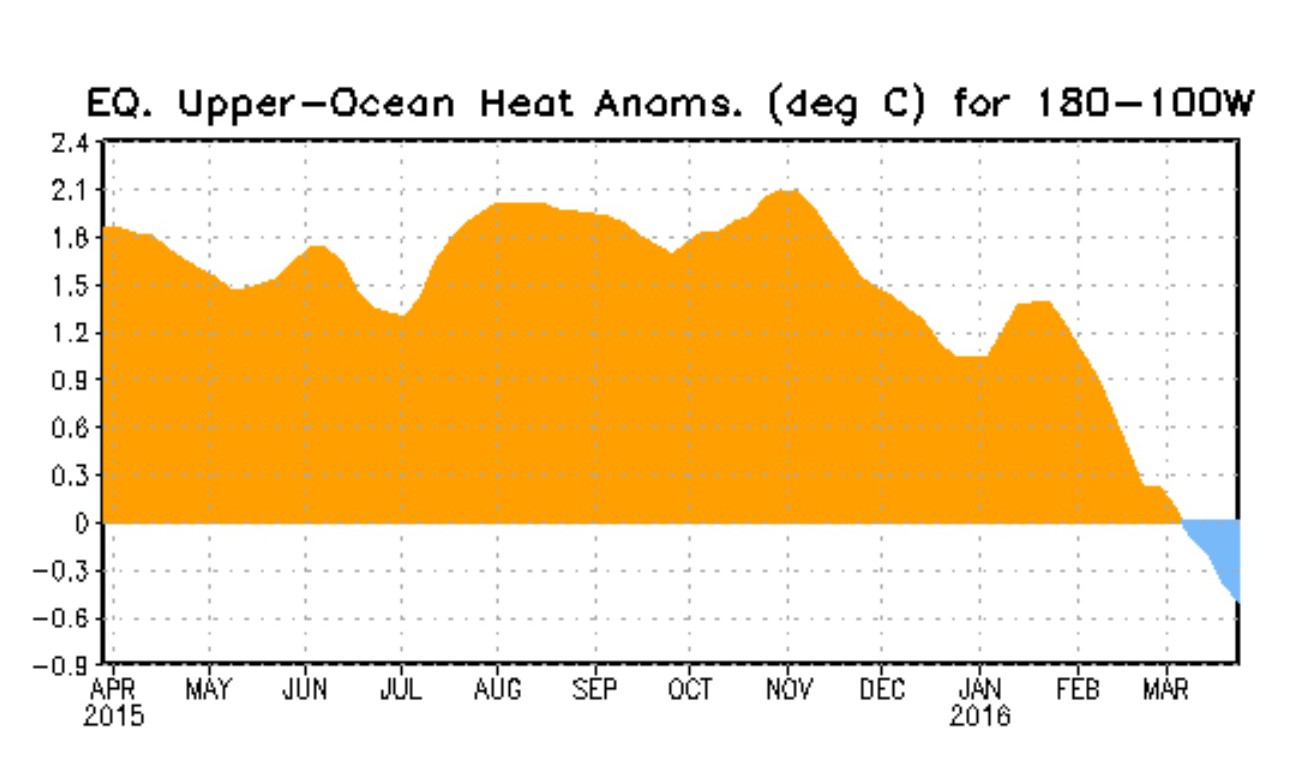
The plot above shows the course of the temperature anomalies down to 300 meters at the equatorial Pacific. The powerful positive deviations (orange) of the Downwelling-Phase reached their peak at 2.1°K deviation at the end of October/early November 2015 and have fallen 2.6°K to -0.5° K (blue): El Niño leaves– La Niña arrives! Source: www.cpc.ncep.noaa.gov/enso.shtml
We will have to wait and see to find out whether the global temperature anomalies will go negative already by the end of 2016, similar to what happened with the El Niño event 1997/98 – though the negative global temperature anomaly did not arrive until March 1999 – which we saw in the UAH satellite data: http://vortex.nsstc.uah.edu/data.txt.
Schneefan2015


This is what happens when a quiet sun increases global cloudiness so as to reduce the amount of solar energy entering the oceans.
The reduced rate of recharge will gradually reduce the intensity of El Ninos relative to La Ninas and lesd to a cooling world.
Looks to me like the Juan de Fuca plate volcanism has stopped.
Baloney. Solar irradiance has only declined by about 0.7 W/m2 (daily LASP data) compared to its recent peak.
With a low climate sensitivity to solar forcing, about 0.1 C/(W/m2) or less (differentiate the Stefan-Boltzman relation), this small amount is nothing newsworthy.
David,
You have been told repeatedly that it is not solar irradiance that matters but rather the effect on global cloudiness caused by wavelength and spectrum changes which affect atmospheric chemistry.
Please do not seek to confuse new readers.
Mr. Appell, like most warmists, only seeks to confuse. Clear thinking leads to the obvious conclusion that CO2 caused warming is a chimera.
Bad skeptic. How dare you keep setting fire to Appell’s straw man. 😉
It isn’t solar irradiance that matters.
http://joannenova.com.au/2015/01/is-the-sun-driving-ozone-and-changing-the-climate/
BOM have a 4-month sequence of 150m depth-averaged temperature anomalies:-
http://www.bom.gov.au/cgi-bin/oceanography/wrap_ocean_analysis.pl?id=IDYOC006&year=2016&month=04
A lot of ocean has come over all neutral in the last four months. Explains the increase in sea surface temps but where to next?
and at the equator they show a diminishing warm surface veneer:-
http://www.bom.gov.au/cgi-bin/oceanography/wrap_ocean_analysis.pl?id=IDYOC007&year=2016&month=04
along with an interesting feature in the bottom right corner (technical description!) Worth watching to see how it evolves, dissipates or gets stronger.
OT.. another BIG solar company down the gurgler?
http://www.marketoracle.co.uk/Article54695.html
And Abengoa’s Brazil project might be saved b y the Chinese. or not.. Chinese should pick it up for a pittance.
http://www.macauhub.com.mo/en/2016/04/06/china-state-grid-evaluates-the-assets-of-spanish-group-abengoa-in-brazil/
OT but in the Netherlands more than 60 percent voted against the EU treaty with the Ukraine. Newspapers call it a heavy blow for the EU, who pumped without our permission billions in this nest of corruption. In June we get the Brexit referendum. Interesting times ahead.
….well, that will certainly be corrected and homogenized in keeping with present models.
Won’t take long if I know NOAA.
Our local Tampa Florida Fox news meteorologist was at the annual hurricane conference in Orlando recently and the big topic was the dramatic cooling of the atlantic ocean.
Did they talk about the large increase in Indian Ocean heat content (larger in absolute value than the decrease in Atlantic OHC)?
data:
http://www.nodc.noaa.gov/OC5/3M_HEAT_CONTENT/basin_data.html
David, what part of global did you miss?
– See more at: https://notrickszone.com/2016/04/06/global-sea-surface-temperatures-have-fallen-sharply-cooled-surprisingly-negative-global-temperature-anomaly-by-end-of-2016/#sthash.vdno3ipL.8lDrrRKi.dpuf
here…
https://wobleibtdieglobaleerwaermung.files.wordpress.com/2016/03/bobtisdalenordpazifiksstkc3a4lter032016-e1458073754173.jpg
“David, what part of global did you miss?”
No part. These reports here are always focused on the single cold spot on the globe.
What does the temperature of the Indian ocean have to do with hurricane season in the Atlantic?
In general I’m skeptical of global warming, but when the record high month was this year, that fits with a hypothesis of warming. Bear in mind that a “pause” at record highs does not falsify global warming. If temps ever go down, we can consider it falsified, but they haven’t done that. On the contrary, they’ve breached new highs.
Truly unprecedented warming…
http://www.c3headlines.com/2012/08/unprecedented-global-warming-new-study-establishes-summer-temps-hotter-during-medieval-warming-perio.html
…not.
See also the top article and others here
http://www.c3headlines.com/hockey-stick-science-empirical-bogosity/
Yes. The El Nino has been about 0.4 C (avg global surface temp) above 1998’s, which was about 0.4 C above 1983’s.
That’s your global warming.
Over simplistic nonsense
So, absolutely nothing to do with CO2
Thanks for the clarification, rotten Appell
https://stream.org/climate-surprise-co2-good-earth/
” WHEN NEW THEORIES ARE AVAILABLE, OLD THEORY MUST DUMP. CLIMATE CHANGE THIRD GROUP. AIR CONDITIONING OF MOTHER EARTH. !!!!!
NOT CO2 & GREEN HOUSE GASES CHANGING CLIMATE. CARBON ECONOMY IS FAILING EVERYWHERE. “Why I am different from 31, 847 CLIMATE AND GLOBAL WARMING SCIENTISTS? ” http://joychenputhukulam.com/newsMore.php?newsId=37630
Climate Research Fools went to Eastern Antarctic while temperature was -9° C.
Raveendran Narayanan USA
Capital letters are diffucult to read. Stop it, it is annoying.
Here is my latest forecast from
http://climatesense-norpag.blogspot.com/2016/03/the-imminent-collapse-of-cagw-delusion.html
“3.3 Current Trends
The cooling trend from the millennial peak at 2003 is illustrated in blue in Fig 5. From 2015 on,the decadal cooling trend is obscured by the current El Nino. The El Nino peaked in March 2016. Thereafter during 2017 – 2019 we might reasonably expect a cooling at least as great as that seen during the 1998 El Nino decline in Fig 5 – about 0.9 C
It is worth noting that the increase in the neutron count in 2007 seen in Fig 8 indicated a possible solar regime change which might produce an unexpectedly sharp decline in RSS temperatures 12 years later – 2019 +/- to levels significantly below the blue trend line in Fig 5.”
In addition I would note the unusually strong NGRIP flux count at about 1815 in Fig 5 at
https://arxiv.org/ftp/arxiv/papers/1004/1004.2675.pdf
This would suggest a possible Dalton/ De Vries minimum at about 2020 -2025 ( 210 year periodicity )
“The El Nino peaked in March 2016. Thereafter during 2017 – 2019 we might reasonably expect a cooling at least as great as that seen during the 1998 El Nino decline in Fig 5 – about 0.9 C – See more at: https://notrickszone.com/2016/04/06/global-sea-surface-temperatures-have-fallen-sharply-cooled-surprisingly-negative-global-temperature-anomaly-by-end-of-2016/comment-page-1/#comment-1097211”
It is not “cooling” if temperatures revert back after a el nino. You do not understand the difference between cliamte and weather at all?
Your theory about cooling has been totally false so far. Instead, we got another peak, when you thought there should be cooling. After the el nino, we will see a step back to “normal”, not cooling.
Please stop starting trend lines at the highest place that is possible and stop predictions that start with being false in the beginning!
sod says…
===============================
:It is not “cooling” if temperatures revert back after a el nino. You do not understand the difference between cliamte and weather at all?
===============================
So we did not have any warming either; and the pause continues.
Sod, this is particularly likely as the Pacific blob is cooling as well, in conjunction with a down turning AMO. Indeed, we may well have a downturn.
“So we did not have any warming either; and the pause continues.”
No. The pause is dead, even in the UAH data.
http://www.drroyspencer.com/2016/04/uah-v6-global-temperature-update-for-march-2016-0-73-deg-c/
The long term trend is clear, the pause was a statistical artefact caused by a cherrypick of start date.
These short term trends, starting on a peak do not survive a statistical test.
“Sod, this is particularly likely as the Pacific blob is cooling as well, in conjunction with a down turning AMO. Indeed, we may well have a downturn.”
No, we will not have a “downturn” beyond the typical drop back after a el nino peak.
The CO” that we have added to the atmosphere will not allow any real cooling, unless we see serious volcanic activity or something on similar scale.
The El Nino is dying, Next the La Nina.
As you say, “No, we will not have a “downturn” beyond the typical drop back after a El Nino peak.”
……then because the pause is NOT a cherry-picked starting point, but a purely mathematical back-calculation, the PLATEAU will re-establish, to even longer than before.
And each little bit lower than where the El Nino started will add to the PLATEAU at both end.
(and seriously, the fact that you STILL haven’t figured out that the plateau does not use a cherry picked starting point….. really shows your woeful ignorance)
@AndyG55
Isn’t it odd how sod understands the data better than Dr. Spencer, who writes…
“I suspect that February and March represent peak El Nino warmth in the lower troposphere, and the rest of the year will see cooling.” (see his link)
“…are showing a surprising significant cooling from January to February 2016 when compared to the powerful 1997/98 El Nino event”
Nonsense. February 2016 had an average global sea surface temperature of +0.13 C compared to 1998.
You incompetent fool.
Read the graph, FFS !!
“Negative Global Temperature Anomaly By End Of 2016?”
Not very smart — the last negative anomaly for HadSST3 (relative to a 1961-1990 baseline) was Dec 1992.
Pierre, I’ll bet you $100 that HadSST3 does not reach a negative anomaly in any month in 2016.
Deal?
HadSST3 source (monthly):
http://www.metoffice.gov.uk/hadobs/hadsst3/data/HadSST.3.1.1.0/diagnostics/HadSST.3.1.1.0_monthly_globe_ts.txt
Not interesting in betting, Pierre?
Based on your cherry-picked garbage science, Appell.
Appell recently rebuked me for calling sod a “useful idiot.”
Of course his moral pronouncements against others don’t apply to himself. Unfortunately (for him) he barked at the wrong pit bull, and hilarity ensued.
http://www.steynonline.com/7123/the-ugly-misogyny-of-big-climate
When one tries to match wits with someone like Mark Steyn, it doesn’t help if one has no wits.
And so you should have been rebuked. What on Earth made you think he was useful?
With all the climate mafia on the side of warming, it’s probably not a safe bet.
http://www.breitbart.com/big-government/2015/11/24/german-professor-nasa-fiddled-climate-data-unbelievable-scale/
Even if the temps do drop, their ENRON accountants will make it warm.
Nice cherry pick, as to be expected from an alarmist.
Its going to take one heck of a drop in real temperatures to make GISS, HadCrut, etc HadSST go negative.
The Government and the data chiroprocters would never allow it.
If it even starts to look like dropping near zero, you watch the continual downwards “adjustments” to the reference period start to speed up.
hi. Bear in mind that a “pause” at record highs does not falsify global warming. If temps ever go down, we can consider it falsified, but they haven’t done that. On the contrary, they’ve breached new highs
Yeah, it’s not like they’ve ever been that high before
http://www.c3headlines.com/2012/08/unprecedented-global-warming-new-study-establishes-summer-temps-hotter-during-medieval-warming-perio.html
Must be all our fault then.
“Yeah, it’s not like they’ve ever been that high before”
The data of your source ends in 1990. We have seen an increase of about 0.6°C since then.
http://www.woodfortrees.org/plot/gistemp/from:1980/mean:12
so at best you might call it a “pause”, since your “MWP”.
Yes, Giss has worked hard on that 0.6C
I note that you HAVE to use BOTH El Ninos PLUS the GISS adjustments to actually achieve that.
Now please say that El Ninos are forced by CO2, just to prove your ignorance.
“I note that you HAVE to use BOTH El Ninos PLUS the GISS adjustments to actually achieve that.”
I am using global data, while the article is only about a part of Canada.
The article is a prime example, showing how these “MWP” reports obfuscate the reality.
You cherry pick a region and a time and compare it to a time that you call “now” but that is a quater of a century in the past.
The MWP was a world wide even and was warmer than now. That is the REALITY !!
And the Holocene optimum was even warmer.
No SUVs
No cherry picking,
No fudging data,
No farcical tree rings.
You have again relied on the El Ninos to show warming, because you know it is the ONLY warming in the real data from satellites.
first line… even = event
Tell us, sob, are you going to stick around once the La Nina drops the temperature back to below 1996 levels? (maybe by the end of the year)
Or are you going to run and hide from the justified ridicule.?
“You cherry pick a region and a time and compare it to a time that you call “now” but that is a quater of a century in the past.”
Well, when climate is defined as the average of weather over 30 years, then the youngest climate we know is that of 2001.
Think about it for a long time, sod, and use your acclaimed mathematical education.
“Well, when climate is defined as the average of weather over 30 years, then the youngest climate we know is that of 2001.”
Suddenly you do like averages?
You could do two things: stop of speaking today, when you mean 25 years ago. Or use average that gives additional weight to “today”.
Oh, and the data is July temperature. Do i also get to cherry pick a month?
http://www.c3headlines.com/2012/08/unprecedented-global-warming-new-study-establishes-summer-temps-hotter-during-medieval-warming-perio.html
sod 9. April 2016 at 6:17 PM | Permalink
““Well, when climate is defined as the average of weather over 30 years, then the youngest climate we know is that of 2001.”
Suddenly you do like averages?”
One of your many problems is you don’t understand conditional sentences. But no worries I’m here to help. Notice I did NOT say that reducing climate to a moving average over weather – and with a useless metric – makes any sense at all. I didn’t even address that question.
I wanted to point you to the fact that by YOUR definition of climate YOU CAN’T EVEN TALK about todays climate. Your constant “HOTTEST EVER MONTH” is UNSCIENTIFIC by YOUR OWN DEFINITION.
And now I could go on a diatribe of energy shifts between low and hi frequencies in a nonlinear chaotic system and why this is the reason that a distinction between weather and climate using such a frequency band separation is entirely pointless. But I did that before so I won’t.
And you neither understand nor read it anyway because what you want is more subsidized Tesla luxury cars and more wind turbines and you only ever PRETEND to use reasoning.
@sod the true believer
OPEN YOUR EYES! Look at the temperature scale, sod. 0.6 Deg of warming since 1990 isn’t enough to surpass either of the last two major warming events. And even if it were, so what?! …especially since most of the warming is man made.
https://stevengoddard.files.wordpress.com/2012/07/screenhunter_77-jul-12-15-44.jpg?w=640&h=353
PS
Read the whole article
https://stevengoddard.wordpress.com/data-tampering-at-ushcngiss
0.6 degrees is EXACTLY the amount of the adjustments they made.
I’ve posted this before, and will again
https://www.youtube.com/watch?v=Gmc5w2I-FCA
It’s all about the data, the untampered data (not the UN tampered data).
“0.6 degrees is EXACTLY the amount of the adjustments they made.”
The article is about the USA.
fixing problems in the data (like time of observation bias) is not “tampering”.
Unfortunately none of this will register on the closed, blinkered mindset of some people, ever
sod 10. April 2016 at 7:59 AM | Permalink
“fixing problems in the data (like time of observation bias) is not “tampering”.”
When it’s done in the wrong direction it is.
Sorry, sod, but the only “problem” they need to “fix” is reality’s refusal to comply with their fantasy.
That video I linked by Richard Keen shows not only the tampering, but other problems with temperatures, like being taken in areas surrounded by asphalt, for one e.g., and for another, he points out that while they have no problem RAISING temperatures, they never decrease them to account for UHI.
See also these:
http://www.drroyspencer.com/2015/03/even-though-warming-has-stopped-it-keeps-getting-worse/
http://www.c3headlines.com/are-modern-temperatures-unequivocal/
http://www.judicialwatch.org/press-room/press-releases/judicial-watch-sues-for-documents-withheld-from-congress-in-new-climate-data-scandal/
http://osnetdaily.com/2015/11/nasa-exposed-in-massive-new-climate-data-fraud/
Data TAMPERING is real, AGW is not.
“Oh, and the data is July temperature. Do i also get to cherry pick a month?” – sod
Did you happen to notice that the method they use involves fossil chironomids as the the proxy for temperature? And are you aware that when using them as proxy, it is the July temperature to which they correlate? See here for another paper on the topic.
http://www.st-andrews.ac.uk/~rjsw/all%20pdfs/Larocque2008.pdf
It’s completely out of our hands. The chironomids do the “cherry picking,” sod, not those who do the research.
[…] “The oceans (SST) have cooled surprisingly over January to February 2016. […]