Schneefan (snow fan) at German climate science critical site wobleibtdieerderwaemung.de here presents the latest analysis of the current ENSO, which shows a powerful La Niña in the works.
Three-Year Super La Niña with Global Cooling? – April 2016 ENSO Update
Based on an array of data, Schneefan tells readers to expect a La Niña already early in the second half of this year and that there are signs it may turn into a Super La Nina – one that could persist until part way into 2018.
The consequence, he writes: “With a delay of 4 to 5 months, global temperatures will retreat over many years and fall below the long-term climate mean.”
From earlier ENSO models, the La Niña originally was not very evident, but the NOAA has since drastically corrected its projections and the CFSv2 is now anticipating “unusual cold sea surface temperatures in the El Niño region of 3.4,” the climate science critical site writes.
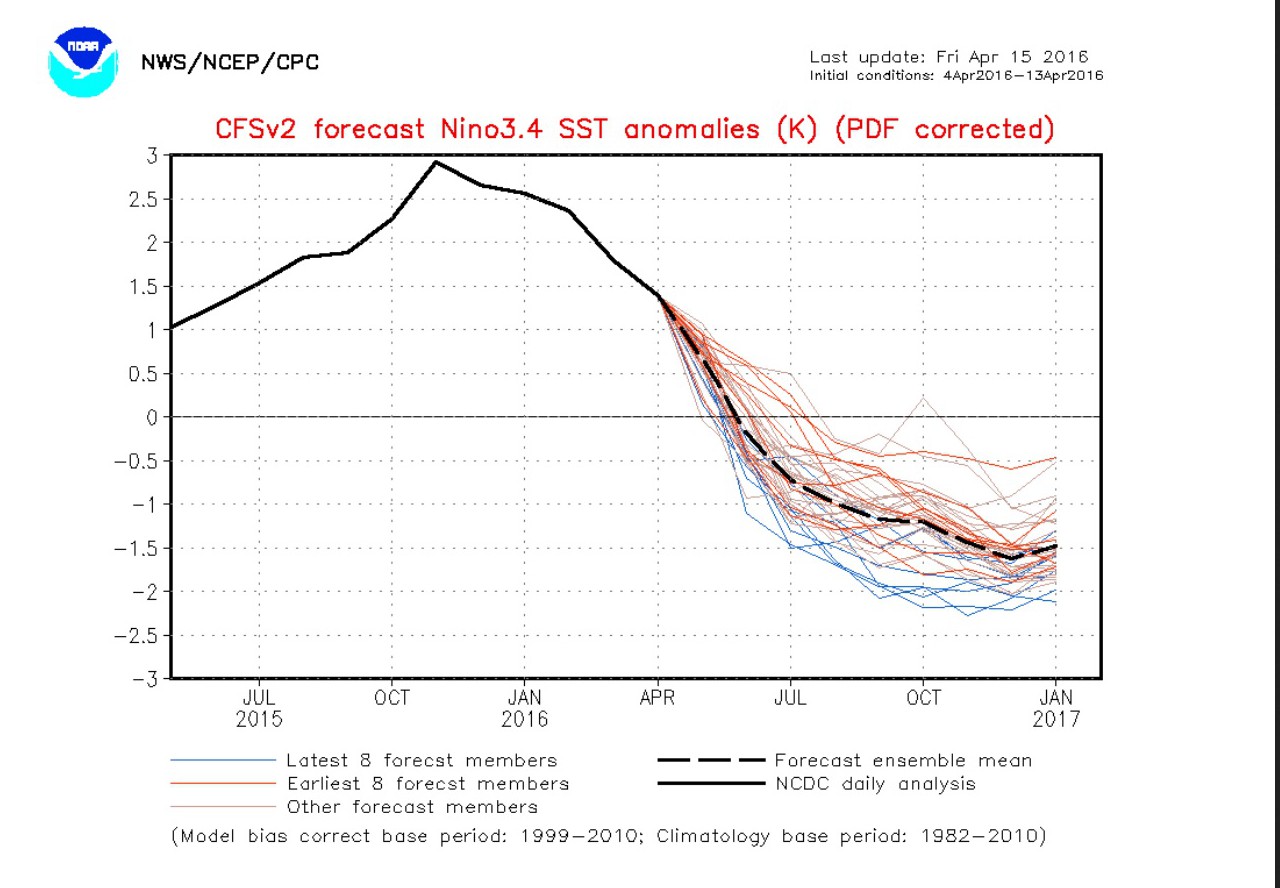
Plot of projected equatorial Pacific sea surface temperature anomalies, region 3.4, from April 15, 2016. La Niña values of -0.5 K are expected already in June. Many models are projecting the -2.0°K level to be surpassed. Source: www.ncep.noaa.gov/products/html.
Schneefan reports that the latest models are now projecting “a powerfully cold La Niña is on the way” – one that could smash the earlier record set back by the La Niña of the 1970s.
The current CFSv2 projections are now pretty much in line with most of the other ENSO models, and foresees already La Niña conditions with an average of -0.9°K SSTA in August:

Source: www.bom.gov.au/climate/model-summary/Pacific-Ocean
Schneefan also provides the numerical table from the NOAA showing past historical events since 1950:
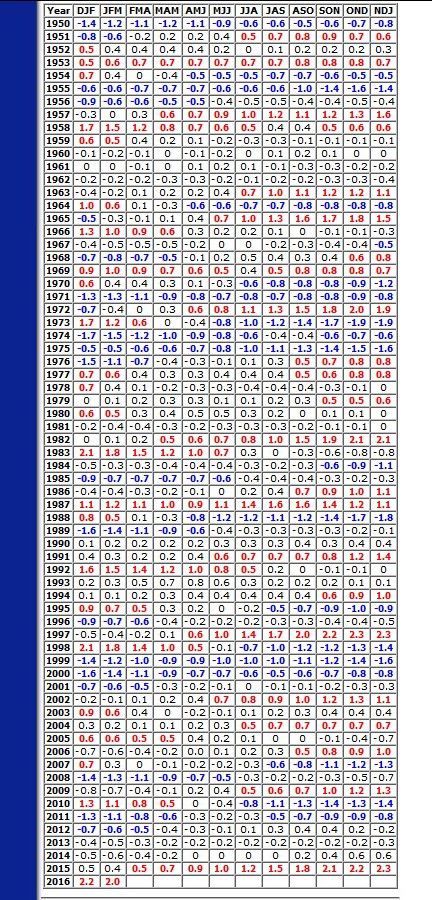
Source: Historical El Nino/ La Nina episodes (1950-present)
The figures in the table above, Schneefan writes, are actually the “falsified” ones. The coldest La Niñas occurred in 1998-2001 (-1.6°K) and in 1973 (-1.9° K). The latest projections for the coming La Niña show these may even be surpassed.
Also the energy content of the equatorial water mass down to 300 meters below the surface dipped into negative territory by mid April, reaching an anomaly of -0.7°K, thus already in the La Niña range.
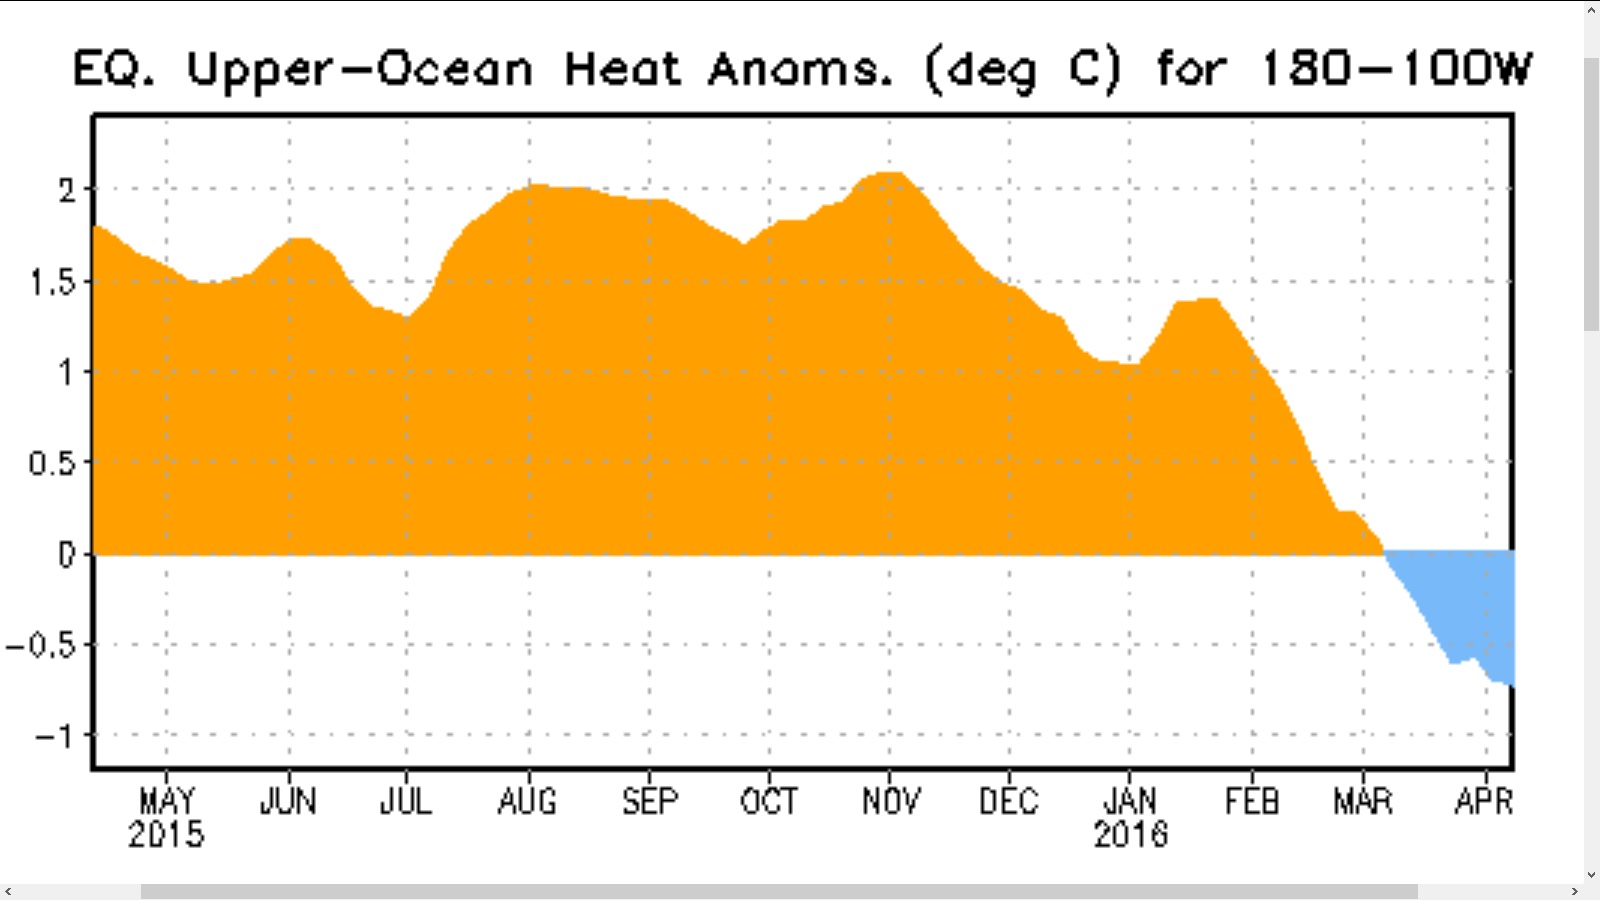
The chart above shows: El Niño going – La Niña coming! Source: www.cpc.ncep.noaa.gov/shtml
The next chart is a poignant display of just how powerful the oncoming La Niña is threatening to be. The chart shows the cross section of the Pacific equatorial water down to 400 meters since January 2016:

Strengthening of the Humboldt currents. The warm El Niño water has practically fully disappeared! Source: 4-month sequence of Pacific Ocean equatorial temperature anomaly cross sections.
The complex, coupled ocean/atmosphere index MEI (Multivariate ENSO Index) also is pointing downward (see chart below) and will rapidly fall below zero in the months ahead, just as was the case for the super 1997/98 El Niño, but this time it’ll be earlier, Schneefan tells us:
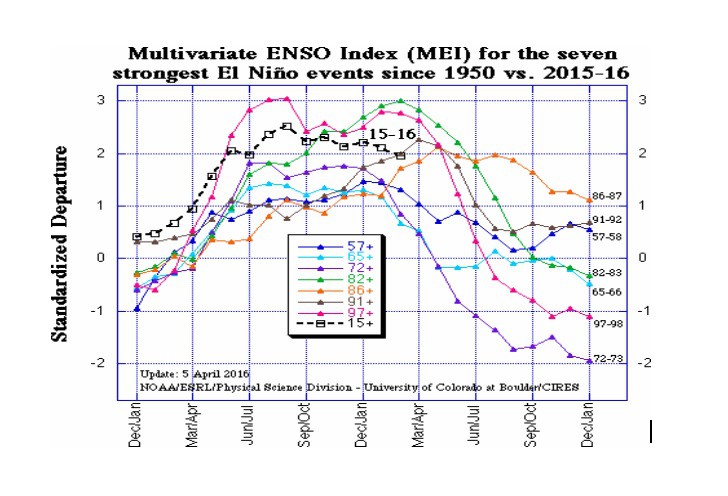
Source: http://www.esrl.noaa.gov/psd/enso/mei/
More bad news of coming cold
Schneefan also writes that the upcoming La Niña will also coincide with a dying solar sunspot cycle, one that was a weak one to start with, and the fact that the earth is now moving further away from the sun in its orbit,. This will only make the cooling worse. He summarizes:
Thus so could the coming 2016/17 winter be as exciting as the 2010/11 winter: The Super La Nina and the Coming Winter.


> and the fact that the earth is now moving further away from the sun in its orbit
Only until July, then it will start moving closer to the sun until perihelion in January.
Yes, but then the northern hemisphere will receive less and less heat as the sun will be lower and lower in the sky at noon with each passing day as winter is approaching.
What gets me smiling is that the AGW crowd have been so busy crowing about how warm the Arctic has been during those Equator to North express storms we had during the winter that they have failed to realise that all of the warmth in those storms has come from “down South” and straight out the Arctic window to space.
It may have warmed the Arctic by a few degrees on average when it was -20 to -30 but it has now gone and left the Earth and the Oceans much colder.
What they were watching was not Global Warming but Global Cooling.
Now the summer period has to try and recover some of that heat with a quieter sun.
What we do not want to see is any extra cloud cover during the summer preventing the Oceans from warming as that could turn this in to something pretty bad.
The BOM graph of outgoing longwave radiation should be interesting to watch.
“Cloudiness near the Date Line”
“During March, equatorial cloudiness near the Date Line has mostly been above average (negative outgoing longwave radiation anomalies). Recent values seen in April have been closer to the long-term average, but are still currently above average. Cloudiness near the Date Line has mostly been above average since March last year….”
http://www.bom.gov.au/climate/enso/#tabs=Cloudiness
A C Osborn,
Theoretically speaking, would aerosols cool, like cloud cover, or warm?
Thank you, very interesting to watch developments.
Change in cloud cover will be one to watch.
These kind of posts leave me really shocked.
March was the hottest month on earth.
on surface stations:
https://weather.com/news/climate/news/record-warmest-march-global-2016
and on the satellite data:
http://www.drroyspencer.com/2016/04/uah-v6-global-temperature-update-for-march-2016-0-73-deg-c/
But somehow, talk here is about a cold that MIGHT happen, or might not.
Just look at the 1998 numbers. The last record in the satellite data also had a strong la nina following pretty fast.
And why are we constantly mixing real data (like enso index) with hocus pocus like sunspot numbers? Because the facts do not show what we want to see?
I see that sod was left really shocked because of a posted cold weather forecast. Pierre needs to bear in mind that sensitive individuals go into a shock at the drop of a hat. I don’t even want to think what would happen to sod if someone out there predicted catastrophic global warming and human extinction happening sometime in the near future.
Sod is so shocked he does not think sun spots exist, that they are a magicians trick.
Sod’s sunspot straw man. I posted back in February, or he could have found it himself if he bothered to search for it, that…
“… a comparison with the Northern Hemisphere land temperature during the last 130 years did show a remarkably good correlation with the smoothed curve of the varying solar cycle length (see Figure 1) indicating that this parameter was possibly a better indicator [better than sunspot number] of a solar activity variations that could affect the Earth’s climate (Friis-Christensen and Lassen, 1991). ” – See more at: https://notrickszone.com/2016/02/10/solar-report-january-2016-current-solar-cycle-quietest-in-almost-200-years-as-triple-whammy-approaches/#sthash.HRIShoeW.dpuf
http://www-ssc.igpp.ucla.edu/IASTP/43/
sod remains selectively oblivious to whatever threatens his grungy green world view. Reminds me of those annoying missionary types who, when you point out flaws in one of their arguments, switch to something else and say, “…but what about ________ …” They are tedious, tiresome and never let up. But I guess that’s to be expected since green is his religion, and he is such a pious devotee.
“I don’t even want to think what would happen to sod if someone out there predicted catastrophic global warming ”
That would be something, that is supported by the facts. We had a massive temperature increase this winter.
So i would not be shocked, by scientific claims being made, supported by data.
What i find shocking here, is the total ignorance towards the things that are really happening and the extreme reliance on stuff that never materializes.
“That would be something, that is supported by the facts. We had a massive temperature increase this winter. ”
Didn’t we alrdy agree that El Nino is weather. BTW we have a record cold April. Duh.
“Didn’t we alrdy agree that El Nino is weather.”
Well, it is the “sceptics” who used the 1998 El Nino for the pause claim over 10 years.
So El Nino is weather, until it is so far in the past, that it turns the trend down?
Nice trick!
“BTW we have a record cold April. Duh.”
In the global satellite data? That would be big news!
“Well, it is the “sceptics” who used the 1998 El Nino for the pause claim over 10 years. – ”
What the *** are you talking about/
Don’t tell me you still don’t comprehend the basic back-calculation?
Before the current El Nino, 1998 El Nino actually stopped the ZERO trend from extending back to 1979.
There was very slight warming from 1979-1997, and a very slight cooling from 2001-2015.
In fact, the ONLY warming in the whole satellite record has been from NON-CO2 forced El Ninos.
There is ABSOLUTELY NO CO2 SIGNATURE in the whole of the satellite record..
End of story !!!
“Don’t tell me you still don’t comprehend the basic back-calculation?”
The “back to the first time we get a negative trend” calculation is a cherry pick.
The correlation always was utterly horrible (because it was a cherry pick).
“Before the current El Nino, 1998 El Nino actually stopped the ZERO trend from extending back to 1979.”
That is completely false. Please show me that trend line!
Th level in 79 was around -0.2°C, now it is about 0.2°C (ignoring the current El Nino.
http://www.woodfortrees.org/plot/uah
Please show me the negative slope trend line, PLEASE!
“There was very slight warming from 1979-1997, and a very slight cooling from 2001-2015.”
This is garbage. you can not divide the system in different trend lines, always starting at a high point, always ending at a low point.
You also can not leave out the El Ninos and keep the La Ninas.
That is just plain out cheating!
So every year we have cooling from august to dezember and then a small temperature jump in the summer. Basically its getting colder all the time.
“In fact, the ONLY warming in the whole satellite record has been from NON-CO2 forced El Ninos.”
No. Temperature is supposed to fall back to the base level after El Ninos. You simply do not understand the concept at all.
Ok, first you confirm that you don’t understand back calculation.
Then you don’t comprehend that the step change at the 1998 El Nino was the end of the back calculation.
Actually, from a mathematical point of view you MUST separate parts that are separated by a step change to gain any meaning or understanding as to what is happening. But mathematics is very far from your strong suit, right, kindy-boy
“You also can not leave out the El Ninos and keep the La Ninas”
Then why do you and every other alarmist do that?….. Yes it is cheating.
“”Temperature is supposed to fall back to the base level after El Ninos””
Yes, and it will.. except this time a bit further.
Stick around, sob, the egg on your face will be hilarious to see. 🙂
There was absolutely nothing catastrophic about the El Nino spike in the NH winter.
Almost certainly a massive blessing for many.
The Southern Ex tropics and below had absolutely no El Nino spike.. ie it was NOT GLOBAL.
ie JUST a TRANSIENT WEATHER EVENT..
Do
You
Under-
Stand???
“Just look at the 1998 numbers. The last record in the satellite data also had a strong la nina following pretty fast.”
We know, sod. You know as well? That’s a surprise. Why then were you so excited about a spike in RSS or UAH? It’s followed by a huge drop. you only found this out NOW?
“We know, sod. You know as well? That’s a surprise. Why then were you so excited about a spike in RSS or UAH? It’s followed by a huge drop. you only found this out NOW?”
This el nino killed the pause meme, which was simply false claims being made, based on a statistical artefact.
Do you not understand, that a stro9ng la nina would seriously damage the impact of satellite data?
if the trend in that data source mostly relies on how strong the el nino spike is, and how weak the following la nina (every 20 years), then we will not have useful data for another century.
What you people here are praying for is another statistical artefact. you hope that the la nina will keep 2016 low, basically using how el nino and la nina months are spread over the jan to dez year. good luck in the lottery!
“What you people here are praying for is another statistical artefact. you hope that the la nina will keep 2016 low …”
You are projecting again. It’s “you people” and your cheerleaders in the media who are praying for any sign of warmer weather you can blame on Western civilization and use it as a pretext for the implementation of your slate of “progressive” projects.
The skeptics I know are not praying for “statistical artefacts” and definitely not for actual colder weather. Are you insane? A slide back into another Little Ice Age or worse would be bad news and you are old enough to know it.
Sod, “Hottest month on earth” ? As opposed to where? Sorry. I’m sure you meant to say omething else.
“Powerfully Cold La Niña”
It seems an El Niño exposes the atmosphere to warm water and thereby energy enters the system. La Niña exposes the atmosphere to cold water and there is a cessation of energy from that source. Pressure, winds, clouds, and precipitation, that is weather, respond.
To me an analogy is driving an auto up a hill. Foot on gas pedal, up you go. Reduce pressure of foot on pedal and the movement slows. This leads to the thought that “powerful” is not a word that fits my notion of a La Niña. There will be serious changes in weather for some places when a very cold La Niña replaces a very warm El Niño. Some of the weather events will be locally powerful.
[A dull and pedagogical issue, I know.]
Maybe it is a little pedantic but you have a point, John.
I think the personification of weather events invites such rhetoric. Few people object to a newspaper writing “El Niño weakens, here comes powerful La Niña”.
If they wrote that “a powerful cessation of energy input into the atmosphere is starting”, more people would notice the thermodynamics nonsense.
Right now I am looking at our cold wood stove trying to think how powerfully it stopped heating the house since the fire went out but I have some difficulties with the concept. I think I’ll name it Sue. Every time I’ll walk by I will say “Stop the bullying, Sue! I won’t stand for it.”
The good ol’ BoM is still has the mildest projection which shows how entrenched the AGW mentality remains, downunder.
i think australia will see the biggest floods and storms they have seen in centuries with western australia waters very warm it will intensify the effects of la nina
Sod says,
==========================
“This el nino killed the pause meme, which was simply false claims being made, based on a statistical artefact.”
==========================
Sod, earlier you said Sun spots are “hocus pokus”, now you assert that an 11 year to 18 year pause in every global data set was a “statistical artifact”. Sod, it was and IS an observation of global climate, which, if the La Nina that follows is strong, (likely) will extend the pause beyond 20 years.
Sod, you were asked;
===============================
““I don’t even want to think what would happen to sod if someone out there predicted catastrophic global warming ”
===============================
and responded,
===============================
“That would be something, that is supported by the facts. We had a massive temperature increase this winter.”
===============================
Sod, that “massive warming” was not CAGW, but simply a powerful El Nino, now vacating, and sorry Sod, but no “global catastrophe” ensued, nor will the coming “massive cooling” of the arriving La Nina be a global catastrophe.
In fact with the AMO turning and the “blob” dissipating, your CAGW will finally be well and truly dead. The “C” in CAGW is already MIA. The G.W. is, according to the observations of the troposphere, about one third of what the models predicted. CAGW is a failed hypothesis. That is not a “statistical artifact”.
” now you assert that an 11 year to 18 year pause in every global data set was a “statistical artifact”. Sod, it was and IS an observation of global climate, which, if the La Nina that follows is strong, (likely) will extend the pause beyond 20 years.
No. This is simply false.
There is a real pause (a slow down in temperature increase), which real scientists are investigating and thinking about.
But what you are talking about (the longest stretch showing a negative slope) is a abuse of data and a serious statistical artefact and i can proof that.
All you need to do is apply any statistical tool that you have to that trend line. Be it a correlation, r² or error ranges.
The all of them will tell you, that the long negative slope trend is an artefact.
You can also do a simple test by shifting the start date a little (a real trend would be robust to such changes). The pause is not and falls apart immediately.
A La Nina is very unlikely to restore the pause. Even if it did (for a short time), this would not be a good sign for the pause, because a completely vanishing and reappering trend would be a problem rather than a good sign.
“Sod, that “massive warming” was not CAGW, but simply a powerful El Nino”
That is also false. Th El Nino is not happening instead of global warming, but in addition. That is, why this el nino is warmer than the one from 1998. You have not understood the concept at all.
“Th El Nino is not happening instead of global warming, but in addition. That is, why this el nino is warmer than the one from 1998.”
WRONG: There is no data to support that assumption. It’s an assumption, and nothing more. The extra warmth may be due only to more heat from another sub-sea-surface source. No one knows how the heat is distributed in the ocean depths.
“The El Nino is not happening instead of global warming, but in addition.”
Utter rubbish, as usual.
The El Nino events have been the ONLY warming events in the whole satellite data.
“The El Nino events have been the ONLY warming events in the whole satellite data.”
Again: you can not ignore el nino and leave la nina in.
Either you compensate for both effects or you leave both in the data.
In both cases, you will see a robust warming trend.
The ONLY warming in the whole satellite record was the approx 0.26C warming step of the 1998 El Nino at the end of a series of very solid solar cycles.
There is no warming trend otherwise.
It was essentially flat before the 1998 El Nino, and essentially flat after the El Nino. End of story.
Here is UAH before the EL Nino.. NO WARMING
http://s19.postimg.org/f3dhdpmlv/UAH_before_El_nino.png
Here is UAH after the 1998 El Nino and before the 2015 EL Nino. NO WARMING
http://s19.postimg.org/nmwvbguyb/UAH_after_El_nino.png
The ONLY way you can show any warming in the satellite data is by including the step from the 1989 El Nino/La Nina
Sod bloviates,
“But what you are talking about (the longest stretch showing a negative slope) is a abuse of data…
================================
Nonsense Sod, and that is not what the pause is at all. (How can you be so ignorant, and also so arrogant to create such a straw-man)
Sod continues,
=============================
“You can also do a simple test by shifting the start date a little (a real trend would be robust to such changes). The pause is not and falls apart immediately.”
====================================
Wrong again Sod. Shift the date forward and it turns to a cooling trend. Go to other points and a small warming trend. Basically the ability to get numerous different variables in the 18 years of the satellite record demonstrate that it was a flat period. If there was a strong trend one way or another, then this would not happen.. How you are blind to this is really quite astounding.
Sod continues to flail…
====================================
“Th El Nino is not happening instead of global warming, but in addition. That is, why this el nino is warmer than the one from 1998. You have not understood the concept at all.
==========================
Sod, The El Nino was not warmer then the 98 event except in one of the Nino areas. The size of the sub-surface warm pool was much smaller then the 98 event The global SST (and thus global T) was ever so slightly warmer due to two additional reasons. The North Pacific Blob, and the AMO has only began to turn down from its peak. The blob, along with the El Nino are going bye-by. The AMO looks like it is continuing it down CYCLE. (A word you need to understand)
No matter how you cut it Sod, the IPCC models all run way to warm, and there is no catastrophe The CO2 benefits, unlike the projected harms, are real.
David,
We have a lot of sods in Boulder and I know from personal experience that most of them reject the claimed benefits of CO2. They are buying organic food so that dangerous chemicals and pollutants like CO2 don’t get into their food.
If this does happen, expect to see headlines in the MSM like “Coldest August in 200 years” or “Coldest year in 500 years”, or similar. Oh no, wait a minute though, there probably won’t be any headlines. Meanwhile NASA and NOAA will be dreaming up new algorithms to disappear it, while explaining how actually they predicted it. Barack Obama will be admitted to rehab.