La Niña is coming: the Earth is cooling!
By Schneefan.
(Translated and condensed by P. Gosselin)
The warming El Niño weather phenomenon has been history since June 2016. The cool La Niña started in mid July 2016.
The daily anomalies in sea surface temperatures (SSTA) in the main Niño region 3.4 are now updated. In mid July it is in the La Niña zone at -0.74°K:

The plot above shows the daily SSTA with respect to the international climate mean of 1981-2010 in the main Niño region 3.4 with data from NOAA/CDAS (Climate Data Assimilation System). The SSTA reached and dipped below the -0.5°K mark in mid July. The latest value was -0.74°K (July 19, 2016). Source: www.tropicaltidbits.com/analysis/ocean/.
The following chart shows the current La Niña extending from the coast of Peru to the international dateline (180°):

The cold La Niña (blue at the equator) is shown developing. Source: www.tropicaltidbits.com/analysis/ocean/.
After a record warm February 2016 with an anomaly of +0.83°K using the unaltered UAH satellite data, the global temperature of the lower troposphere centered at 1500 meters fell by 0.49 K in June to +0.34°K, see the following chart:
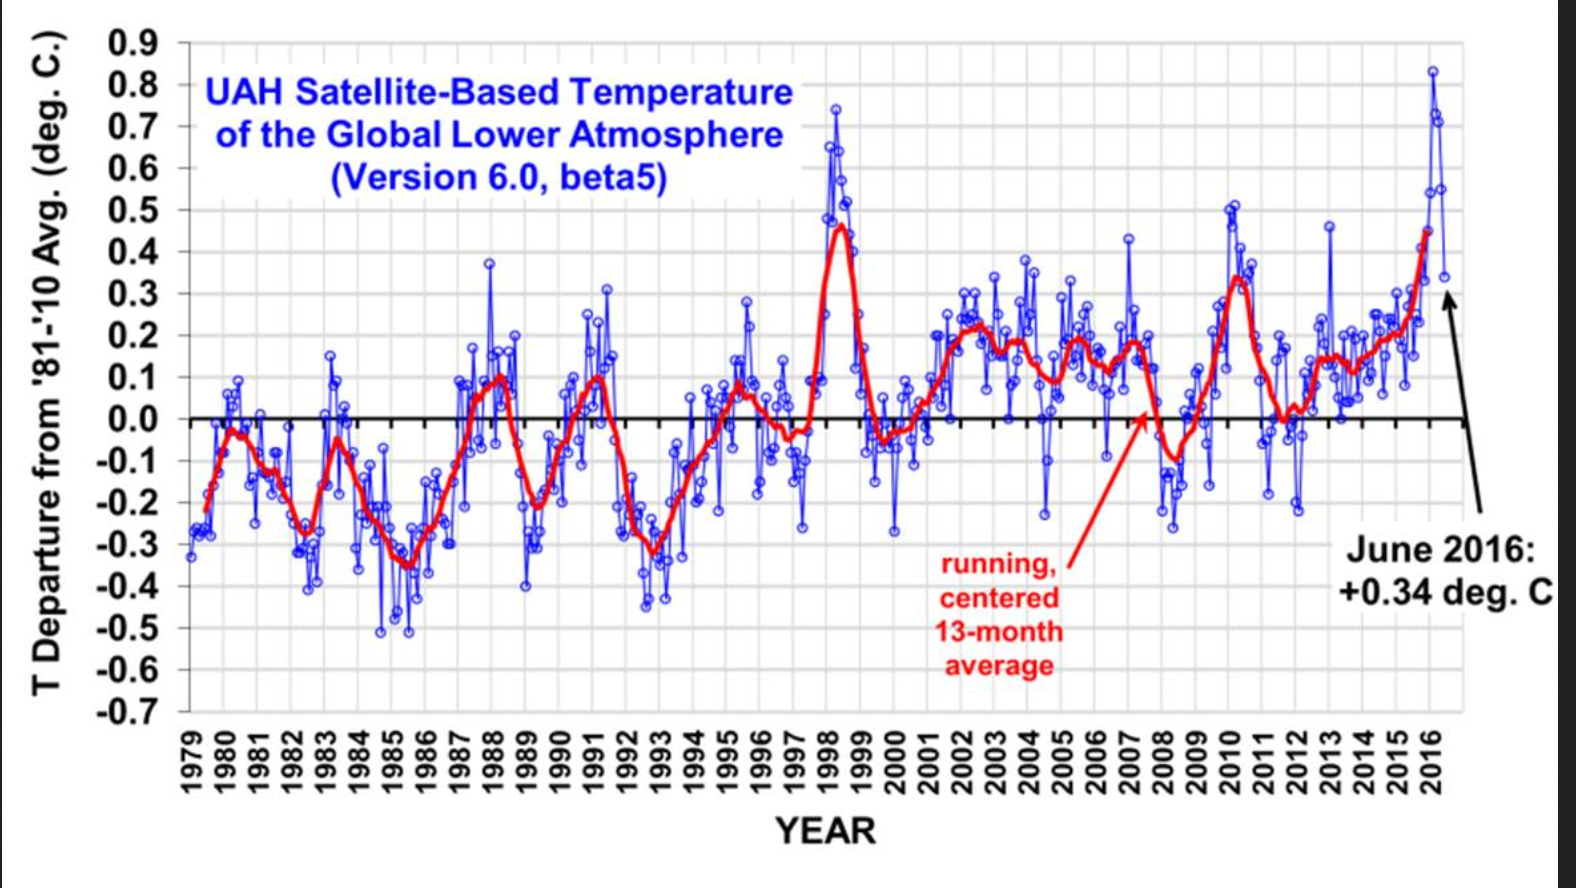
UAH chart depicting monthly lower troposphere temperature anomaly (blue curve), along the 13-month smoothed moving average (red curve). Original text: “This gives a 2-month temperature fall of -0.37 deg. C, which is the second largest in the 37+ year satellite record…the largest was -0.43 deg. C in Feb. 1988. In the tropics, there was a record fast 2-month cooling of -0.56 deg. C, just edging out -0.55 deg. C in June 1998 (also an El Nino weakening year).“ Source: UAH Global Temperature Update for June 2016: +0.34 deg. C.
Finally, after months of disagreement, the major ENSO models are now almost in full agreement that La Niña conditions will start to take hold this summer, now that there is already a deviation of -0.7°K. See: http://www.bom.gov.au/Pacific-Ocean.
The ENSO model CFSv2 of the NOAA again looks totally confused, as it did in May. Today the ENSO monthly prognosis shows a broad scatter of +0.4°K to -2.2°K for January 2017, see following chart. That means: Nobody knows!

The plot shows the CFSv2-ENSO prognosis from the NOAA July 17, 2016, for the monthly SSTA in the Nino region 3.4 up to April 2017. Source: www.cpc.ncep.noaa.gov/html.
The energy content of the water down to a depth of 300 m at the equatorial Pacific continues to show a negative anomaly for July 2016 at -1.0°K and thus has been in the cold La Niña range of under -0.5°K.

El Niño is dead – La Niña is coming! Source: www.cpc.ncep.noaa.gov/enso.shtml.
It is therefore not expected that a significant cooling will take place in July this year. Dr. Roy Spencer (UAH) has already pointed that out here:
Just remember, the temperature anomaly can also temporarily rebound for a month, as it did in late 1998.”
However, it is already clear from the unaltered satellite data of the first half of this year: 2016 will not be a record warm year.


A La Niña, a sun going “quiet”…I seem to recall that the AO and AMO are going negative (maybe?)…
I wonder what it all means for AGW… Hmmm…
La Nina will finally reveal the warmist’s simple statistical models as completely facile. Not only will their failed predictive methodology fall short of settled science, La Nina will show that carbon content is a poor indicator for climate … outside of its rich value with the cap and trade speculators.
Just some July reports of cold
Peru – 82 children die from intense cold — July 19, 2016
“Puno: 82 niños fallecen por el intenso frío,” reads the headline.
Killer cold in Peru — July 18, 2016
In the town of Atuncoya in Buenavista, Puno, inhabitants do not remember a winter with frost as strong as this.
Brazil – Cold to impact coffee production — July 19, 2016
Brazil – Huge hailstorm damages thousands of houses — July 15, 2016
50 cm (20 inches) of ice accumulated on the streets
Cold kills 61.000 cattle in Peru — July 14, 2016
Heavy snow strands thousands of Argentinians in Chile — July 13, 2016
Is Colorado snow a thing of the past? — July 12, 2016 Robert
“The past three Colorado ski seasons have hit all-time highs, ” says the Denver Post
July snowfall in three states — July 11, 2016
Snow reported in parts of Montana, Idaho, and Wyoming.
“Historical snow event” headed for Tasmania — July 10, 2016
Intense cold and cold in tropical Brazil — July 9, 2016
Vegetable crops affected.
Venezuela – Most snow ever seen in national park — July 7, 2016
Heavy snow covered the moors merideños.
Cold kills 48 children between May and June in Peru — July 5, 2016
Most deaths occurred in Cusco department, Junín, Huancavelica, Ayacucho and Puno, in central and southern Andean country.
Cold and snow kill 14 000 animals in Peru — July 5, 2016
Tropical Australia Freezes – Video — July 4, 2016
Australia receives 70 cm (2.3 feet) of snow across the mountains and tropical vegetation shivers under the weight of inches of snow.
Brazil – Parana records coldest June in 19 years — July 2, 2016
1 July 2016 – Average month temperature 3 ° C lower than last year.
~~~~~~~~~~~~~~~~~~~~~~~~~~~~~~~~~~~~
The Malthusian believers within the UN and those 'climate science™' alarmist are guilt as hell!More here
Where did my comment go?
La Nina caused global sea level drop
The 2011 La Niña was so strong that it caused global mean sea level to drop by 5 millimeters (0.2 inches), a new study shows.
http://phys.org/news/2012-10-la-nina-global-sea.html
Apparently all the water was deposited on Australia.
Global Warming was to blame:
The 2010-11 La Niña: Australia soaked by one of the strongest events on record
http://www.bom.gov.au/climate/enso/feature/ENSO-feature.shtml
Events of note…
http://www.thegwpf.com/philippines-wont-honor-paris-agreement/
The president of the Philippines succinctly and without reservation, consigns the Paris agreement to the dustbin
.
.
.
Just some July reports of cold
Peru – 82 children die from intense cold — July 19, 2016
“Puno: 82 niños fallecen por el intenso frío,” reads the headline.
Killer cold in Peru — July 18, 2016
In the town of Atuncoya in Buenavista, Puno, inhabitants do not remember a winter with frost as strong as this.
Brazil – Cold to impact coffee production — July 19, 2016
Brazil – Huge hailstorm damages thousands of houses — July 15, 2016
50 cm (20 inches) of ice accumulated on the streets
Cold kills 61.000 cattle in Peru — July 14, 2016
Heavy snow strands thousands of Argentinians in Chile — July 13, 2016
Is Colorado snow a thing of the past? — July 12, 2016 Robert
“The past three Colorado ski seasons have hit all-time highs, ” says the Denver Post
July snowfall in three states — July 11, 2016
Snow reported in parts of Montana, Idaho, and Wyoming.
“Historical snow event” headed for Tasmania — July 10, 2016
Intense cold and cold in tropical Brazil — July 9, 2016
Vegetable crops affected.
Venezuela – Most snow ever seen in national park — July 7, 2016
Heavy snow covered the moors merideños.
Cold kills 48 children between May and June in Peru — July 5, 2016
Most deaths occurred in Cusco department, Junín, Huancavelica, Ayacucho and Puno, in central and southern Andean country.
Cold and snow kill 14 000 animals in Peru — July 5, 2016
Tropical Australia Freezes – Video — July 4, 2016
Australia receives 70 cm (2.3 feet) of snow across the mountains and tropical vegetation shivers under the weight of inches of snow.
Brazil – Parana records coldest June in 19 years — July 2, 2016
1 July 2016 – Average month temperature 3 ° C lower than last year.
The Malthusian believers within the UN and those ‘climate science™’ alarmist are guilt as hell!
The Malthusian believers within the UN and those 'climate science™' alarmist are guilt as hell!More here
Increased frequency of extreme La Niña events under greenhouse warming
Wenju Cai
http://www.nature.com/nclimate/journal/v5/n2/full/nclimate2492.html
~ ~ ~
Increasing frequency of extreme El Niño events due to greenhouse warming
Wendi Cai
http://www.nature.com/nclimate/journal/v4/n2/full/nclimate2100.html
. . .
What happened before “greenhouse warming”?
If they write enough papers, they can cover every eventuality. 🙂
Somehow I don’t think that the claim that Global Warming causes freezing weather will be believed – except by sod.
ENSO Wrap-Up
Current state of the Pacific and Indian oceans
issued 19 July 2016
Typically during La Niña, winter-spring rainfall is above average over northern, central and eastern Australia.
If La Niña does develop, climate models indicate it will not be as strong as the most recent La Niña of 2010–12, which was one of the strongest La Niña on record.
http://www.bom.gov.au/climate/enso/?cid=009tw08
“winter-spring rainfall is above average over northern, central and eastern Australia.”
Yeah, thanks for reminding us !!#%#
Add southern too – Tassie has been flooded a lot in recent weeks.
While I am delighted at the prospect of proving the warmist zealots wrong, I’m not at all looking forward to the devastation a colder climate could engender.
Perhaps increased CO2 will be able to mitigate the effects? It is, after all, enabling the earth to become more green, so perhaps it can assist us in enduring the cold, as well.
The goons and parasites pushing (un)”renewable” energy “solutions” on us have squandered so many of our resources. I just hope they haven’t wasted so much that we won’t have what we need to deal with whatever future events may bring. Don’t the profiteers realize that it won’t matter how much money they make, if there’s nowhere to spend it, because there’s nothing to spend it on? Didn’t they learn in grade school about the goose that laid the golden egg?
http://www.storyit.com/Classics/Stories/goldengooseegg.htm
Apparently not. And these are the “geniuses” who want to tell the rest of us how to live our lives. Riiiiiiiight!
If this trend continues we’ll be living on a Hoth-like ice planet within 10 years.
NOAA has an operational definition for La Niña:
… characterized by a negative ONI less than or equal to -0.5ºC.
this threshold must be exceeded for a period of at least 5 consecutive overlapping
3-month seasons
It’s sort of like a recession – by the time it’s declared, everyone knows we’re in one. “La Niña conditions” are generally regarded as the ENSO 3.4 anomaly less than or equal to -0.5°C. Both concepts are useful, but only if people understand and use them correctly!
Meanwhile at NASA:
2016 Climate Trends Continue to Break Records
https://www.nasa.gov/feature/goddard/2016/climate-trends-continue-to-break-records
and according to Business Insider they are 99% sure 2016 will be the hottest! Year! On! Record!
[…] Fonte: notrickszone […]
A La Nina has NOT begun. The current conditions are neutral, and they have reduced the chance of a La Nina starting later in the year to about 50%. The most recent ONI reading is +0.7. This reading must be -0.5 or lower for 5 consecutive months for La Nina to be declared. (When it is declared, it is declared retrospectively to have begun at the first of those months.)