The sun in July 2016, and the AMO
By Frank Bosse and Fritz Vahrenholt
(Translated/edited by P Gosselin)
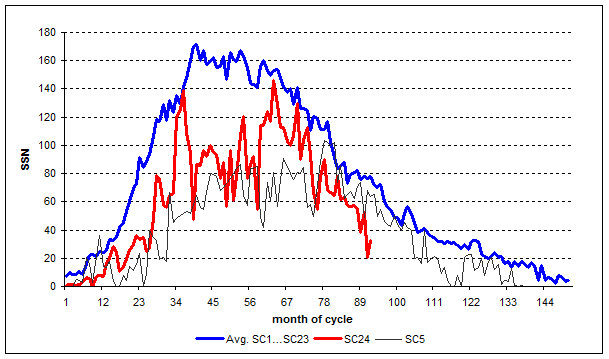
Our sole relevant source of energy at the center of our solar system was quieter than normal in July for our current solar cycle (SC) 24. The entire cycle so far has only been 56% as active as the mean cycle.
And with a sunspot number (SSN) of 32.5 in July, it was only 42% as active as the mean for the 92nd month into the cycle. Compared to a month earlier (only 27%) it was a slight uptick:

Fig. 1: SC 24 until July 2016 (red) compared to the mean cycle, which is computed from the mean of the previous 23 cycles (blue), and SC5 (black) which was very similar in behavior.
The small upward hook arises from there being 5 spotless days in July, compared to 9 in June. After the record lame start of the cycle over the first 2 years, are we now experiencing a similar end as well?
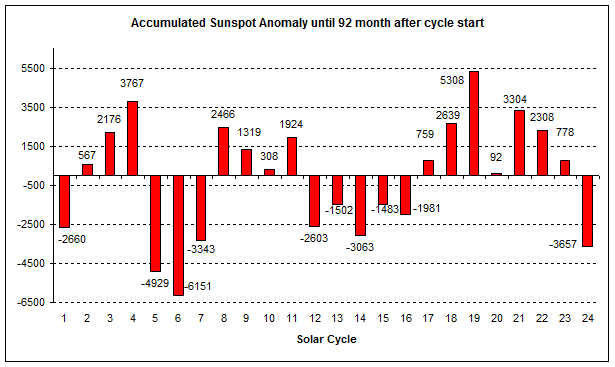
Compared to the previous cycles, not much has changed since the month earlier:

Fig. 2: Accumulated sunspot anomaly from the mean (blue curve, Figure 1) for each cycle, 92 months into the cycle.
The red bar to the far right has been gaining in length in its downward direction over the past few months. Where will it end? There are still about 36 months remaining in the cycle, and most likely the bar representing SC 24 will continue to fall further. In our next report we will take a look again at the current polar fields, which are the first predictors for the upcoming cycle.
================================
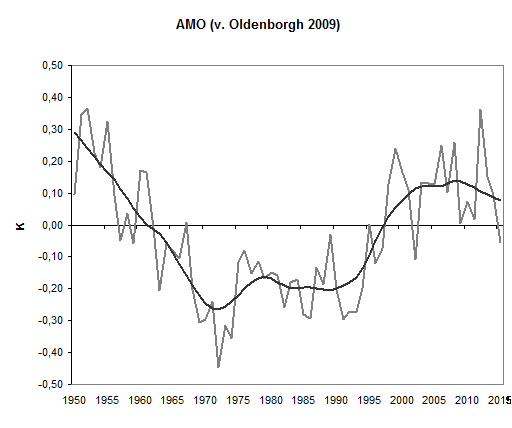
Due to time constraints, NTZ summarizes the main points pertaining to the AMO, the subject of the second part of Vahrenholt’s and Bosse’s post. Vahrenholt and Bosse present a figure that shows that the AMO likely has reached its positive maxima, and now may be headed downwards, which will have an impact on global climate over the coming decades.

AMO since 1950 with annual mean values and 20-year smoothing (low pass: Loess).
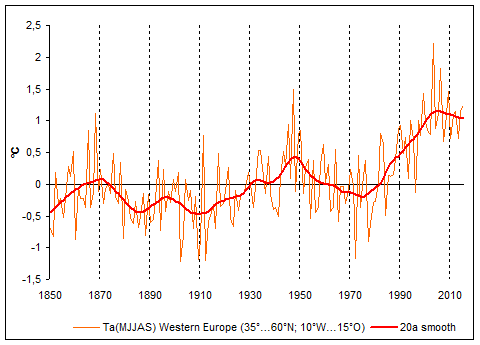
Bosse and Vahrenholt write that the AMO has an impact on hurricanes and the temperatures in Western Europe during the summer: “Yes, that’s right. How warm our summers are depends in large part on the AMO.”
The following chart depicts the land surface temperatures of Western Europe:

Western Europe land temperatures (CRUTEM 4) with a 20-year smoothing (Loess).
The two Die kalte Sonne authors write that the AMO plays a role on global temperature and that climate models have not taken the powerful AMO adequately into account, citing recent scientific publications. They summarize:
Many climate models and prognoses were tuned using data from the period 1976 to 2005 and assigned the effects of the reoccurring AMO increase during these years over to CO2. Climate sensitivity, the effect of CO2 on temperature, is thus overstated by 30-50%. The temperature changes expected from CO2 are less.”


Wow! 1950-2015 agreement between solar data and land temperature is quite good. But I wouldn’t say it “plays a role.” It’s more like it’s “writing the script.”
Nobody claimed any agreement between solar data and EU- summertemperatures in the article. Your comment is a red herring at it’s best!
Here is a spectacular CO2 fail:
Frost: Warmer temperatures will not reduce frost risk for growers
“Our actual crop simulation modelling has shown in many areas in the south and the west of the country that the last day of the serious frost risk has actually been receding, rather than becoming earlier,” he said.
“The other thing is that they’ve actually been getting more frost days, even though the average temperatures have been going up.”
http://www.abc.net.au/news/2016-08-09/temperatures-rising-but-frost-risk-remains-high/7703618
CSIRO AUST GOVT: The number of very hot days per year are projected to increase across Australia, particularly in the sub-tropical and tropical regions, and the number of frosts are likely to decrease.
http://www.aph.gov.au/About_Parliament/Parliamentary_Departments/Parliamentary_Library/Browse_by_Topic/ClimateChangeold/theClimate/temperatures
IPCC 2007
Some extreme weather events have changed in frequency and/or intensity over the last 50 years:
• It is very likely that cold days, cold nights and frosts have become less frequent over most land areas, while hot days and hot nights have become more frequent. {WGI 3.8, SPM}
http://www.ipcc.ch/publications_and_data/ar4/syr/en/mains1.html
In my opinion, the CRUTEM4 data series underestimate the warming spike of the 1930’s to the 1950’s. In my grand parents’ memory, that was the warmest period they knew. The newspaper extracts which can be found on the meteo-paris web site are quite a confirmation of their memories.
Chronicles from newspapers from 1850 to now:
http://www.meteo-paris.com/chronique
(sorry, in French, use an online translator).
This not truncated version of the AMO by Oldenborgh agrees with your grandparents memory, but not with the CRUTEM4 between 1940 and 1950.
https://wattsupwiththat.files.wordpress.com/2016/05/image4.png
Far be it from me though to accuse anyone of tampering with the temperature data //cough cough//
Your cited figure of the AMO is the same as the used figure in the article and it makes me wonder how you can tell anything about the agreement of the AMO with anything b4 1950. Far from accuse anybody of telling BS!
[…] Fonte: notrickszone […]