What follows is a highly discomforting fact, and it’s not going to go away.
============================================
A small sensation goes unnoticed by the press: Solar activity indeed reached maximum value in late 20th century
By Dr. Sebastian Lüning and Fritz Vahrenholt
(German text translated/edited by P Gosselin)
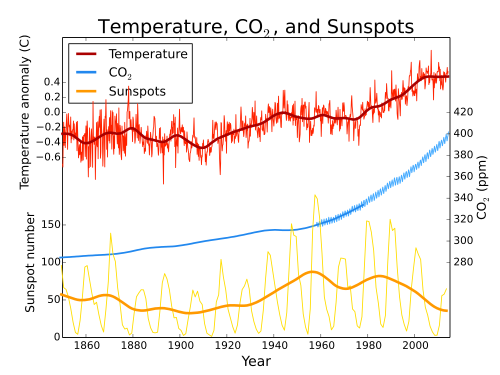
Previously it was constantly claimed that solar activity couldn’t possibly have anything to do with the warming of the late 20th century because both curves fully diverged from each other. As proof, the following charts from Wikipedia were used:

Figure 1: Comparison of global temperature, CO2 and solar activity. From Wikipedia. Source: Leland McInnes at the English language Wikipedia [GFDL (http://www.gnu.org/copyleft/fdl.html) or CC-BY-SA-3.0 (http://creativecommons.org/licenses/by-sa/3.0/)], via Wikimedia Commons.
The problem
Solar activity is not made up merely by the shaky sunspots. The above figure is an update from 2014 and was provided by a user with a less than trustworthy name of “Kopiersperre”.
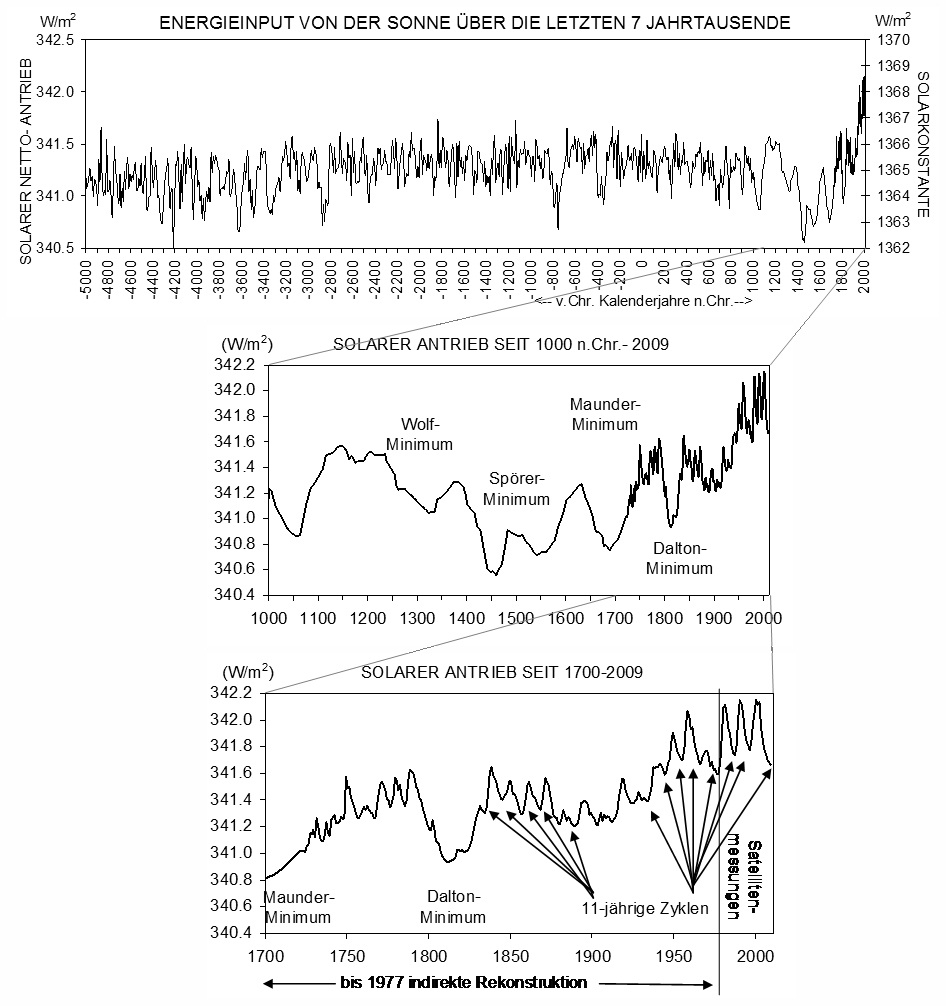
The updated curve for solar activity is available from the Austrian Zentralanstalt für Meteorologie und Geodynamik (ZAMG) and research group PAGES:

Figure 2: Fluctuations in solar climate drive on millennial, century and decadal scales. Top: The 20th century had the strongest solar activity in 11,000 years (here 7000 years are shown). Middle: The powerful drive of the Medieval Period and the scant amount of solar drive in the following centuries, followed by the extraordinary jump to the current level. Bottom chart: Only when using the short-term scale do we clearly see the 11-year cycle (Fröhlich 2000 aktual., Wagner and others 2007). Figure source: ZAMG.

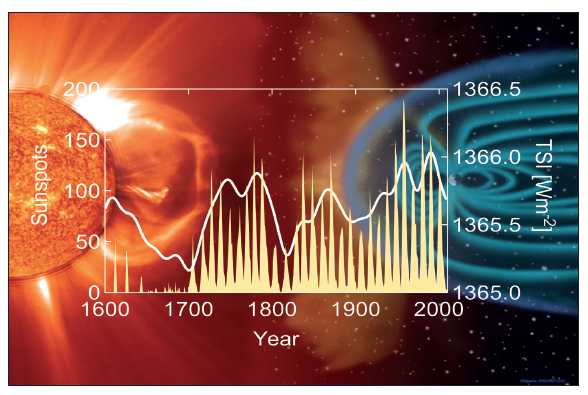
Figure 3: Solar activity over the past 400 years. White curve; Total Solar Irradiance (TSI); Yellow curve shows sunspots. Figure source: PAGES.
The great changes in understanding solar activity were illustrated by Matthes & Funke at the end of 2015 at a conference contribution on page 9 (old curve SATIRE-TS in red):

Figure 4: The new and old curves for solar activity during the past 165 years. Source: page 9 in Matthes & Funke 2015.
But it gets even better
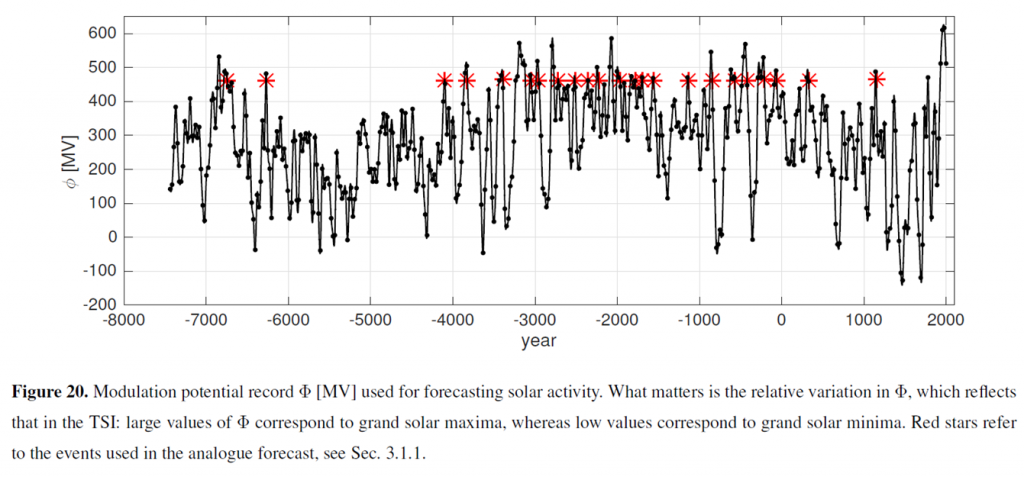
The sun not only reached its maximum at the end of the 20th century, but was apparently stronger than at any time over the past 10,000 years. Matthes et al. showed this in a very recent publication in the journal Geoscientific Model Development Discussions in 2016:

Figure 5: Source: Figure 20 in Matthes et al. 2016
Mysterious retreat
By the way, the unusually powerful solar activity in the second half of the 20th century had been already reported on by Sami Solanki in Nature here more than 10 years ago. Afterwards he mysteriously retreated from the climate discussion. Is this perhaps the reason why solar scientists operate almost unnoticed below the media radar?
Discomforting questions
The unexpectedly strong sun casts especially discomforting questions that some would just prefer to dodge. Couldn’t the high solar activity have something to do with the 1980-2000 warming after all?
In any case, now no one can insist that the solar activity and temperature curves diverge and thus refute the relationship. The attribution has to be re-examined altogether. There is no alternative.


Sami Solanki also observed that Nature stopped publishing solar papers for years. When I publicised his (publicly available but obscurely located) comment, he wrote to me saying I should remove it. I refused. ‘Nature’s bad behaviour is and should continue to be a matter of public record.
https://tallbloke.wordpress.com/2010/07/17/sun-rediscovered-by-nature/
Interesting to have these recent articles. Here is an approach consistent with the findings above, attempting to quantify natural climate effects from both ocean and solar cycles.
https://rclutz.wordpress.com/2016/06/22/quantifying-natural-climate-change/
Ron, thanks for this – fascinating.
http://www.researchgate.net/profile/Daniel_Nordemann/publication/226333495_Reconstruction_of_Wolf_Sunspot_Numbers_on_the_Basis_of_Spectral_Characteristics_and_Estimates_of_Associated_Radio_Flux_and_Solar_Wind_Parameters_for_the_Last_Millennium/links/0deec518cf2a6f1ac8000000.pdf
“[I]n the last 1000 years solar activity displayed a Great Medieval Maximum, 1100 – 1250 AD, followed by a period of lower solar activity until the start of the 20th century. … The Oort, Wolf, Spörer, Maunder, and Dalton Minimums have been identified, as have the Medieval Maximum and the so-called Modern Maximum, starting near 1900.”
http://www.aanda.org/articles/aa/pdf/2014/02/aa23391-14.pdf
[T]he modern Grand maximum (which occurred during solar cycles 19–23, i.e., 1950–2009) was a rare or even unique event, in both magnitude and duration, in the past three millennia. Except for these extreme cases, our reconstruction otherwise reveals that solar activity is well confined within a relatively narrow range.
http://link.springer.com/article/10.1007/s11434-010-4177-1#page-1
“It is seen that a very active period that began in 1920, the so-called ‘current grand solar maximum’, will probably end during 2011-2027 … The current grand solar maximum started in 1920 and lasted for eight 11-year solar cycles.”
http://www.nature.com/nature/journal/v431/n7012/full/nature02995.html
“[T]he level of solar activity during the past 70 years is exceptional, and the previous period of equally high activity occurred more than 8,000 years ago. We find that during the past 11,400 years the Sun spent only of the order of 10% of the time at a similarly high level of magnetic activity and almost all of the earlier high-activity periods were shorter than the present episode.”
http://eae.sagepub.com/content/25/8/1455.short
“Here we show that the cumulative influence of the unusually elevated solar activity in the 64 years 1941-2005, as calculated using the time-integral of sunspot number anomalies (with a proxy factor) might have been a primary cause of the global warming observed through 2001. After 2001 the low solar activity is consistent with the observed flat average global temperature trend. The physically-based predictive equation, with the widely-projected decline in solar activity, moderated by the substantial effective thermal capacitance of the planet, especially the oceans, projects a downtrend steeper than 0.1K/decade.”
http://www.sciencedirect.com/science/article/pii/S136468261200288X
“Using thermometer-based air temperature records for the period 1850–2010, we present empirical evidence for a direct relationship between total solar irradiance (TSI) and the Equator-to-Pole (Arctic) surface temperature gradient (EPTG). Overall, evidence suggests that a net increase in the TSI, or in the projected solar insolation gradient which reflects any net increase in solar radiation, has caused an increase in both oceanic and atmospheric heat transport to the Arctic in the warm period since the 1970s”
Have you look at the axis on those nice charts?
http://kaltesonne.de/wp-content/uploads/2016/08/2-2-5_1_Solarkonstante.png
you can see the effect in W/m².
And you can compare with recent articles on this very blog:
“forcing attributed to the CO2 change for the last 265 years combined is less than 2 W/m2 (1.8 W/m2)”
https://notrickszone.com/2016/08/18/theres-no-observational-physical-evidence-that-co2-heats-water/
So do we agree then, that CO2 forcings are stronger than the solar ones?
sod: “So do we agree then, that CO2 forcings are stronger than the solar ones?”
Have you been able to find a scientific source that shows that “CO2 forcings” can heat water to depths of thousands of meters?
https://notrickszone.com/2016/08/18/theres-no-observational-physical-evidence-that-co2-heats-water/#sthash.wiyt1232.dpbs
Or do you still only have youtube videos that show that CO2 heats up air in science labs? Until you can provide evidence that the oceans are heated by CO2, your “CO2 forcings are stronger” beliefs are just that. The alleged W/m2 values for CO2 are rooted in models and assumption, not on observational evidence, direct physical measurement, or scientific experiment.
Your own blogscience sources (Skeptical Science, Real Climate) acknowledge that the heat “trapped” by CO2 at the surface skin cannot penetrate into the ocean. So how in the world is it going to heat the ocean — where 93% of the heat energy from global warming is located? These sources also acknowledge that cloud forcing is far more dominant a source of influence on climate than is CO2…because of the role they play in altering solar forcing (surface solar insolation).
Not only that, but even the IPCC and NOAA acknowledge that the values generated for solar forcing are very uncertain.
IPCC AR4:
“There is more uncertainty regarding the influence of solar forcing. …[S]ubstantial uncertainty in the timing and amplitude of solar variations on time scales of several decades to centuries…[U]ncertainties remain large because of the lack of direct observations and incomplete understanding of solar variability mechanisms over long time scales”
http://www.ncdc.noaa.gov/monitoring-references/faq/global-warming.php
“[O]ur understanding of the indirect effects of changes in solar output and feedbacks in the climate system is minimal. There is much need to refine our understanding of key natural forcing mechanisms of the climate, including solar irradiance changes, in order to reduce uncertainty in our projections of future climate change.”
Sop, The sun is a SOURCE of energy.
CO2 is NOT. !
CO2 does NOT force anything.
CO2 does NOT heat anything,
CO2 does NOT provide any energy,
CO2 does NOT stop any energy from leaving the system.
SOD, the CO2 forcing by itself produces an immaterial ~1.2C per doubling. It is the feedbacks that count. And observation since ~1880 says the net ECS is about 1.5-1.8C, again nothing to worry about. About half of CMIP5 models, already falsified in two ways: discrepancy from observed troposphere temperature, absence of modeled tropical troposphere hotspot.
“the CO2 forcing by itself produces an THEORETICAL and immaterial ~1.2C per doubling.
There is no proof at all that it can ever cause any warming in an open atmosphere
There is a substantial body of work on the subject of solar impact on climate, more than we will find on blogs.
We are mainly interested in solar variations related to climate variations. Variation in solar irradiance during the 11-year cycle account for only about 0.1 W-m2 variation at the top of the atmosphere, compared with 1360 Wm-2 total solar irradiance. So it is correct to ignore single solar cycles.
Steinhilber et al have estimated longer term variations using proxies, They estimated that since the Maunder minimum about 400 years ago, increase in TSI has accounted for an increase of 0.9 W-m2 at the top of the atmosphere.
This compares with the modern radiative imbalance estimated by Hansen et al (2011) of 0.6 W-m2.
My understanding is that when we compare the estimates by Steinhilber and Hansen, the entire warming from the Maunder minimum to the present could be accounted for by solar activity. Therefore, to dismiss the role of the Sun we ought first to falsify Steinhilber and the results of other groups of researchers that have made similar claims.
Solar effects upon climate may not end with TSI, because the Sun varies more in the UV part of the spectrum than in the visible part, which may impact climate via the ozone level.
Astrophysicits, such as Frisch and Zank have studied the impact of the local interstellar cloud upon the heliosphere. (reference below).
Best to remember that some astrophysicists are competent as climatologists, especially in relation to the impact of stars upon their planets.
A very few astrophysicists study the gravitational impact of giant planets upon their suns. The barycenter of the solar system is not at the center of the Sun, but near its surface. (A similar relationship between Earth and Moon creates tides on Earth.) The revolution of the Sun about the barycenter may affect its dynamo(s), solar magnetism and the solar wind that modulates the flux of cosmic particles that enter the Earth’s atmosphere.
Some physicists claim there is a relationship between cosmic ray flux and the Earth’s albedo via variations in certain types of clouds. See Halle et al, below and Shavi and Veizer. Jasper Kirkby ran a lab test at CERN to check the physics.
To address this question moderately well might take several months review of the literature. These references may help get started.
———————-
Steinhilber, F., J. Beer, and C. Fröhlich. “Total solar irradiance during the Holocene.” Geophysical Research Letters 36.19 (2009).
http://www.leif.org/EOS/2009GL040142.pdf
Hansen, James, et al. “Earth’s energy imbalance and implications.” Atmospheric Chemistry and Physics 11.24 (2011): 13421-13449.
URL: http://www.atmos-chem-phys.net…
Nir J. Shaviv, Ján Veizer, Celestial driver of Phanerozoic climate?
http://ruby.fgcu.edu/courses/twimberley/enviropol/EnviroPhilo/Phanerozoic.pdf
Zank, Gary P.; FRISCH, Priscilla C. Consequences of a change in the galactic environment of the Sun. The Astrophysical Journal, 1999, 518.2: 965.
http://arxiv.org/pdf/astro-ph/9901279.pdf
SUNSHINE, CLOUDS AND COSMIC RAYS.
E. Palle ´ Bago ´ and C.J. Butler
http://ruby.fgcu.edu/courses/twimberley/EnviroPhilo/PalleBago.pdf
Zank, Gary P.; FRISCH, Priscilla C. Consequences of a change in the galactic environment of the Sun. The Astrophysical Journal, 1999, 518.2: 965.http://arxiv.org/pdf/astro-ph/9901279.pdf
SUNSHINE, CLOUDS AND COSMIC RAYS.
E. Palle ´ Bago ´ and C.J. Butler
http://ruby.fgcu.edu/courses/twimberley/EnviroPhilo/PalleBago.pdf
What role has the sun played in climate change in recent decades? – ResearchGate. Available from: https://www.researchgate.net/post/What_role_has_the_sun_played_in_climate_change_in_recent_decades#572204fbdc332dbeae79b7b6 [accessed Apr 28, 2016].
I believe that Svensmark is quite likely correct in that when we have weaker solar magnetic activity we have increased numbers of Galactic cosmic rays in the inner solar system and these GCRs interact with Earth’s atmosphere to change our albedo. Increased GCRs slightly increase cloud cover and that change in cloud cover seems to be enough to account for the changes we see in climate. Just keep an eye on the neutron counts.
I also believe that Dr. David Evans is also onto something with his notion of the Earth’s response being somewhat lagged (by about 10 years, give or take) and the response acting as something of a “notch filter”. We’ll certainly see over the next several years as things play out.
Crosspatch~ I mentioned that lag in a tangential comment elsewhere (WATTS) months ago, but got no response… it had to do with hurricanes and in light of this last el-nino it was probably wrong, but: it seemed to me there was a lag between the ‘super’ el-nino of 1998 and the last really big hurricane season in 2005. I sometimes wonder if there was any correlation there…
This is the most likely hypothesis currently available since it fits with more climate observations than any other:
http://joannenova.com.au/2015/01/is-the-sun-driving-ozone-and-changing-the-climate/