The following are excerpts from German skeptic site here, wobleibtdieerderwaermung.
====================================================
By Schneefan
Already in August, is the year 2016 a bit cooler than the year 1998, according to satellite data from UAH. That situation remains the same as September saw a reading of +0.44°C.
The global 2m temperatures with a deviation of +0.38°K eased off slightly from the August reading of 0.42°K, see the following chart:
The above UAH chart shows the monthly deviations from the mean (blue line) of the global temperatures of the lower troposphere at 1500 meters altitude (TLT) and the 13-month running average (red curve). Due to a powerful globally time-shifted El Niño event beginning in the summer of 2015, there was a record string of months from November to March. There was a strong retreat from April to June, with temperatures stagnant near 0.44°K over the past 3 months. Source: UAH Global Temperature Update for September 2016: +0.44°CC.
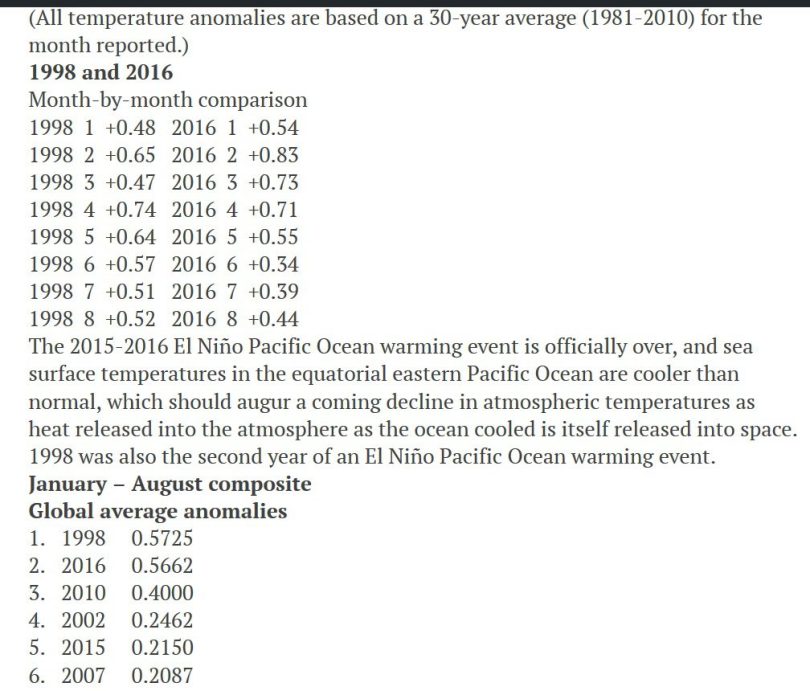
What follows is a direct comparison of the January – August period for both 1998 and 2016 El Niño years:
The upper table shows the direct comparison of the global monthly UAH deviations from the mean for 1998 and 2016. The lower table shows that 2016, from January to August is now 0.06°K lower than 1998. Source: Global Temperature Report: August 2016.
Thus 1998’s lead is maintained when September is included, as there was no change.
After the temperature fall in May and June, the global cooling has taken a pause since July when observing the unfalsified global satellite data of the UAH.
The UAH temperatures in the tropics for June show a record two month drop since satellite measurements began in 1979.
„…In the tropics, there was a record fast 2-month cooling of -0.56°C, just edging out -0.55°C in June 1998 (also an El Nino weakening year).“
Using the unfalsified data for the first alf of the year, it is clear that 2016 is not the hottest year on record so far, and that it probably will not become the record year!
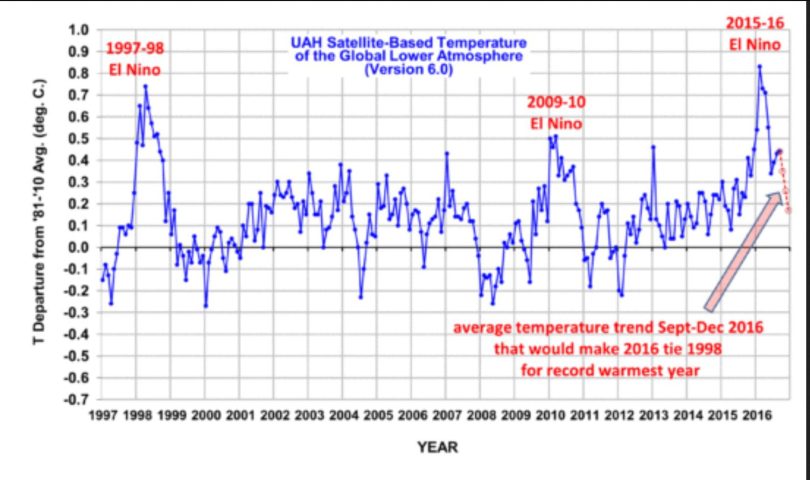
There is of course a chance that 2016 could finish equal or even a bit warmer than 1998, as Dr. Roy Spencer shows with last month’s chart:
The arrow on the right side shows the temperature development that would be necessary for 2016 to reach 1998. Source: UAH Global Temperature Update for September 2016: +0.44°C.
So what can we expect for the remainder of the year?
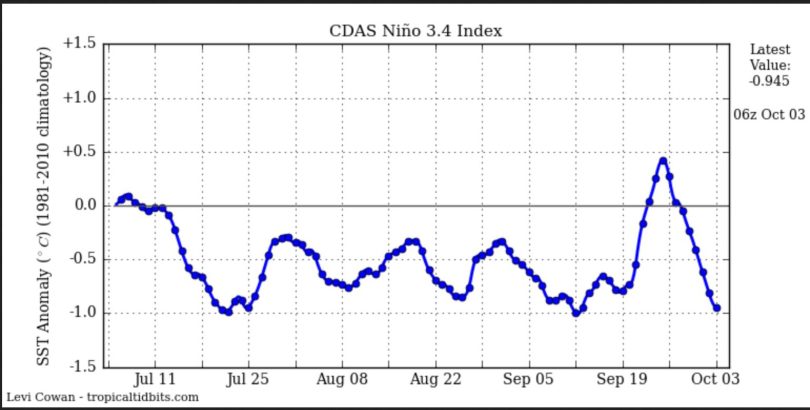
In October 2016 the retreat in global temperatures should resume because the global cooling La Niña is strengthening. Also the current strong retreat in sea surface temperatures (SSTA) in the main El Niño region 3.4 is clear to see:
The above plot shows the daily SSTA in the El Niño 3.4 region as a deviation from the WMO 1981-2010 mean. The data are from NOAA/CDAS (Climate Data Assimilation System). The value as of 3 October 2016 is -0.94°K, well into La Nina territory. Source: www.tropicaltidbits.com/analysis/ocean/.


Excellent article. The ironic thing about the warmists is that they claim to want to save the earth from warming (settled science), yet they fight like mad against any data sets or studies that puncture their flimsy, sophomoric hypothesis — the exact opposite of the scientific method.
Jamie: I noticed that. In my career if there was a problem we had to be able to define what the problem was and then be able to define how we would know that the problem was fixed. I have yet to get a warmist to tell me what (climate) indications will tell him/her that AGW is fixed/countered/returned to normal/whatever. People like Gore etc are great at telling us what the problem is – and how (ha-ha) how to fix it, but they cannot tell us how we/they will know it is fixed.
Harry, that’s a great question to put to warmists! Thank you, I shall add that one to my responses. Actually, better still, I shall boost that to the top of my list. Excellent! Cheers! 🙂
T%his article says exactly the opposite of what even Roy Spencer says (who massively adjusted his data since 1998, by the way):
“Based upon this chart, as we enter the home stretch, it looks increasingly like 2016 might be a new record-warm year (since the satellite record began in 1979) in the UAH dataset.”
http://www.drroyspencer.com/2016/10/uah-global-temperature-update-for-september-2016-0-44-deg-c/
Sorry, but these claims are total garbage.
Sop, don’t forget to set your heater to 0.01C cooler over winter to compensate. 😉
EL NINO. !
its all you have,
….because its the cause of the ONLY warming in the satellite temperature data.
No, AndyG55, that’s not all they have. They also have DATA ADJUSTEMENTS.
http://realclimatescience.com/wp-content/uploads/2016/10/Screen-Shot-2016-10-01-at-6.15.48-AM-1-768×578.jpg
(But, yeah, if they were honest, El Nino would be all they had.)
You saved me a post. Thanks
Thanks Jack
but I didn’t think you knew anything about El Ninos.
Maybe you are brighter than a turnip.
And there is no La Nina is the forecast.
http://www.cpc.ncep.noaa.gov/products/analysis_monitoring/lanina/enso_evolution-status-fcsts-web.pdf
My response was to sod.
And as of Oct 3, there is no La Nina in the forecast.
ENSO-neutral conditions are present.*
Equatorial sea surface temperatures (SST) are near or below average in the
east-central and eastern Pacific Ocean.
ENSO-neutral conditions are slightly favored (between 55-60%) during the
upcoming Northern Hemisphere fall and winter 2016-17.
Assuming it is your belief, Jack, that ENSO has little to do with temperature increases or decreases, and that parts per million (0.000001) changes in atmospheric CO2 concentrations are what predominantly determine the heat content of the global oceans to depths of 1000s of meters, as well as all the way up to the top of the atmosphere’s temperatures, what difference does it make to you what the ENSO forecast is? La Nina vs. “ENSO-neutral” aren’t going to influence temperatures as much as CO2 is, right?
http://www.woodfortrees.org/plot/rss/from:2016/to/plot/rss/from:2016/to/trend/plot/uah6/from:2016/to/plot/uah6/from:2016/to/trend
Assuming this is your belief, please explain what the cause of the -0.5 C temperature drop between over the course of the last 8 months or so. How does that sharp temperature drop correlate with CO2 concentration changes?
Kenneth – wrong assumption(s) about ENSO; of course it has an impact. Spencer is forecasting that 2016 will be the warmest year in the UAH dataset.
“of course [ENSO] has an impact”
What’s the extent of the ENSO impact, then, Jack, relative to anthropogenic CO2 forcing? How much of the 2015-’16 temperature change was due to ENSO, and how much was due to humans emitting CO2? How much of the 1997-’98 temperature change was due to ENSO, and how much was due to humans emitting CO2? Please support your answer scientifically.
our source is very bad. It also keep making false claims about temperatures in Germany. Why not discuss september a little?
https://www.dwd.de/DE/presse/pressemitteilungen/DE/2016/20160929_deutschlandwetter_september_news.html
“one of the warmest”….
“our source is very bad.”
“www.dwd.de”
Why do you link to the government site of a fanatic Green government when you don’t like it?
Even Germany is increasing its CO2 output.
Great to see, hey, sop 🙂
Maybe it’ll help restore the ecology they’ve destroyed to install those useless bird and bat shredders.
C4 would be the best start. !!
And, no, I don’t mean the plant process type of C4 🙂
Yep. I got it. 🙂
How is sod wrong – let me count the ways…
http://www.c3headlines.com/quotes-from-global-warming-critics-skeptics-sceptics.html
Global warming, climate change, extreme weather etc. has essentially become a religion, Even with the notion one must be a believer, implying a kind of faith. Such data sets or studies challenge the dogma the warmists hold religiously. Reality and logic don’t have a big part to play here.
As of October 3, no La Nina is forecast
“ENSO-neutral conditions are present.*
Equatorial sea surface temperatures (SST) are near or below average in the
east-central and eastern Pacific Ocean.
ENSO-neutral conditions are slightly favored (between 55-60%) during the
upcoming Northern Hemisphere fall and winter 2016-17.*”
http://www.cpc.ncep.noaa.gov/products/analysis_monitoring/lanina/enso_evolution-status-fcsts-web.pdf
BOM has different ideas
http://www.bom.gov.au/climate/enso/#tabs=SOI
And just remember this.
NOTHING that any of the developed countries do will make even the slightest difference to atmospheric CO2 levels
China will continue to increase it CO2 output
India will continue to increase it CO2 output
Turkey will continue to increase it CO2 output
Poland will continue to increase it CO2 output
And with South Africa , and other African countries also getting aid from China for coal or gas fired electricity, there will be PLENTY of atmospheric CO2 for every plant in the world
SUCK IT UP, Jack 🙂