As Europe and USA brace for more frigid weather, some are asking if this is what we need to expect to cope with in the future.
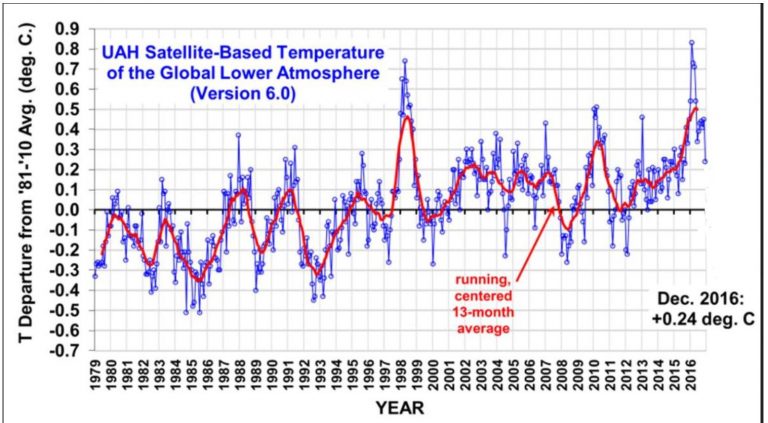
Now it’s clear that the recent “record warm” 2 years had little to do with CO2, and instead were almost entirely due to the well-known El-Nino phenomenon over the past two years.
And now that the recent El Nino has disappeared, temperatures globally are in a free fall and back at levels of the previous decade and indications show a further drop.
The ENSO now in cool phase
Unfortunately even that enhanced layer of CO2 we have in the atmosphere was not able to trap any of the recent heat. The 20-year pause remains pretty much intact, and will be extended as the El Nino Southern Oscillation (ENSO) hovers near the cooling La Nina territory.
Note that it will take the cooler equatorial Pacific surface temperatures a few months to make there way into the lower tropospheric satellite data. Don’t be surprised if this year we see a repeat of 1999.
Last El Nino not really warmer than 1998
Dr. Roy Spencer here wrote that 2016 will in fact NOT be statistically warmer of any significance compared to 1998.
According to global warming theory, the earth is supposed to warm some 2.0 to 4.5°C by 2100, which means 0.2 – 0.45°C per decade. So shouldn’t the recent El Nino have warmed the globe some 0.4 to 0.8°C more than 1998? Not even close, as the speedometer below shows! For hardcore warmists, it is increasingly becoming a huge challenge to explain the glaring lack of warming so far this century.
German weather and climate analysis site wobleibtdieerderwaermung here writes on this:
The IPCC climate models for the temperature development have been way too high with their estimation as the comparison of the model calculations to the real, observed development recorded by satellite for January 2001 to Juni 2016.
The Global Warming Speedometer for January 2001 to June 2016 shows observed warming on the HadCRUT4 and NCEI surface temperature datasets as below IPCC’s least prediction in 1990 and somewhat on the low side of its 1995 and 2001 predictions, while the satellite datasets show less warming than all IPCC predictions from 1990 to 2001. Later IPCC predictions are too recent to be reliably testable. Source: Is the Reuters “news” agency committing fraud?“
North Atlantic is cooling
Things also do not bode well for the global warming alarmists in the Atlantic as well, as Kenneth Richard pointed out here yesterday: “North Atlantic Cooling Has Plunged Below 1950s (And 1800s) Levels – And Scientists Project More Cooling“.
The sun enters period of cool activity
Solar activity is also now at a low point as the current cycle winds down. meanwhile a majority of scientists are confident the next cycle will also be a weak one. Periods of weak solar cycles are associated with periods of global cooling.
Greenland on record ice mass rampage
And although Arctic temperatures have been well above normal this winter, Greenland’s surface ice mass continues at its rampage record level:

Top: The total daily contribution to the surface mass balance from the entire ice sheet (blue line, Gt/day). Bottom: The accumulated surface mass balance from September 1st to now (blue line, Gt) and the season 2011-12 (red) which had very high summer melt in Greenland. For comparison, the mean curve from the period 1990-2013 is shown (dark grey). Source: DMI.
Greenland ice mas is now some 100 gigatons (cubic km) above normal.
Intense cold across Europe and North America
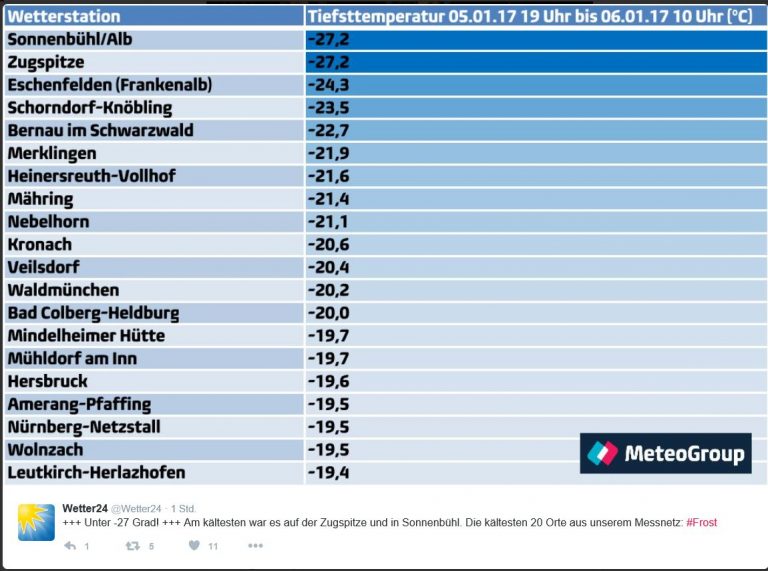
Currently Europe is being gripped by an intense cold wave, one that has sent temperatures in Germany to as low as -27°C this morning.
A number of stations recorded readings under -20°C. Image: Wetter24.
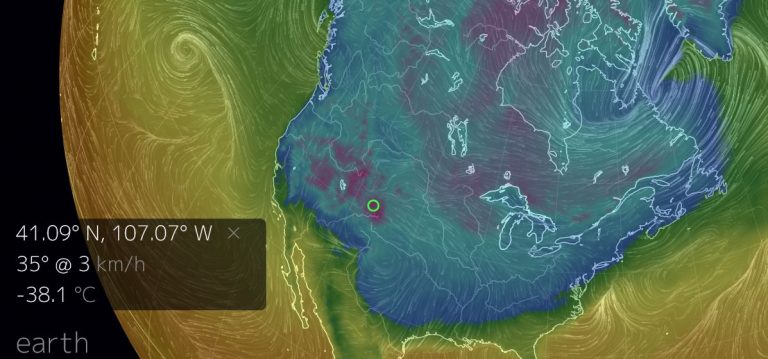
USA is also bracing for a cold wave — one that is going to intensify and send temperatures far below normal over the coming days.
Temperatures in the southwest close to 40°C below (6 a.m. EST). Image cropped from earth.nullschool.net

![The Speedometer for the 15 years 4 months January 2001 to April 2016 shows the [1.1, 4.2] C°/century-equivalent range of global warming rates (red/orange) that IPCC’s 1990, 1995 and 2001 reports predicted should be happening by now, against real-world warming (green) equivalent to <0.5 C°/century over the period, taken as the least-squares linear-regression trend on the mean of the RSS and UAH satellite global lower-troposphere temperature datasets. Quelle: http://joannenova.com.au/2016/05/monckton-ipcc-climate-models-speeding-out-of-control-compared-to-real-world/](https://wobleibtdieglobaleerwaermung.files.wordpress.com/2016/07/klimamodelleabweichungenjan2016bisjunil2016-e1469356263447.jpg?w=810&h=813)


It’s always cold in Finland this time of year but…
Finland has a new record cold at -41.7°C see
http://yle.fi/uutiset/osasto/news/extreme_weather_in_finland_cold_record_snaps_at_-417_lightning_strikes_porkkala/9388109
and the mass transit stops running see –
http://yle.fi/uutiset/osasto/news/trains_freeze_up_again_on_holiday_weekend/9391080
and the windmills have major problems see —
http://yle.fi/uutiset/osasto/news/fires_strike_residential_buildings_wind_turbine/9391170
The people of Finland need to be told that the global warming is still ongoing, that is why 2016 was the hottest year ever.
One small correction. The current forecast is for the next solar cycle to be slightly stronger than this one has been though that is using an early forecasting mechanism that will need to be verified by additional means as we get farther along.
“… Arctic temperatures have been well above normal this winter, Greenland’s surface ice mass …” grows.
When wind comes to Greenland from the south [your ‘nullschool’ capture], more or less, it comes from over the Atlantic Ocean and carries more moisture than it would if it was a West or North wind.
When going up-slope over Greenland the air expands, cools, and water vapor changes to solid. Latent heat of fusion is released and air warms while snow forms.
Temperature along the wind path, that is the Arctic Region, goes up.
So it appears to me.
HadSST3 shows how the oceans made the warmer temps.
https://rclutz.wordpress.com/2016/12/29/anatomy-of-the-hottest-years-ever/
RSS data is in. 2016 was the hottest year on record and beat 1998 by a wide margin, even in the satellite data preferred by “sceptics”.
http://images.remss.com/papers/rsstech/Jan_5_2017_news_release.pdf
Concentrating on momentary blips much at the warmunist madhouses?
What I find interesting is that the 13month avg of UAH of the recent El Nino did not manage to rise above the 1999 El Nino.
WRONG.
Sop doesn’t understand errors.
RSS TLT 2016 is 0.559ºC
RSS TLT 1998 is 0.550ºC
These are the same number in a system that purports to have an accuracy of 0.1ºC
TLT has been shown to be a near perfect match trend for the only untampered surface data in the world, USCRN over the USA, thus validating the use of over TTT which is not trend matched and has a spurious warming trend.
RSS4.0 is TTT, which is a warmist’s attempt to fudge the data.. It has been shown to have “issues” and doesn’t represent the near surface like TLT does.
UAH is the same. The difference is 0.02.. so well inside the stated error
2016 is NO WARMER than 1998.
December 2016 is the 5th warmest December in UAH
and the NINTH warmest December in RSS
After the El Nino transient, we have had the most rapid cooling in the whole satellite data period.
Incidentally, If we take the average of UAH and RSS on a monthly basis, then calculate the average yearly temperature,
…
2016 is COOLER than 1998, anomalies as shown
1998… 0.515℃
2016… 0.425℃
Ignore previous 5am calculation.. I goofed !!
difference is +0.016℃ since error is stated as ±0.1℃
that means NO WARMING in 18 years.
Case closed, sop.
“2016 was the hottest year on record and beat 1998 by a wide margin”
More total BS from sop.
STOP LYING !!!
And guess what, sop.
TTT having more warming than TLT shows that more heat is escaping to the upper atmosphere.
OOPS !!
Mears has just DESTROYED the CO2 as a blanket myth. 🙂
You’re being shoddy with data, sod.
Artic news has all the info on what’s happining. Jet stream snaking crazy. 10 years left. And remember they are Geoengineering like crazy everywhere and u know what happens when the gov’s try to fix. It’s extinction plain and simple. Explain away but it’s happening and faster till the big methane burp then goodby.
Trees all dying here in n Wisconsin along with incect world from nano aluminum they spray. Good luck
I think you need help. Artic news? What have heavy goods vehicles to do with this??
THE COMING GLOBAL FREEZE: THE PROPHECY OF JOB
https://plus.google.com/u/0/105145231558561205947
THE BIG FREEZE
https://www.youtube.com/watch?v=VAeHvIEjy_4&t=1s
Just sayin’
[…] North America and Europe are experiencing record cold weather. The North Atlantic Ocean has been rapidly cooling since the […]