The sun in January 2017, and: a “pause” or not?
By Frank Bosse and Fritz Vahrenholt
Translated/condensed by P Gosselin)
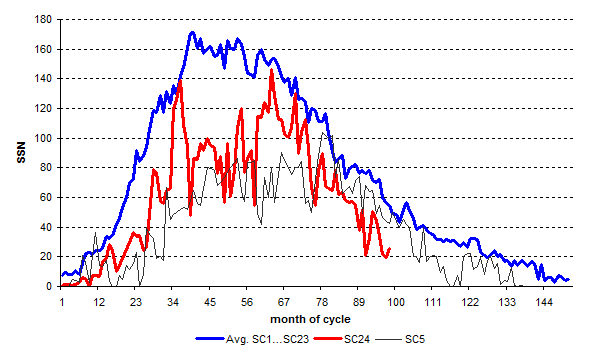
In the previous month our sun was very quiet. A month earlier there had been little activity at first, but then picked up some later in the month. On average the sunspot number SSN was 25.8, which was 47% of what is normal 97 months into the cycle – calculated from the previous 23 solar cycles. 
Figure 1: The monthly activity of solar cycle 24 since December 2008 (red) compared to the mean solar cycles 1-23 (blue) and the very similar SC 5 (black).
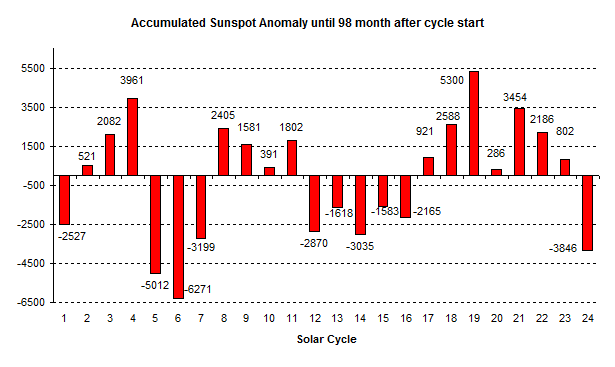
A comparison to solar cycle 5 (the second weakest solar cycle so far) shows that the current cycle has been much weaker over the past 23 months. Indeed during this particular period no solar cycle was ever as weak as solar cycle 24 now is. An overall comparison of the activity of all solar cycles, 98 months in, is as follows:

Figure 2: A comparison of all observed solar cycles. SC 24 is safely in 3rd place for low activity. Cycle No. 19 (1954…1964) had 2.5 times more sun pots than the current cycle thus far.
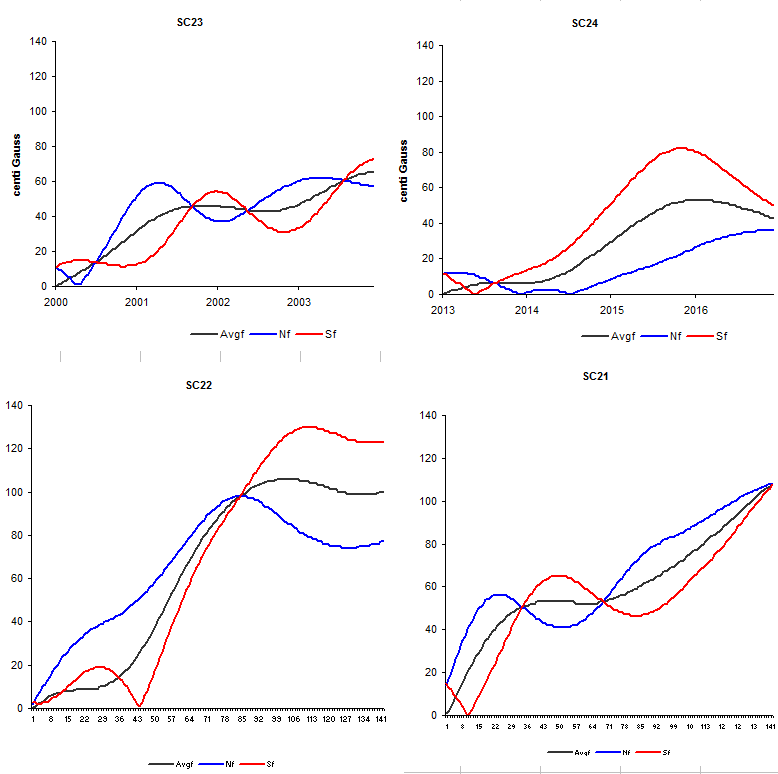
In our last solar report we wagered a look into the future by looking at the gradually growing solar polar fields. The fundamental data has been corrected slightly downwards (a normal quality management step) and we wish to present here once again the updated comparison of all the cycles for this observed magnitude:

Figure 3: The polar fields of solar cycles 21…24 (clockwise) each up to 1400 days after the zero-point (black) for the sun’s southern pole (red) and of the northern pole (blue).
We’ve already seen the maximum on average. You’ll find the best website here when it comes to solar data. The behavior of SC 24 is so far very remarkable!
Pause or no pause?
A controversy erupted in early February: A retired former NOAA employee – John Bates – wrote in a lengthy post at Judith Curry’s blog about how NOAA head Tom Karl used unclean data in a study from the year 2015. The study supported the position that a “pause”, i.e. a considerably slower rise in global temperature after 1997, hadn’t occured. A rather tumultuous quarrel then ensued, as the claims made by John Bates have since been refuted. Fuel was added to the topic, when an article appearing in the “Mail on Sunday”, which contained some inaccuracies.
Apparently whistle blower John Bates had found some NOAA data quality management deficiencies. First it was determined that a computer program that had been used to compute the temperature was lost and thus the calculations were no longer reproducible. The study had a huge impact on the political discussion during the run-up to the Paris Climate Treaty. Bates later stated that data manipulation could not be shown.
In the course of this heated discussion, a new “official” sea surface temperature series dubbed ERSSTv5 was released. Here a small part of the warming of the previous series was recalculated beginning in the year 2000. A great amount of controversy has swirled about the new series, so it is important to keep the focus on where it really counts.
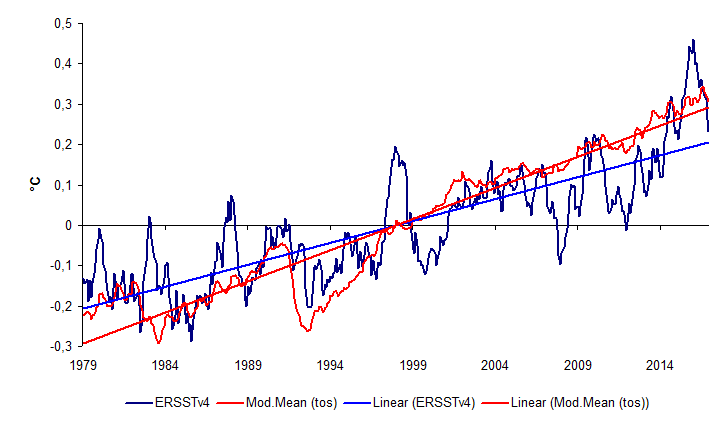
All decisions made today are based on models from the IPCC AR5. Let’s compare what the models projected to the the ERSSTv4 series – the current warming of the global ocean surface:

Figure 4: Comparison of ERSSTv4 series (blue) to the model mean 1979…2016 (red).
The global trend of the temperatures for the ocean surface is over 70% too high!
ERSSTv4 shows 0.109°C per decade warming while the model is far more generous, showing 0.154°C/decade over the time period 1979-2016.
Here it has to be taken into account that in the real world an El-Nino occurred at the end of the measured period, which skews the trend upwards. In two or three years the deviation between the real world and the model world will grow. The models are calculating excessive warming and overstating the effect by CO2. That is the core of the truth that you can take away from this.


Sun spot activity is obviously controlled by CO2 levels on planet Earth.
Research grant please.
None of the plots have come through (at any rate not on my firefox browser).
It is difficult to assess this article without seeing the plots/figures referred to.
All the plots are viewable on mine (Apple Safari). Might want to try another browser….
[…] The failure of the models, however, establishes the criminal motive for the fraudulent data manipulations. The entire basis of funding for climate “science,” is dependent upon man-made or anthropogenic CO2 being the cause of the warming temperatures. If CO2 isn’t the cause, there is no basis for a carbon tax. CO2 is simply the Witch that has to be burned, or else the entire facade comes crashing down to expose a CO2 emperor that has no clothes. […]
@ ‘CO2 is Life’
Indeed. If human-caused CO2 is NOT the Bringer of Doom then the ENTIRE agw gravy train – from climate science to renewables to research and beyond (plus the media circus that surrounds it) comes to a juddering halt. Hence it must remain public enemy no.1. C’mon president Trump, nail this lie once and for all. The End cannot come soon enough.
” Trump, nail this lie once and for all. The End cannot come soon enough.”
you mean, like he “nailed2 the birther lie?
Trump is the source of lies, never their end.
Climate change was in invented by China? NO, it was not.
You have to look at the context. He said it in a sarcastic, tongue in cheek way.