Natural Variability Dominates Climate
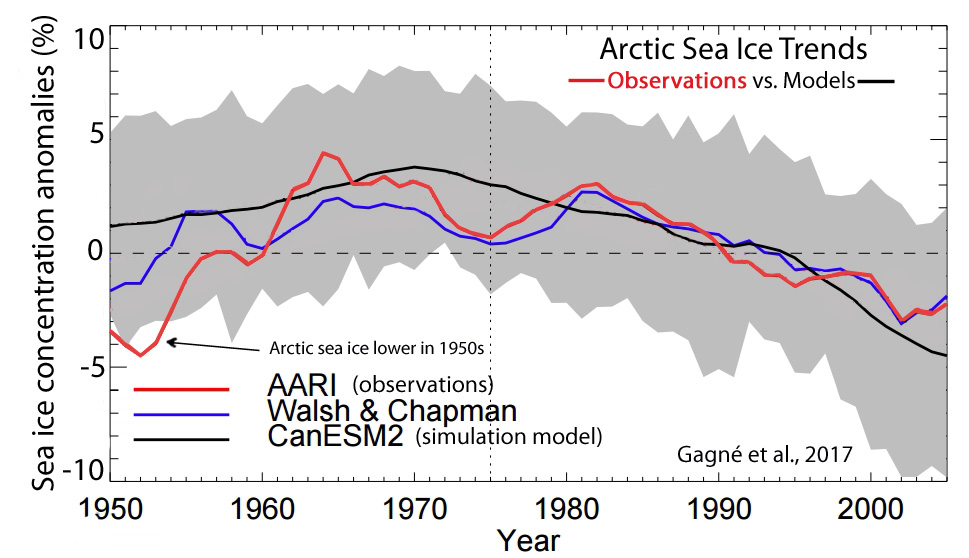
Last week, the newly published Gagné et al. (2017) paper received some attention because the authors pointed out that Arctic sea ice grew substantially between 1950 and 1975, consistent with the in-phase cooling trend during that period.
Gagné et al., 2017 “Updated observational datasets without climatological infilling show that there was an increase in sea ice concentration in the Eastern Arctic between 1950 and 1975, contrary to earlier climatology in-filled observational datasets that show weak inter-annual variations during that time period.”
The AARI [Arctic and Antarctic Research Institute] and Walsh & Chapman sea ice data sets used in the paper (see graph above) included exclusively observational evidence — “climatological infilling were not included … we only used observed data”. Both observational data sets indicated that Arctic sea ice concentration anomalies were as low or lower in the early 1950s than they have been during recent decades.
During the early 1950s, CO2 concentrations hovered between 310 and 315 ppm. Today, atmospheric CO2 has reached 400 ppm. And yet early 1950s sea ice extent was similar to or lower than today. This would imply that the Arctic sea ice recession observed in recent decades is well within the range of natural variability, or within the range of what has occurred without human interference or high rates of anthropogenic CO2 emissions.
In the recently published scientific literature, distinguishing between a presumably human-caused influence on climatic trends and natural or internal variability (or “noise”) has not only become more and more difficult, scientists are increasingly pointing out that an anthropogenic signal in climate trends “has yet to be detected above the level of natural climate variability.”
In addition to the more than 20 new scientific papers affirming a robust connection between solar forcing and climate already published in 2017, there are another new 20 scientific papers that indicate natural variability and/or natural oceanic/atmospheric oscillations (ENSO, NAO, PDO) dominate as modulators of precipitation, temperature/climate, and sea level/flooding.
Natural Variability, Ocean Cycles Dominate And Modulate Precipitation Patterns
1. Lachniet et al., 2017 “[M]onsoon dynamics appear to be linked to low-frequency variability in the ENSO and NAO, suggesting that ocean-atmosphere processes in the tropical oceans drive rainfall in Mesoamerica. … Climate model output suggests decreasing rainfall as a consequence of anthropogenic greenhouse gas radiative forcing (Rauscher et al., 2008; Saenz-Romero et al., 2010). Our data show, however, that the response of the monsoon will be strongly modulated by the changes in ENSO and the NAO mean states … Our data also show that the magnitude of Mesoamerican monsoon variability over the modern era when the anthropogenic radiative forcing has dominated over solar and volcanic forcings (Schmidt et al., 2012) is within the natural bounds of rainfall variations over the past 2250 years. This observation suggests that if anthropogenic forcing has impacted the Mesoamerican monsoon, the signal has yet to be detected above the level of natural climate variability, and the monsoon response to direct radiative forcing and indirect ocean-atmosphere forcings may yet to be fully realized.”
2. Conroy et al., 2017 “20th century precipitation variability in southern Tibet falls within the range of natural variability in the last 4100 yr, and does not show a clear trend of increasing precipitation as projected by models. Instead, it appears that poorly understood multidecadal to centennial internal modes of monsoon variability remained influential throughout the last 4100 yr. … Until we have a predictive understanding of multidecade to multi-century variability in the Asian monsoon system, it would be wise to consider the risk of prolonged periods of anomalously dry and wet monsoon conditions to be substantial (Ault et al., 2014). Such variability may also explain why the predicted anthropogenic increase in Asian monsoon precipitation is not widely observed.”
3. Bianchette et al., 2017 “Seven periods of increased water level, varying in duration, occurred during the backbarrier period, with El Niño-Southern Oscillation (ENSO) likely the main climatic mechanism causing these periodic shifts in the paleo-precipitation levels. We suggest that the deepest water levels detected over the last ~3200 years correlate with periods of increased ENSO activity.”
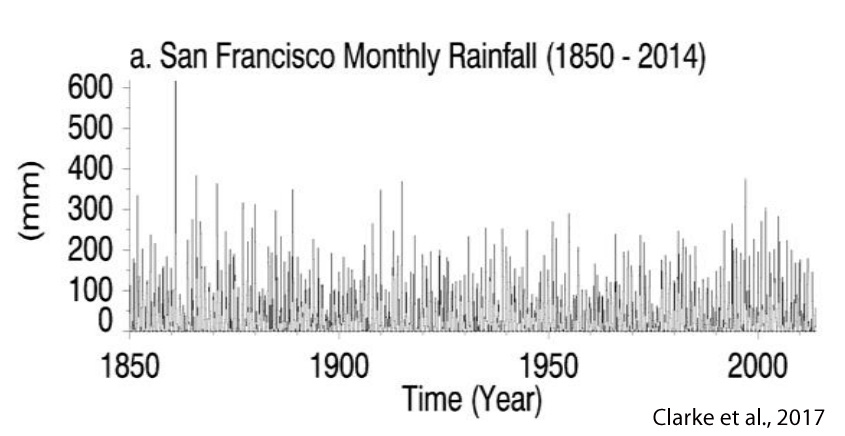
4. Clarke et al., 2017 “Corresponding ~4-8 year periodicities identified from Wavelet analysis of particle size data from Pescadero Marsh in Central Coast California and rainfall data from San Francisco reflect established ENSO periodicity, as further evidenced in the Multivariate ENSO Index (MEI), and thus confirms an important ENSO control on both precipitation and barrier regime variability.”
5. Valdés-Pineda et al., 2017 “This study analyzes these low-frequency patterns of precipitation in Chile (>30 years), and their relationship to global Sea Surface Temperatures (SSTs), with special focus on associations with the Pacific Decadal Oscillation (PDO) and the Atlantic Multi-decadal Oscillation (AMO) indices. … We conclude that a significant multi-decadal precipitation cycle between 40 and 60 years is evident at the rain gauges located in the subtropical and extratropical regions of Chile. This low-frequency variability seems to be largely linked to PDO and AMO modulation.”
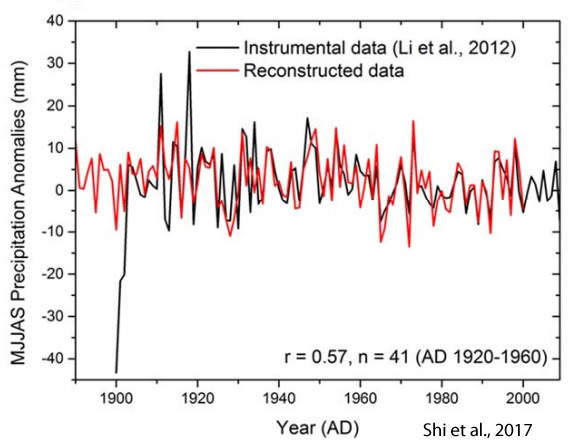
6. Shi et al., 2017 “Five of the six coupled ocean-atmosphere climate models of the Paleoclimate Modeling Intercomparison Project Phase III (PMIP3), can reproduce the south-north dipole mode of precipitation in eastern China, and its likely link with ENSO. However, there is mismatch in terms of their time development. This is consistent with an important role of the internal variability in the precipitation field changes over the past 500 years.”
Natural Variability, Ocean Cycles Dominate And Modulate Temperature, Climate
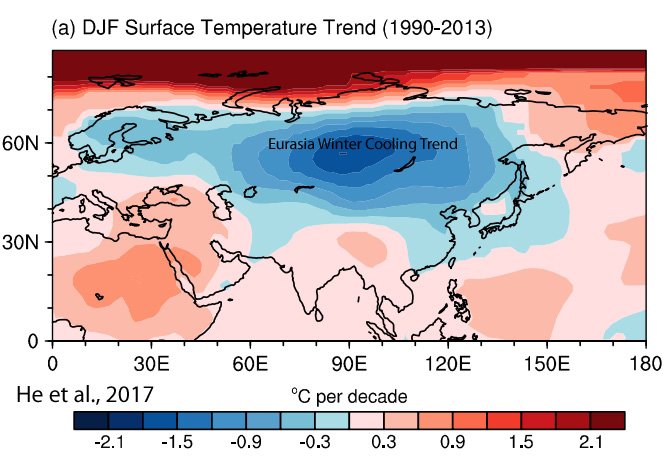
7. He et al., 2017 “As pointed out by Cohen et al. (2014), continental winter SAT [surface temperature] trends since 1990 exhibit cooling over the midlatitudes. The negative trends extend from Europe eastward to East Asia, with a center of maximum magnitude to the west of the Baikal. As reviewed above, the AO/NAO [Arctic Oscillation/North Atlantic Oscillation] shows an in-phase relationship with the SAT [surface temperatures] over Eurasia. … [T]he negative trend in the AO/NAO might explain the recent Eurasian winter cooling. … Additionally, the relationship between the winter AO and surface-climate anomalies in the following spring might be modulated by the 11-year solar cycle (Chen and Zhou, 2012). The spring temperature anomalies in northern China related to the previous winter AO were larger and more robust after high solar cycle winters. However, spring temperature anomalies became very small and insignificant after the low solar cycle winters. … Numerous atmospheric scientists have documented that the AO could impact significantly the climate over Europe and Far East. … It is evident that a positive winter AO causes warmer winters over East Asia through enhancing Polar westerly jet which prevents cold Arctic air from invading low latitudes“
8. Muñoz et al., 2017 “Temperature and humidity display rapid and significant changes over the Holocene. The rapid transition from a cold (mean annual temperature (MAT) 3.5°C lower than today) and wet Younger Dryas to a warm and dry early Holocene is dated at 11,410 cal yr BP. During the Holocene, MAT [mean annual temperature] varied from ca. 2.5°C below to 3.5°C above present-day temperature. Warm periods (11,410, 10,700, 9700, 6900, 4000, 2400 cal yr BP) were separated by colder intervals. The last 2.4 kyr of the record is affected by human impact [on the pollen proxy record]. The Holocene remained dry until 7500 cal yr BP. Then, precipitations increased to reach a maximum between 5000 and 4500 cal yr BP. A rapid decrease occurred until 3500 cal yr BP and the late Holocene was dry. … The highest rainfall intervals correlate with the highest activity of ENSO. Variability in solar output is possibly the main cause for this millennial to decadal cyclicity. We interpret ENSO [El Niño-Southern Oscillation] and ITCZ [Intertropical Convergence Zone] as the main climate change-driving mechanisms in Frontino. … From ca. 8000 cal yr BP, climate in both areas was under the dual influence of ENSO and ITCZ, thereby showing existing teleconnections between the tropical Pacific and Atlantic oceans.”
9. Park et al., 2017 “According to our results, the central Mexican climate has been predominantly controlled by the combined influence of the 20-year Pacific Decadal Oscillation (PDO) and the 70-year Atlantic Multidecadal Oscillation (AMO). However, the AMO probably lost much of its influence in central Mexico in the early 20th century and the PDO has mostly driven climate change since.”
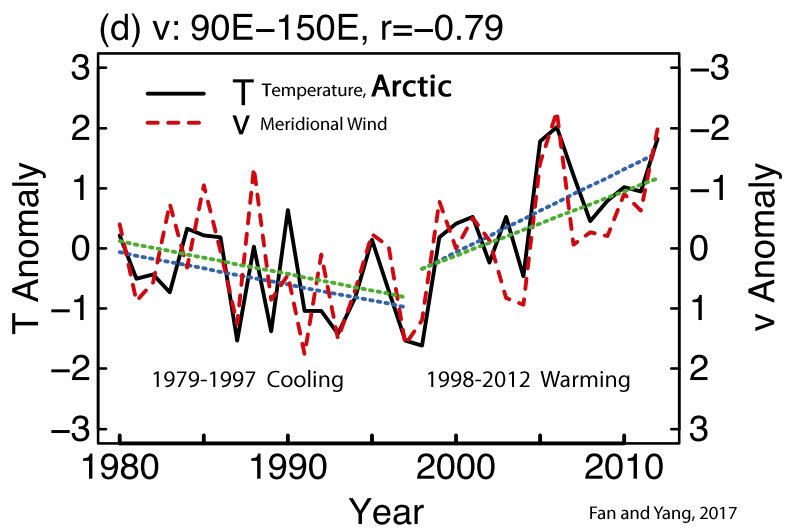
10. Fan and Yang, 2017 “The wintertime Arctic temperature decreased from 1979 to 1997 and increased rapidly from 1998 to 2012, in contrast to the global mean surface air temperature [which] increased between 1979 and 1997, followed by a hiatus … A recent study suggests a possible role of the Pacific Ocean decadal oscillation in regulating wintertime climate in the Arctic (Screen and Francis 2016). … The ‘‘greenhouse effect’’ of water vapor and clouds may amplify the effect of winds on Arctic winter climate. [CO2 not mentioned as contributing to the GHE] … The objectives of this study are to assess how much natural–internal variability has contributed to climate changes in these [Arctic] regions from 1979 to 2012 … In summary, the correlation analyses presented in this paper shows a natural mode of Arctic winter variability resulting from the Nordic–Siberian seesaw of meridional winds […] is associated with two-thirds of the interannual variance of winter-mean Arctic temperature between 1979 and 2012, and possibly contributed a substantial fraction of the observed Arctic amplification [1998-2012 warming] in this period.”


Thank for the link to the first paper about the arctic. It is very good:
“Hence, without
the influence of anthropogenic aerosols forcing, the natural forcings alone could not have
overwhelmed the greenhouse gases forcing to yield the positive trend in sea ice extent
between 1950 and 1975, as demonstrated in Figures 4 and 5.”
(pdf page 12, there is no pay wall. I urge everyone to read that paper!)
Sorry, sod, but the scientific literature is replete with evidence that says anthropogenic aerosols constitute but a negligible fraction (~10% or less) of aerosol forcing. The authors of the Arctic sea ice paper, in their earnest attempts to link global cooling to humans, have decided to ignore this evidence…as have you. This seems to be a pattern.
As for providing you with a link to a paper that shows there has been no net change in Arctic sea ice in the last 70 years despite an additional 80 ppm CO2 added to the atmosphere, you are quite welcome. I’m not sure how well this fits with your beliefs about CO2 driving Arctic sea ice trends, though. It would instead appear to undermine them.
—
http://onlinelibrary.wiley.com/doi/10.1002/grl.50263/abstract
“We employ model runs that include the increases in anthropogenic sulfur dioxide (SO2) over Asia and the moderate volcanic explosive injections of SO2 observed from 2000 to 2010. Comparison of the model results to observations reveals that moderate volcanic eruptions, rather than anthropogenic influences, are the primary source of the observed increases in stratospheric aerosol.”
—
http://www.atmos-chem-phys.net/13/10405/2013/acp-13-10405-2013.pdf
“The increase in the stratospheric aerosol concentration observed in the past years is caused mainly by sulfur dioxide from a number of volcano eruptions. Variation of the concentration is mainly due to volcanoes. Lower stratospheric variability of SO2 could mainly be explained by volcanic activity and no hint for a strong anthropogenic influence has been found.”
—
http://journals.ametsoc.org/doi/pdf/10.1175/1520-0469%281973%29030%3C0101%3AOALDFM%3E2.0.CO%3B2
“ [T]he anthropogenic component of the global particulate burden of the atmosphere amounts to 5-12%“
—
http://www.tandfonline.com/doi/pdf/10.1080/00022470.1975.10470118
“The aerosols in the atmosphere consist of man-made and natural particles … the man-made contribution on a global scale is quite small; estimates range from a negligible amount to about 6% of the natural background.”
—
http://journals.ametsoc.org/doi/pdf/10.1175/1520-0493%281980%29108%3C1430%3ATIATAT%3E2.0.CO%3B2
“The trends in [anthropogenic] atmospheric transmission at the three locations examined in this paper are very small, perhaps nonexistent, and generally not statistically significant. … [T]here is no evidence for an increase in anthropogenic aerosols on a global scale and hence they are unlikely to be important climatically.”
—
http://link.springer.com/chapter/10.1007/978-94-010-3290-2_15
“[V]ariations of human-derived loading are an order of magnitude [ten times] less than those of volcanic dust loading. … Although changes of total atmospheric dust loading may possibly be sufficient to account for the observed 0.3°C-cooling of the earth since 1940, the human-derived contribution to these [aerosol] loading changes is inferred to have played a very minor role in the temperature decline.”
—
http://www.osti.gov/scitech/servlets/purl/7273062/#page=54
“It is estimated that man now contributes 13.6% of the 3.5 x 10⁹ tons of primary and secondary particulates presently emitted to the atmosphere annually.”
—
http://ruby.fgcu.edu/courses/twimberley/EnviroPhilo/Aerosols.pdf
“With particular regard to the recent cooling trend of worldwide climate, the attribution of this cooling (or any significant part of it) to secular increases in atmospheric particles from human activities now appears unlikely, not merely on quantitative grounds but on qualitative grounds as well. … [T]he observed climatic cooling of the past quarter century emerges more persuasively than ever as a natural geophysical phenomenon, with man the innocent bystander.”
—
http://www.ganino.com/games/Science/science%20magazine%201980/root/data/Science%201980/pdf/1980_v207_n4435/
“Since the measured values of direct solar radiation decreased about 5 percent during the 1945 to 1975 … From 1945 to 1970, the annual eruption numbers roughly doubled from 16 to 18 per year to 37 to 40 per year. During the same interval, the aerosol optical depth also roughly doubled.”
The data from the paper ends in 2005. we have lost a volume of another 5000 km³since then.
http://psc.apl.uw.edu/wordpress/wp-content/uploads/schweiger/ice_volume/BPIOMASIceVolumeAnomalyCurrentV2.1.png
the paper is modelling all sorts of forcings. the best explanation is CO2 causing the loss of ice and aerosols explaining the added ice. facts.
According to NSIDC data, there has been a pause in Arctic sea ice loss since 2006:
http://www.woodfortrees.org/plot/nsidc-seaice-n/from:2006/to:2017/plot/nsidc-seaice-n/from:2006/to:2017/trend/plot/nsidc-seaice-n/from:1990/to:2006/plot/nsidc-seaice-n/from:1990/to:2006/trend
So if CO2 is the best explanation for the periods of sea ice decline (1930s and 1940s, 1990s-2010s), why was sea ice just as low or lower during the 1950s, when CO2 concentrations were 310 to 315 ppm?
Or why was sea ice lower during the 1700s and 1800s than now, when CO2 levels were in the 270s ppm?
https://notrickszone.com/wp-content/uploads/2016/11/NTZ-Arctic-Sea-Ice-Late-Holocene-Human-Influence.jpg
And if volcanic aerosols caused the cooling between 1950 and 1975 (since it is well known that anthropogenic aerosols account for perhaps 1/10th of the aerosol forcing relative to volcanic eruptions), would the lower frequency of volcanic eruptions since the 1970s have contributed to the warming? Or does natural variability only cause cooling, and never warming, because the latter doesn’t fit the paradigm you espouse?
What caused the Arctic to be ice-free during the summers during the Early Holocene, sod, when CO2 levels were in the 260 ppm range at that time?
“the best explanation is CO2 causing the loss of ice”
ROFLMAO.. another sob zero-thought-bubble.
Interesting facts! But why does the first diagram (Gagné et sl 2017) stop at 2005?
You would likely need to ask the authors, but since 2006, there has been a pause in Arctic sea ice losses:
http://www.woodfortrees.org/plot/nsidc-seaice-n/from:2006/to:2017/plot/nsidc-seaice-n/from:2006/to:2017/trend/plot/nsidc-seaice-n/from:1990/to:2006/plot/nsidc-seaice-n/from:1990/to:2006/trend
So the overall trend for 2005 would be similar if extended through 2016…and the 1950s had similar sea ice loss compared to the last 10 years. So there has been no significant net change in sea ice loss since the early 1950s according to observations — despite 85 ppm of additional CO2 stoked to the atmosphere.
Very obviously not much happening if you look at the trend since 2006.
https://s19.postimg.org/umq1x3h4j/Arctic_ice_area_trend.png
Matches well with the flattish top of the AMO.
The wobbly jet stream causing the “less cold” anomaly over Franz Joseph region has held it back from starting to climb back up this year, but if we have a less weather disturbed year next year, the dropping AMO should start to kick in gradually. Sea temps in North Atlantic have already dropped quite a bit.
And to anyone that thinks this current Jet Stream wobble is “unprecedented”
https://s19.postimg.org/tz51q2mpf/jetstream_1977.gif
At that was just around the time of the recent peak in the Arctic sea ice extent.
A pause? Really? The decrease of the extent in the summer months has not paused, 2012 being a particular low point in Artic sea ice extent and 2017 being a year with record low Antartic sea ice extent.
Data shows you to be a LIAR, as usual.
https://s19.postimg.org/umq1x3h4j/Arctic_ice_area_trend.png
The difference between years is totally insignificant and are totally weather related.
You KNOW that.. yet you continue to push your scamming alarmism.. That is cultish to say the least.
Its going to be funny watching you RUN and HIDE next year, with no large El Nino, no Jet Stream weather carrying to freezing cold to northern Russia while causing very minor slowing of ice growth in the Svalbard, and AMO turning down as well.
Why do you totally ignore the full effects of the Jet Stream weather pattern, causing much hardship and suffering in northern Russia? .. some sort of sick hatred of humans and love of empty sea ice ???
And why do you DENY the facts that show 1979 was an extreme, 1950 was probably about the same as now, and pre-LIA was often summer ice free.
What does it gain for you to be wilfully ignorant except a PETTY child-minded surge of vain ego-boost?
NSIDC Arctic Sea Ice Pause
Every day, little by little, SebastianH learns something new. What are you guys going to do when the NAO fully shifts back to 1960s-1990s cooling and sea ice growth? The North Atlantic is already cooling.dramatically. The Arctic is next.
https://www.jstage.jst.go.jp/article/sola/6A/SpecialEdition/6A_SpecialEdition_1/_pdf
Since the decadal variation of the AO is recognized as the natural variability of the global atmosphere, it is shown that both of decadal variabilities before and after 1989 in the Arctic can be mostly explained by the natural variability of the AO not by the external response due to the human activity.
—
http://eae.sagepub.com/content/22/8/1069.abstract
Arctic Warming is Not Greenhouse Warming
After two thousand years of slow cooling Arctic, warming suddenly began more than a century ago. It has continued, with a break in the middle, until this day. The rapid start of this warming rules out the greenhouse effect as its cause. Apparently the time scale of the accumulation of CO2 in the air and the Arctic warming does not match. It is likely that the cause of this warming was a relatively sudden rearrangement of the North Atlantic current system at the turn of the century that directed warm currents into the Arctic Ocean. All observations of Arctic warming can be accounted for as consequences of these flows of warm water to the Arctic. This explains why all attempts to model Arctic warming have failed: Models set up for greenhouse warming are the wrong models for non-greenhouse warming.
—
http://www.pnas.org/content/112/15/4570.full
Introduction: Observations reveal multidecadal variations in Arctic surface air temperature (SAT), and amplified Arctic warming similar to that observed in recent decades also occurred during 1930–1940. Both observations and climate modeling results suggest that the reduced Arctic sea ice is crucial for the early twentieth century Arctic warming, and internal variability is a very likely cause for that event.
Discussion: The estimated increase in the Atlantic heat transport into the Arctic since 1979 is consistent with the strengthening of AMOC since the mid 1970s implied by indirect evidence such as the AMOC fingerprints, and could have contributed substantially to the observed summer Arctic SIE decline.
—
http://www.dmi.dk/fileadmin/Rapporter/SR/sr05-02.pdf
We also look at the approximately 80 year variability of the Koch [sea ice] index and compare it to the similar periodicity found in the solar cycle length, which is a measure of solar activity. A close correlation (R=0.67) of high significance (0.5 % probability of a chance occurrence) is found between the two patterns, suggesting a link from solar activity to the Arctic Ocean climate.
—
http://onlinelibrary.wiley.com/doi/10.1029/2006GL027817/abstract
[A]tmospheric CO2 lags, or is at most synchronous with, dV/dt. In other words, variations in melting precede variations in CO2. Thus, the relatively small amplitude of the CO2 radiative forcing and the absence of a lead over dV/dt both suggest that CO2 variations play a relatively weak role in driving changes in global ice volume compared to insolation variations.
—
http://www.nature.com/nature/journal/v509/n7499/full/nature13260.html
Here we show that the recent warming in this region is strongly associated with a negative trend in the North Atlantic Oscillation, which is a response to anomalous Rossby wave-train activity [planetary waves related to the Earth’s rotation] originating in the tropical Pacific. … [P]rescribed anthropogenic forcing show no similar circulation changes related to the North Atlantic Oscillation or associated tropospheric warming. This suggests that a substantial portion of recent warming in the northeastern Canada and Greenland sector of the Arctic arises from unforced natural variability.
You are cherrypicking your data.
Look here for example:
http://nsidc.org/arcticseaicenews/files/2017/02/monthly_ice_01_NH_v2.1.png
people were completely unable to measure arctic sea ice in 1950. It was impossible back then.
Most likely they were measuring something that would have shown a major change with the loss in volume.
http://psc.apl.uw.edu/wordpress/wp-content/uploads/schweiger/ice_volume/BPIOMASIceVolumeAnomalyCurrentV2.1.png
Says the same person who links to a graph that cherrypicks exactly 1 month out of the year and ignores the other 11 months of the year. Does CO2 concentrations only work in January, sod, when the Arctic is completely devoid of sunlight? How, exactly, does CO2 trap the Sun’s radiation at the surface when there is no sunlight during DJF, sod?
http://www.woodfortrees.org/plot/nsidc-seaice-n/from:2006/to:2017/plot/nsidc-seaice-n/from:2006/to:2017/trend/plot/nsidc-seaice-n/from:1990/to:2006/plot/nsidc-seaice-n/from:1990/to:2006/trend
The graph that I linked to (above), using NSIDC data, shows every single month of the year for the decreasing years (1990-2006) and pause years (2006-2017). It doesn’t cherry-pick one month.
How convenient that would be for you, wouldn’t it, sod? That way you could pretend that the 1920-1950 sea ice recession…
https://notrickszone.com/wp-content/uploads/2016/11/Arctic-Sea-Ice-1920-1975.jpg
… didn’t happen, making the 1990-2006 recession “unprecedented”.
Kenneth,
http://www.woodfortrees.org/plot/nsidc-seaice-n/from:2006.6/to:2017/every:12/plot/nsidc-seaice-n/from:1980.6/to:2006.6/every:12
You can do this for every month. I was not talking about the average … on average it is pretty cold in the Artic, but the month with the lowest sea ice extent is getting warm enough to melt more and more ice.
That’s the records I was writing about.
P.S.: I am learning something everyday … not resistent to new information as you guys seem to be.
Got to http://ocean.dmi.dk/arctic/meant80n.uk.php
The period above freezing has hardly budged since 1958
In fact 2013, 2014 had some of the shortest periods above freezing of the whole record.
Also , since 1995, September UAH NoPol Ocean temperatures trend downwards.
https://s19.postimg.org/vi0fv1t9v/UAH_Sep_Nopol_temperature_trend.png
Oops… seb stuffs up with an unproven zero-thought-bubble yet again.
Seb should be getting well and truly used to being totally unable to prove a single piece of the AGW scam he has hooked his feeble life onto.
Thank you for the link, AndyG55 … this could have almost been a reasonable comment if you would have stopped two paragraphs earlier.
Do you really think that sea ice is melting because the air temperatures are a few degrees above freezing for a few days a year? And do you really think that your graph somehow invalidates a graph about the sea ice extent?
http://ocean.dmi.dk/arctic/icecover_30y.uk.php
http://ocean.dmi.dk/arctic/climatology_v2/extent.uk.php
Sea ice extent is about the same this year as it has been for the last ten years.
Zero trend since 2006
I see you are STILL denying the cycle of the AMO, the cycle of water currents. They have nothing to do with CO2, you know that, don’t you.
Why are you still denying that 1950 was around the same as now
Why are you still denying the Jet Stream WEATHER anomaly that has sent freezing cold temperatures to northern Russia, where people live and have died this year.
Why are you still denying that pre-LIA sea ice levels were far lower than current
Why are you still trying to push the SCAM that there is actually something wrong with the current level of sea ice.
There has to be some reason to your wilful ignorance.
Only thing I can come up with is religious brain-washing.
There is nothing wrong with the current sea ice extent. Shit happens.
Why do you mention the cycle of water currents? You would know that ocean heat content increased by something like 2×10°23 Joules … do you know how much water this would boil if concentrated?
According to RealClimate.org (founded by Michael Mann and Gavin Schmidt, who believe that 110% of warming since 1950 has been caused by humans):
“Ocean heat content has increased by about 2.5 X 10²³ Joules since 1970 (IPCC AR5). What would be the impact of that? The answer is: it depends. If this heat were evenly distributed over the entire global ocean, water temperatures would have warmed on average by less than 0.05 °C (global ocean mass 1.4 × 10²¹ kg, heat capacity 4 J/gK). This tiny warming would have essentially zero impact.”
“There is nothing wrong with the current sea ice extent”… first sensible thing you have said for a long time.
Then you go manic off the deep end..
Wonderland mushrooms kicking in again, hey tweedledum?
Show me where this pittance of whatever number of joules you reckon it is (scary big number for seb) was measured….
… what change would this imaginary number cause in temperature in the world’s oceans?
Maybe on your search for a return to reality you will find a paper showing that CO2 causes warming in a convective atmosphere.
Kenneth & AndyG55,
Good thing there is math … oceans surface area is 3.916×10^14 m², looking at just the first meter below the surface that amounts to 3.916×10^17 liters or kg of sea water.
2.5*10^23 Joules would warm ca. 5.97*10^19 kg of water by 1 degree. That means the first meter would warm by 152.5 degrees with this amount of energy input.
P.S.: An increase of the radiation on the ocean surface by 1 W/m² equals 31536000 Joules per year per m². That’s enough energy to warm the first meter below the surface by 7.5 degrees per year.
So it warms up everywhere else except the surface.. DOH !
Guess what.. the surface hasn’t warmed by 7.5C
Its barely warmed a fraction of a degree out of the LIA, the COLDEST period of the last 10,000 years., and if data hadn’t been adjusted, its probably pretty close to what it was in 1940. What caused the warming before 1940 I wonder. 😉
You are living in Fantasy Land yet again sob, or is it seb, its getting hard to tell the different styles of ignorance apart.
CO2 doesn’t warm ocean water..
that’s the sun’s job…
and you KNOW that.
You just refuse to admit it to yourself.
You still won’t admit to yourself that you can’t provide any scientific evidence that CO2 even warms a convective atmosphere.
The sun is the energy source, correct.
You just have a problem with understanding radiative energy transfers and call it a baseless religion.
Also: when did I write that the surface warmed by 7.5 degrees? I only pointed out that those Joules represent a lot of thermal energy.
roflmao.
Your religion IS baseless.
You have proven time and time and time again that you CANNOT provide a paper that proves CO2 causes warming in a CONVECTIVE atmosphere.
That is the very basis of the AGW religion
and it is drowned in quicksand !!
No two ways about it.
BASELESS. !!
This year is definitely weather related.
The Jet stream has held a “less cold” anomaly over the Franz Joseph/Kara Sea region all year slowing the growth of sea ice in that region
But at the same time it was holding an anomalous cold patch over northern Russia, and causing sweeping extreme cold troughs across northern USA, Canada and Alaska.. . you know, areas where lots of people actually try to live.
You cannot look at one without looking at the other….
….. unless you are a psychopathic AGW scammer.
And you cannot look at one pole’s sea ice extent without looking at the other.
“Interesting facts! But why does the first diagram (Gagné et sl 2017) stop at 2005?”
Kenneth is linking every paper that vaguely claims anything similar to what he thinks is happening.
He does never care, when the proxy data ends and what sort of a misleading impression it gives. Neither does he care, how proxy data compares to what is happening today, measured with better data (the article addresses this point).
Many papers outright refute agw alarmism. Perhaps your side is cherry picking.
Simply choose any ice-core data set you want and test the hypothesis “Temperature Change over the past 50 and 150 years is due to natural causes.” Restrict the analysis to the Holocene. No ice-core data set you will find will reject that null. There in nothing abnormal about the temperature change of the industrial age when compared to the rest of the Holocene.
Smoking Gun #11: The Scientific Method is Ignored, The Null is not Rejected
https://co2islife.wordpress.com/2017/01/17/climate-science-on-trial-the-forensic-files-exhibit-k/
[…] Today it is accepted: the systematic impact of ocean cycles on climate events. The latest example: Meehl et al. from August 2016 in Nature Climate Change: Contribution of the Interdecadal Pacific Oscillation to twentieth-century global surface temperature trends Longer-term externally forced trends in global mean surface temperatures (GMSTs) are embedded in the background noise of internally generated multidecadal variability1. The cycles always pop up with new names, but in the end they are all relatives of the PDO and AMO, which are also coupled with one another with a time lag. Now that this factual basis has become accepted, suddenly there have been a shower of publications. Let’s ignore the past for now and direct our focus instead on the new, improved models. 20 New Papers Affirm Modern Climate Is In Phase With Natural Variability. […]
[…] For example, when the thermostat in your house detects that the temperature is getting too cold, it turns on the furnace to raise the temperature. Feedback mechanisms (or simply “feedbacks,” for short) are grouped into two categories: positive & negative. A positive feedback is one which causes a same-direction response, so it tends to increase (amplify) the effect of a change in input. A common misconception is that positive feedbacks necessarily “run away,” and make a system unstable. Climate feedback mechanisms. 20 New Papers Affirm Modern Climate Is In Phase With Natural Variability. […]
[…] 20 new papers affirm that Modern Climate is in phase with Natural Variability. The Arctic and Antarctic Research Institute used only observational […]
[…] Study: Here is an article claiming that 20 New Papers Affirm Modern Climate Is In Phase With Natural Variability. None of those papers will ever be read by a large number of people. None of those papers will ever […]
[…] Study: Here is an article claiming that 20 New Papers Affirm Modern Climate Is In Phase With Natural Variability. None of those papers will ever be read by a large number of people. None of those papers will ever […]