Hundreds Of Scientific Papers
Challenge ‘Global’ Warming
Recently, an article citing over 80 graphs from scientific papers published in 2017 — and another 55 graphs from 2016 — established that modern “global” warming is not actually global in scale, and that today’s warmth is neither unprecedented or remarkable when considering the larger context of natural variability.
Here, an additional 140 non-hockey stick graphs taken from papers published in 2015 and earlier have now been made available. With this latest installment, graphical temperature reconstructions challenging the conceptualization of global-scale or unprecedented modern warming are rapidly approaching 300.
For those interested in perusing this growing body of scientific evidence all at once, a new page has been added to the NoTricksZone website.
Global Warming Disputed: 300 Graphs

The list is categorized by the year (or decade) of publication. It will be updated as new temperature reconstructions are published or located in the peer-reviewed scientific literature. Perhaps these pages can be used as a resource when challenging those who claim that modern temperatures are unusual, dangerous, or outside the range of natural variability.


Schneider et al., 2015
Stoffel et al., 2015

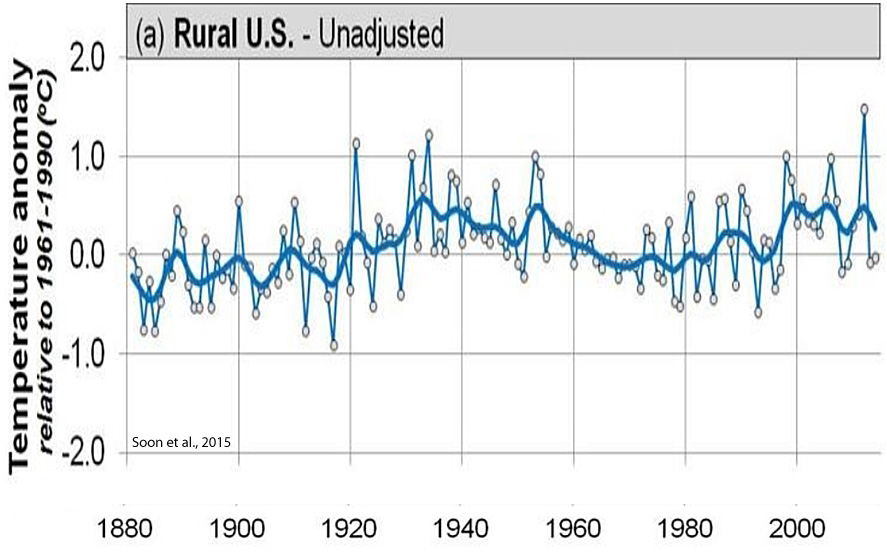
Soon et al., 2015
“[M]ost of the temperature trends since at least 1881 can be explained in terms of solar variability, with atmospheric greenhouse gas concentrations providing at most a minor contribution.”
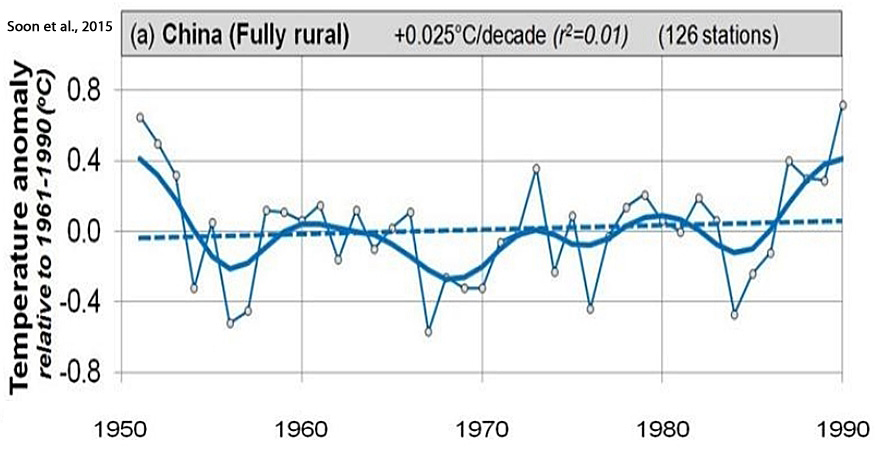
Thapa et al., 2015
“[T]emperature in Central Asia and northern Hemisphere revert back towards cooling trends in the late twentieth century.”
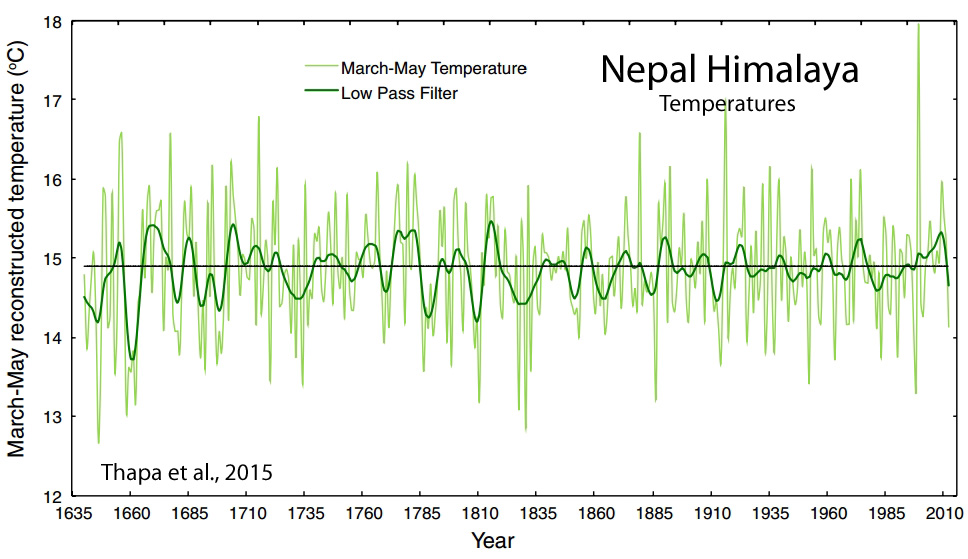
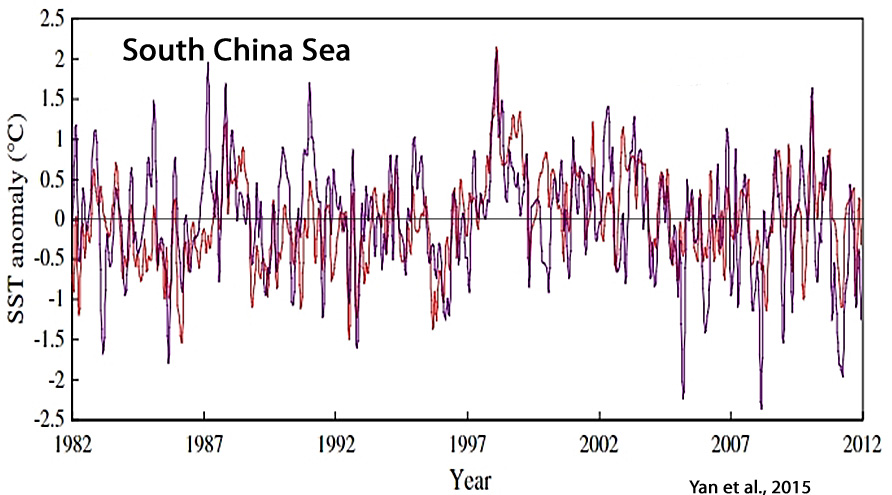
Yan et al., 2015
Boldt et al., 2015
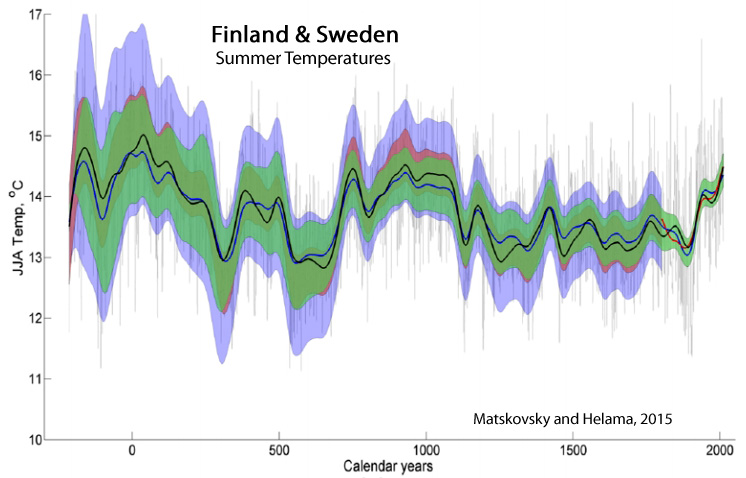
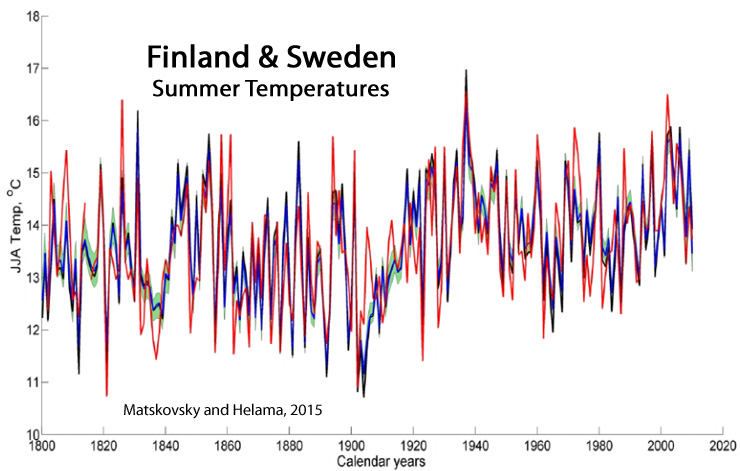
Matskovsky and Helama, 2015
“The DIRECT reconstruction reveals long-term cooling during the LIA [Little Ice Age, 1300-1900 AD] and considerable warming during the MCA [Medieval Climate Anomaly/Medieval Warm Period, 800-1200 AD]. The 20th century marks a period of generally warm temperatures; however, the temperatures of the MCA were reconstructed to be warmer and the long duration of the former makes the MCA incomparable to the 20th-century warmth (Matskovsky and Helama, 2014).”
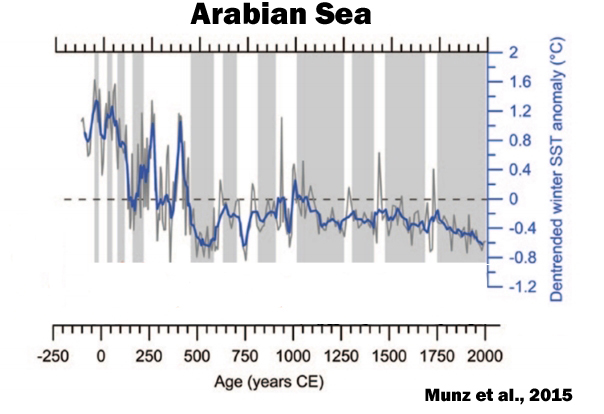
Munz et al., 2015
Wei et al., 2015

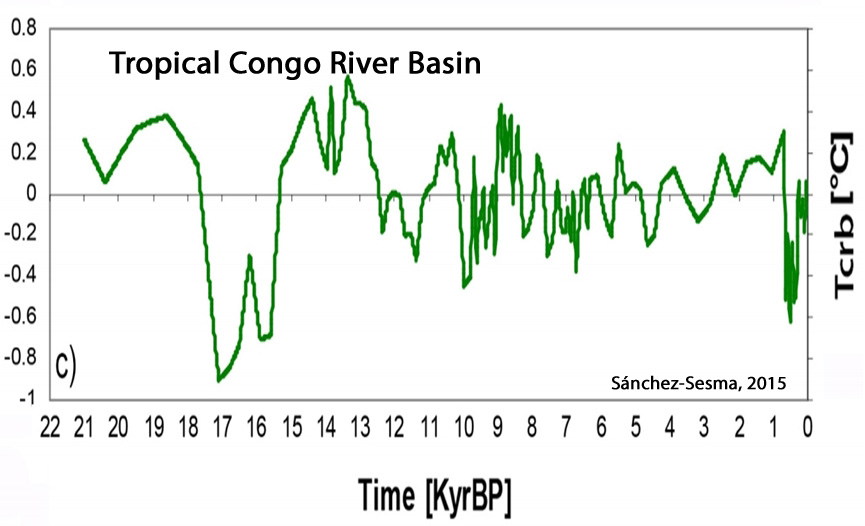
Sánchez-Sesma, 2015
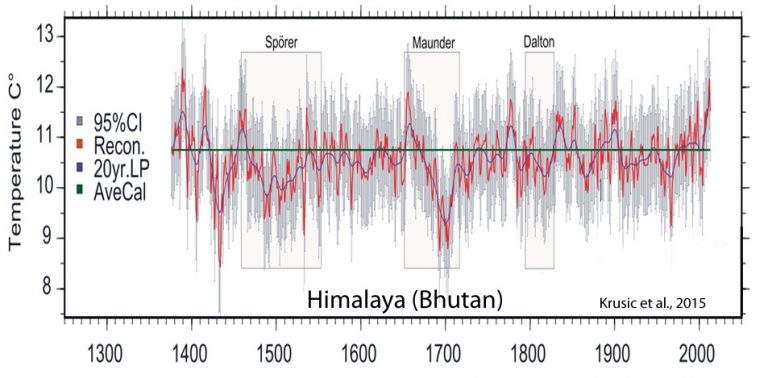
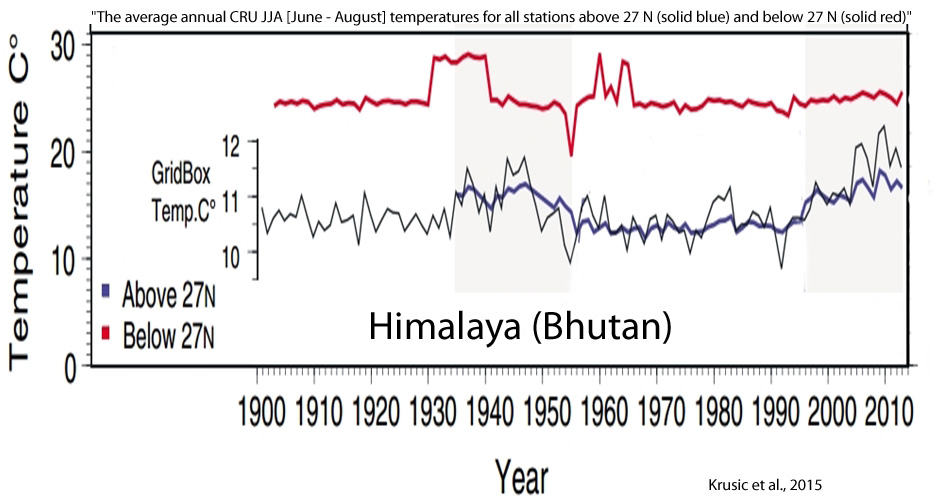
Krusic et al., 2015
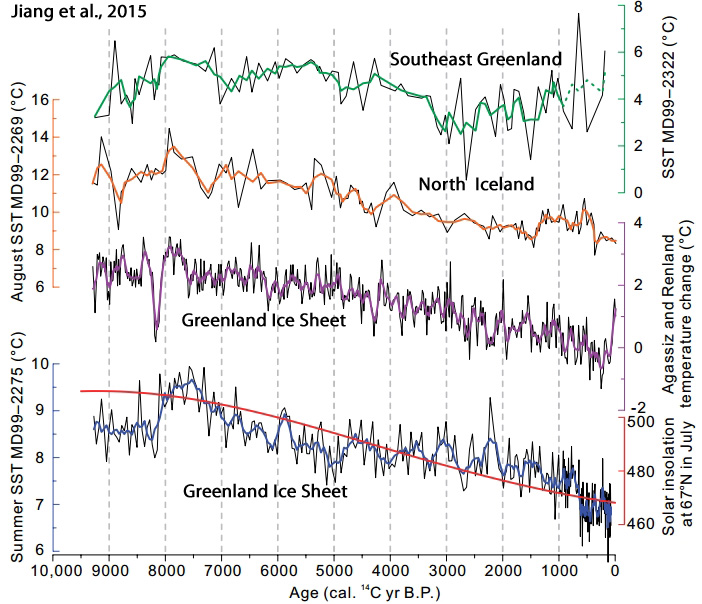
Jiang et al., 2015
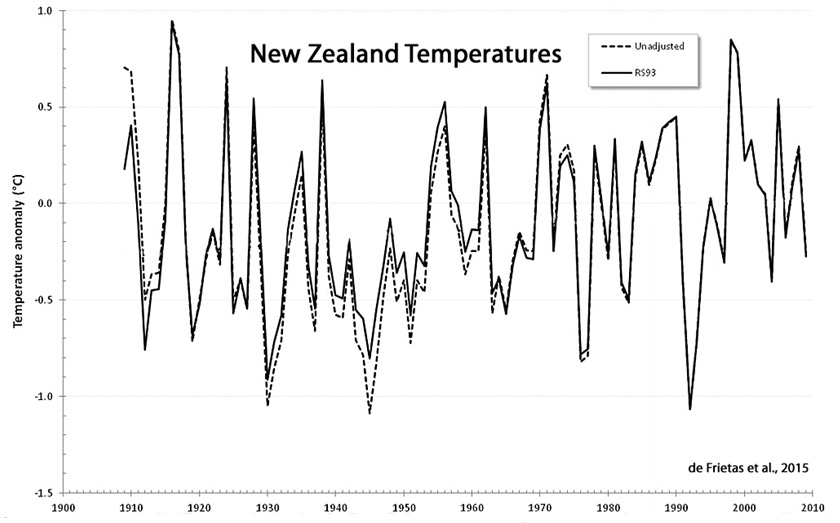
de Frietas et al., 2015
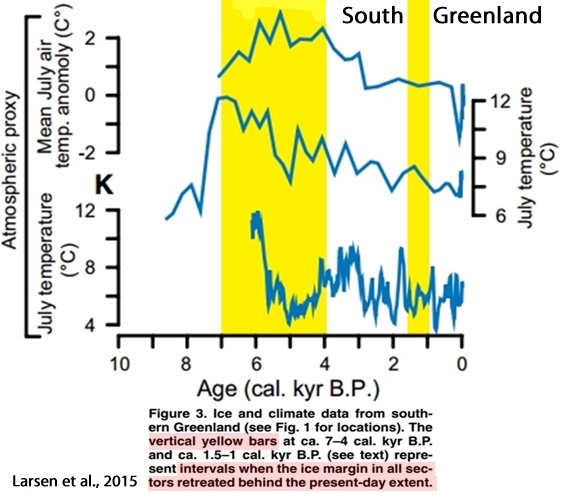
Larsen et al., 2015
“Southern Greenland proxy-inferred atmospheric temperatures also peaked between ca. 7 and 4 cal. kyr B.P. at 2–4 °C higher than present, followed by a Neoglacial cooling reaching a minimum during the LIA [Little Ice Age] (Fréchette and de Vernal, 2009; D’Andrea et al., 2011; Axford et al., 2013). The second phase of ice retreat behind the present-day extent in southwest and south Greenland was from ca. 1.5 to 1 cal. kyr B.P.”
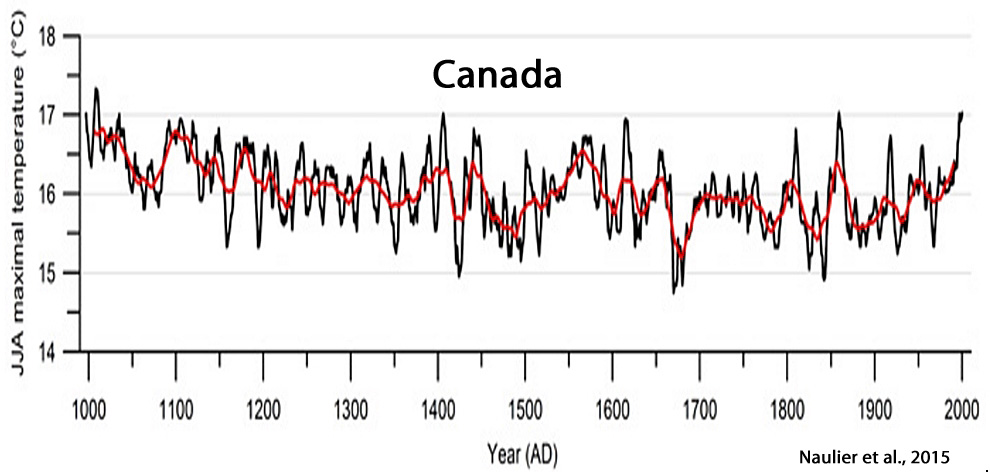
Naulier et al., 2015
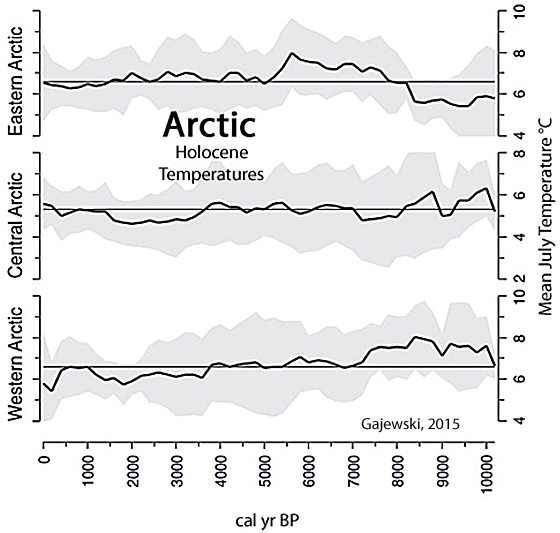
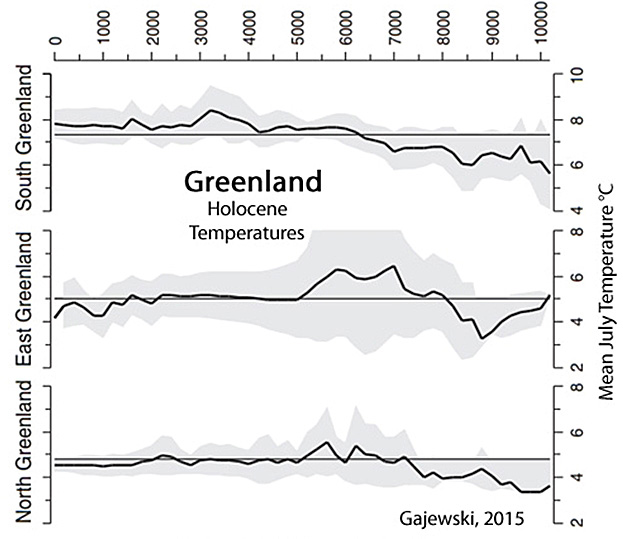
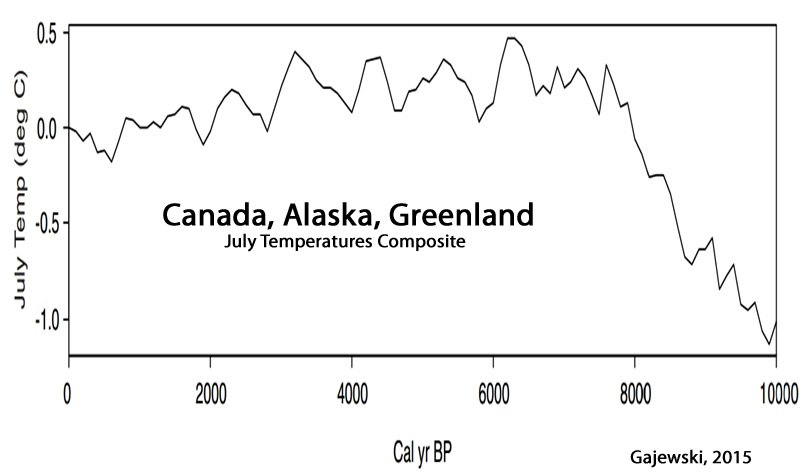
Gajewski, 2015
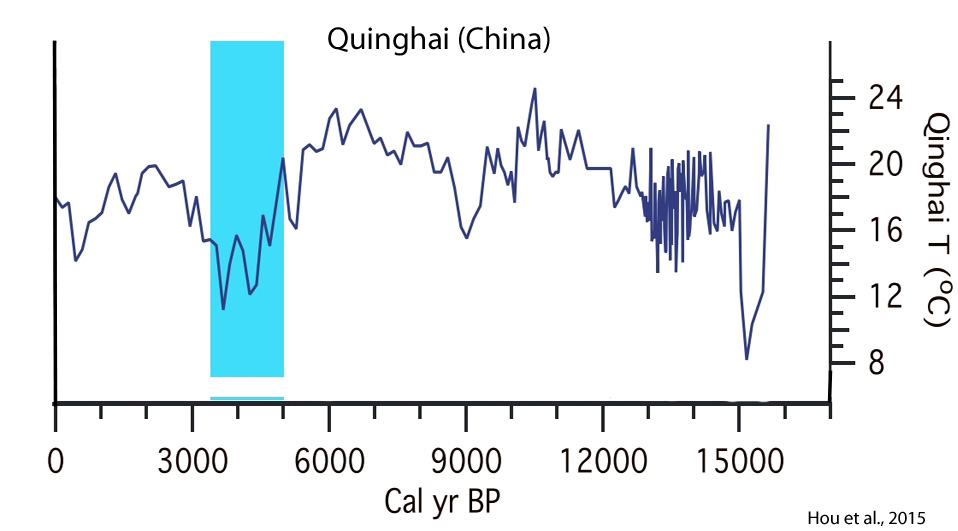
Hou et al., 2015
“Lake Qinghai also displays significant temperature oscillations in the past 3000 years, which may reflect an amplified response to volcanic and/or solar forcings [Stuiver et al., 1995]. The warm period peaking around 2 ka coincides with the Roman warm period, which is followed by cooling into the little ice age, peaking at about 500 years ago (Figure 2). The most distinct and unusual feature of Lake Qinghai summer temperature record is a temperature decrease of more than 4°C between 5 and 3.5 ka. Such temperature changes have not been observed in ice core records in Greenland and speleothem records in China and East Asia. Here we show, however, that this “unusual” feature is in fact prevalent in regional records.”
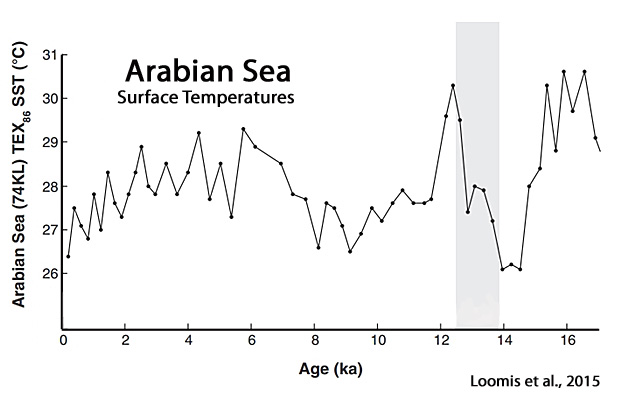
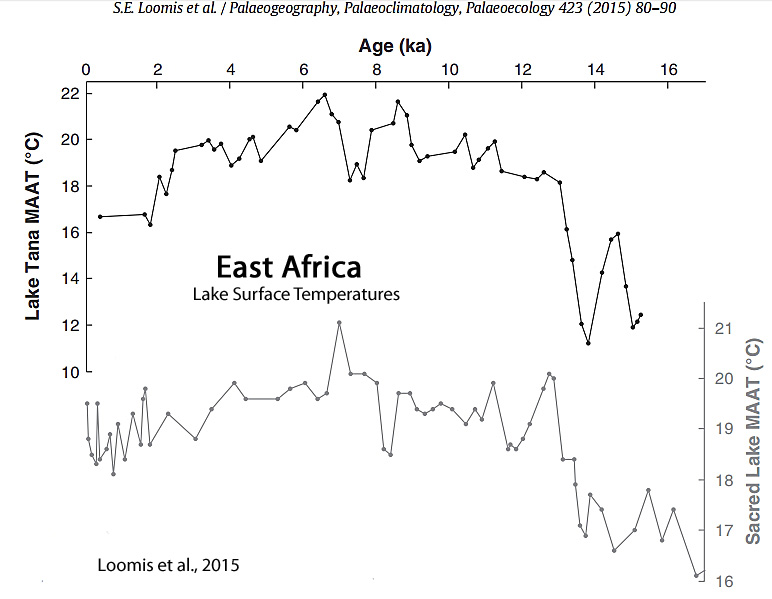
Loomis et al., 2015
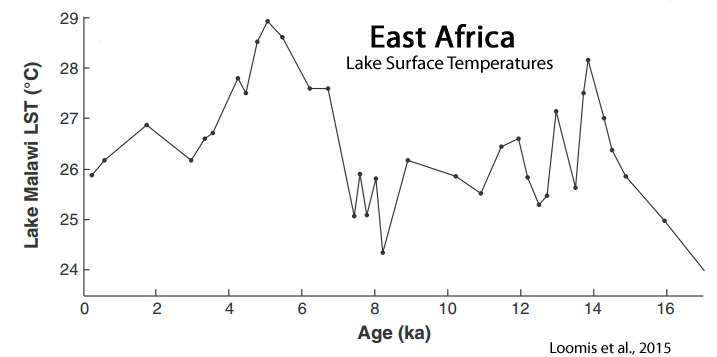
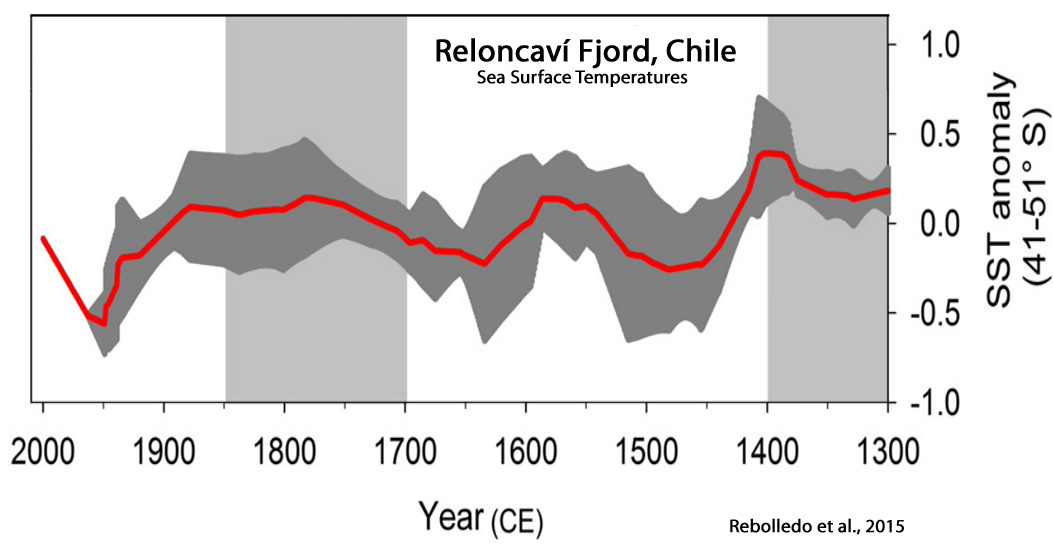
Rebolledo et al., 2015
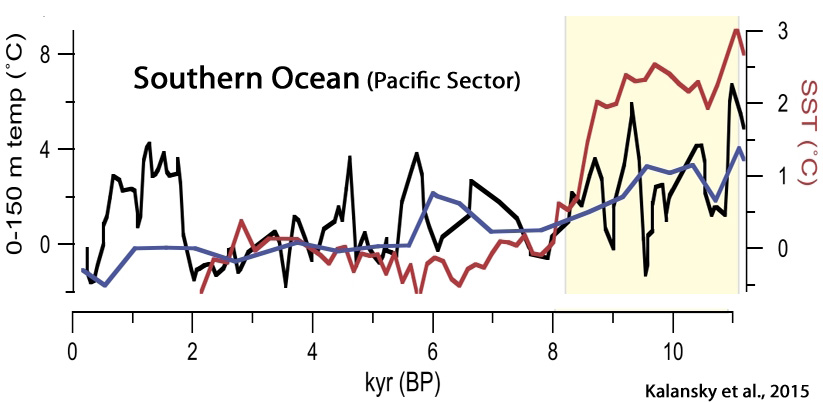
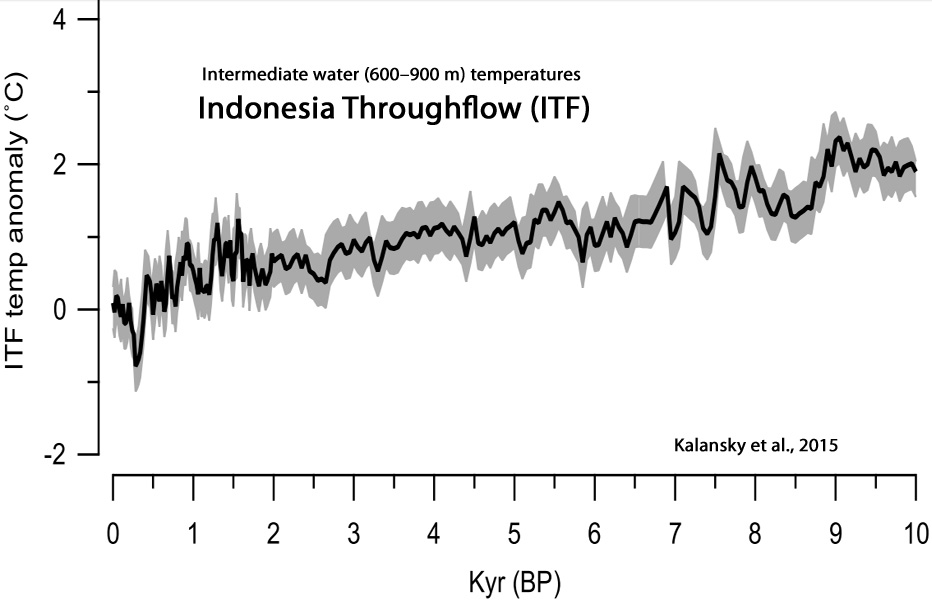
Kolansky et al., 2015


Esper et al., 2014
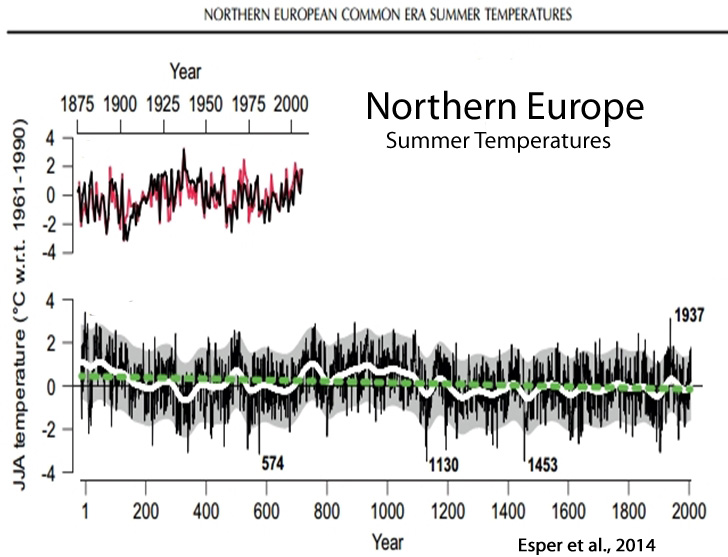
Rinne et al., 2014
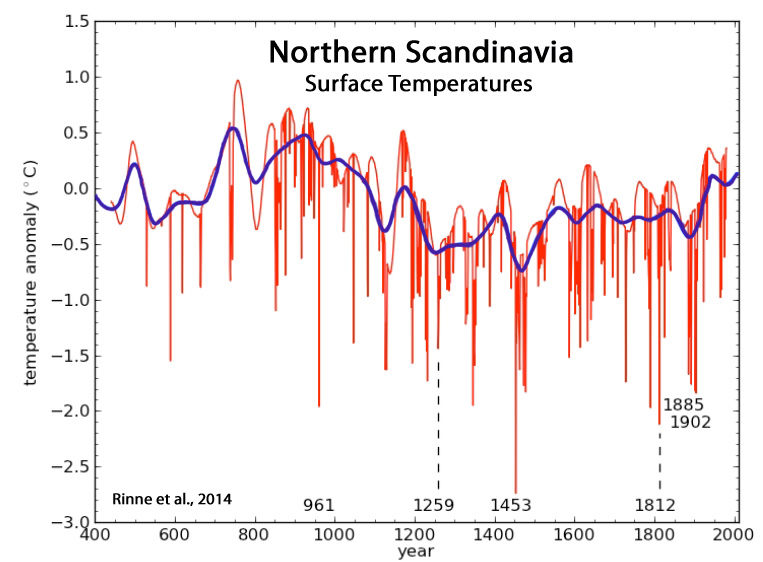
Luoto et al., 2014
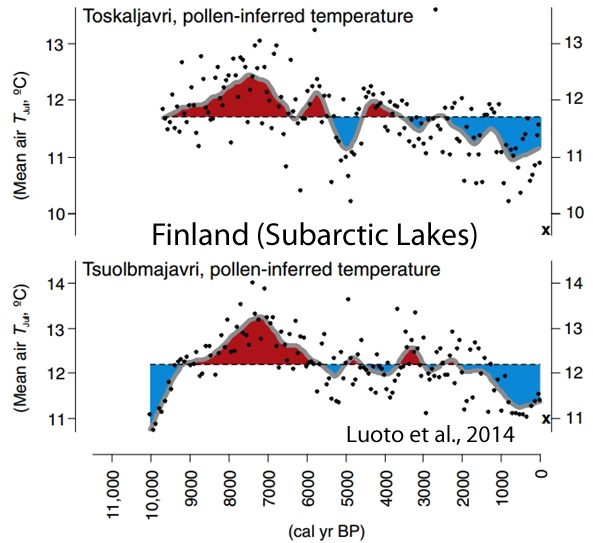
Yan et al., 2014
“The results suggested that the mean SSTs around AD 990 (±40) and AD 50 (±40) were 28.1 °C and 28.7 °C, 0.8 °C and 1.4 °C higher than that during AD 1994–2005, respectively. These records, together with the tree ring, lake sediment and literature records from the eastern China and northwest China, imply that the temperatures in recent decades do not seem to exceed the natural changes in MCA [Medieval Climate Anomaly], at least in eastern Asia from northwest China to northern SCS.”
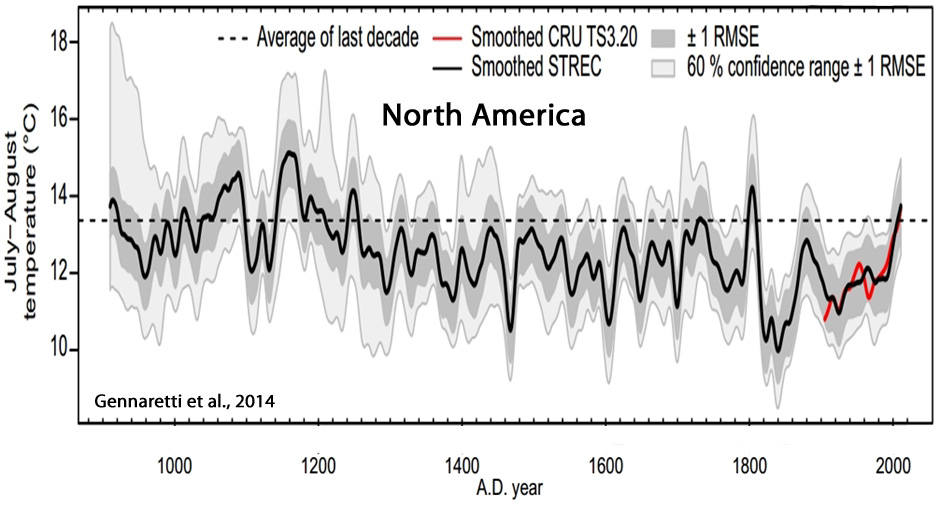
Gennaretti et al., 2014
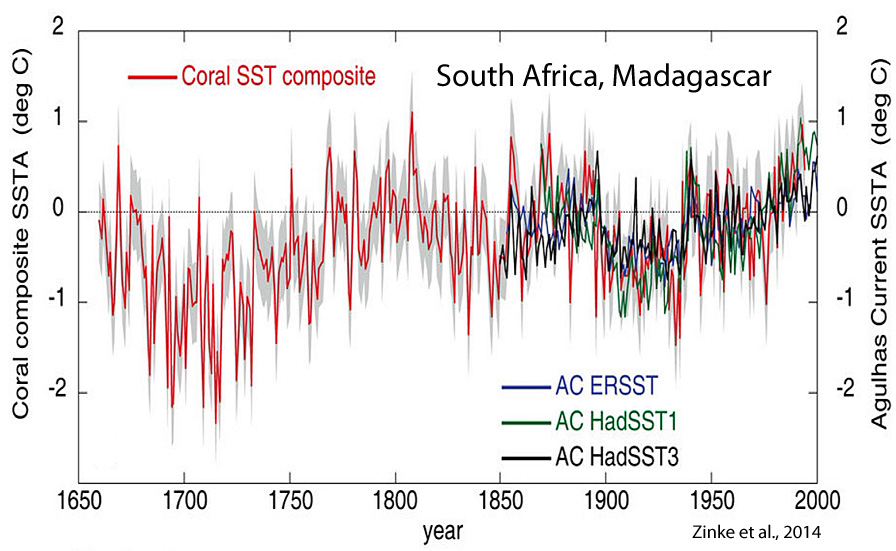
Zinke et al., 2014
Bertrand et al., 2014

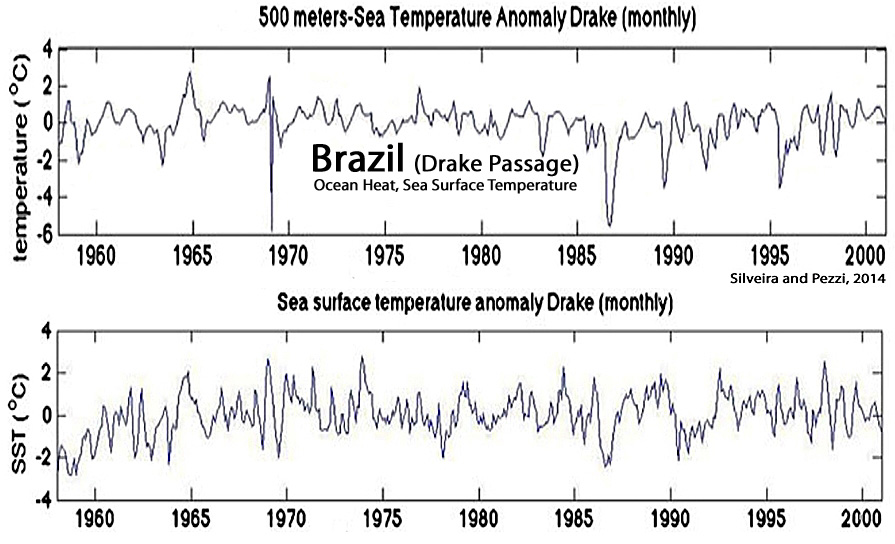
Silveira and Pezzi, 2014
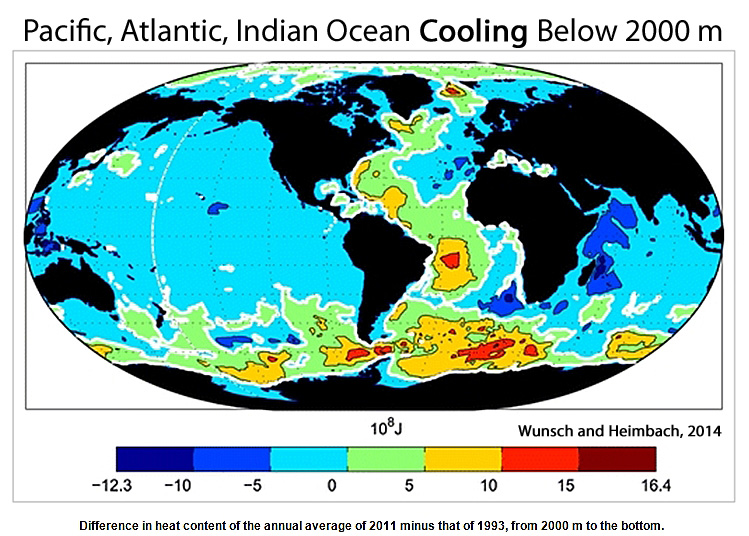
Wunsch and Heimbach, 2014
“A very weak long-term [1993-2011] cooling is seen over the bulk of the rest of the ocean below that depth [2000 m], including the entirety of the Pacific and Indian Oceans, along with the eastern Atlantic basin.”
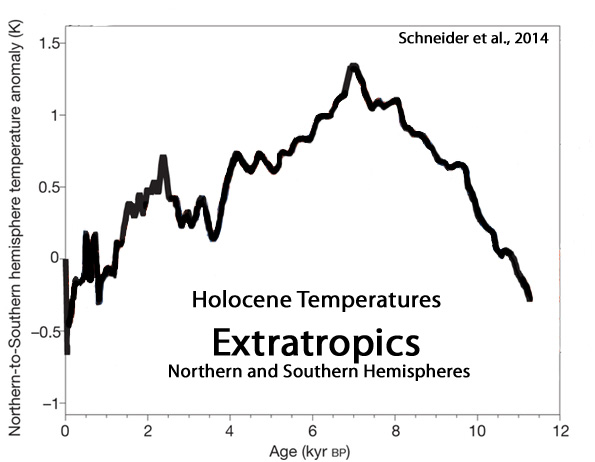
Schneider et al. 2014
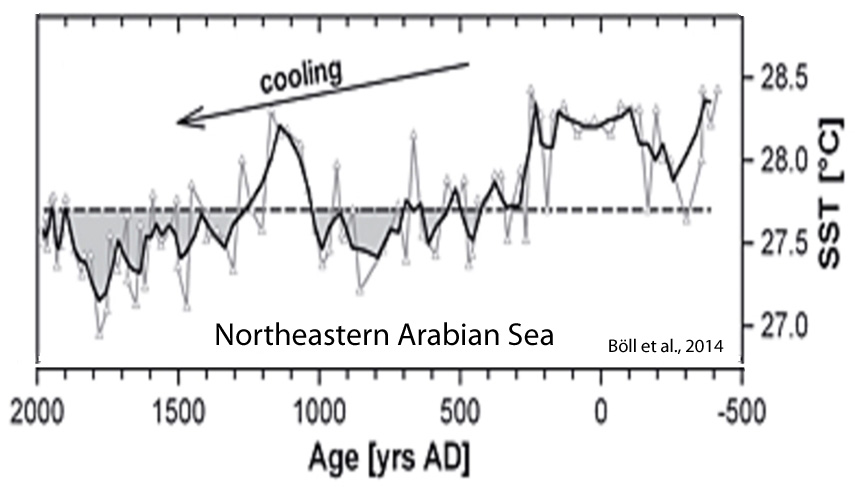
Böll et al., 2014
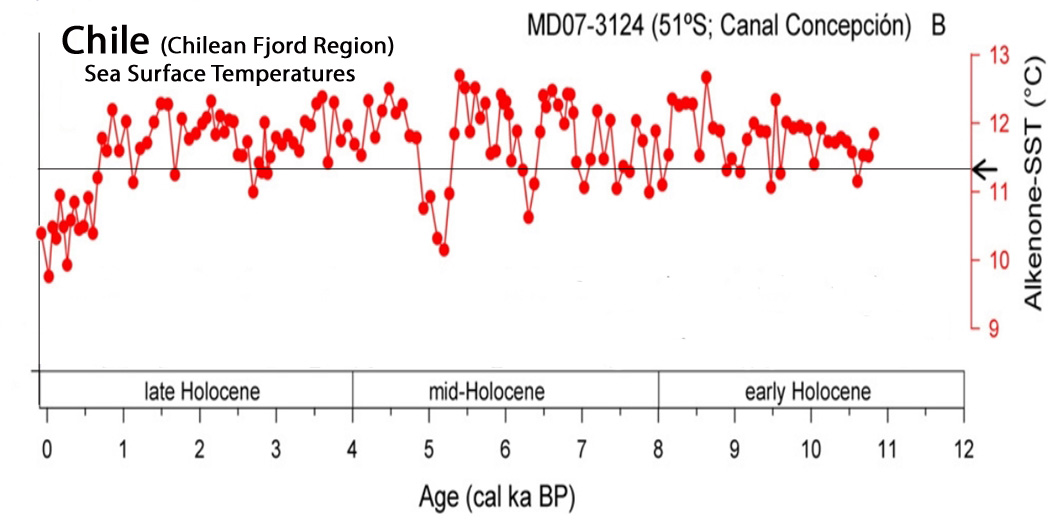
Caniupán et al., 2014
Rella and Uchida, 2014

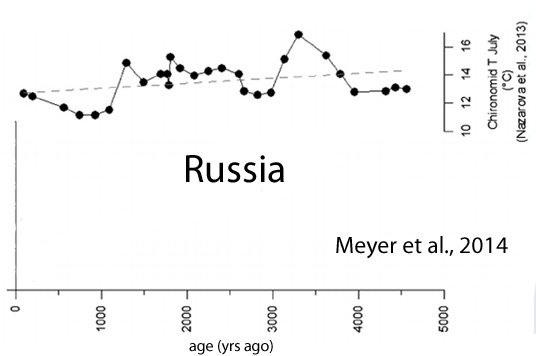
Meyer et al., 2014
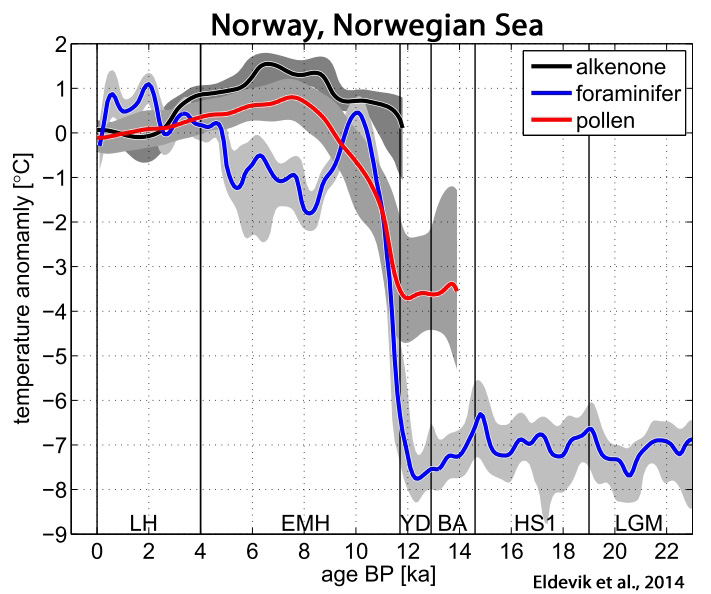
Eldevik et al., 2014
“Through the LH [Late Holocene], ocean temperatures [North Atlantic, Nordic Seas] are comparable to the present, but up to 1°C warmer“


Elbert et al., 2013


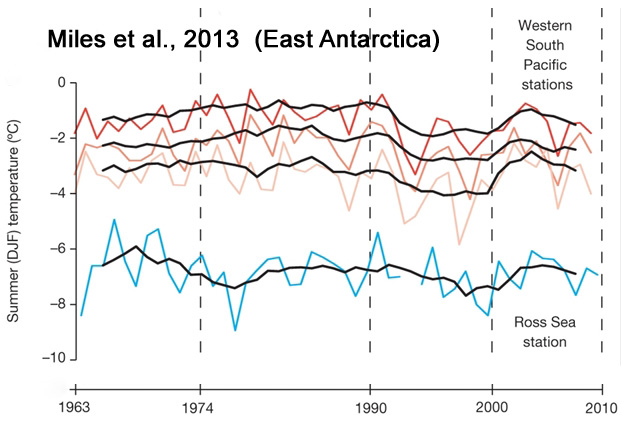
Miles et al., 2013
Lecavalier et al., 2013

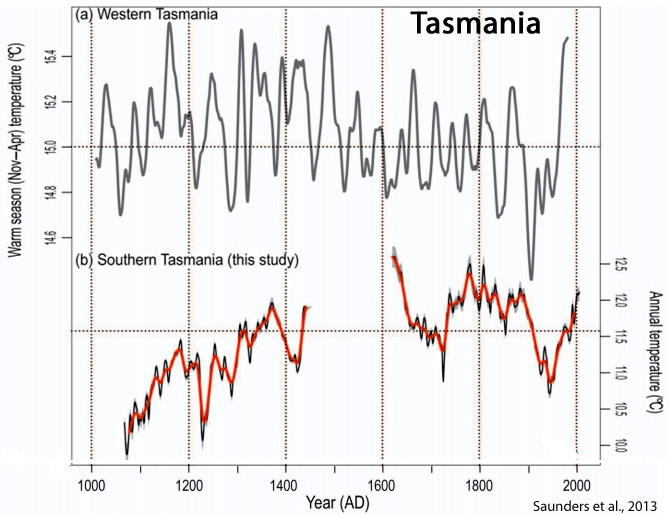
Saunders et al., 2013
Ault et al., 2013

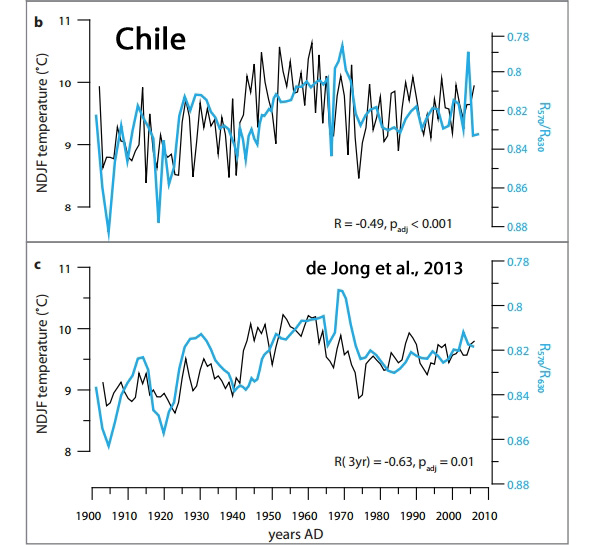
de Jong et al., 2013
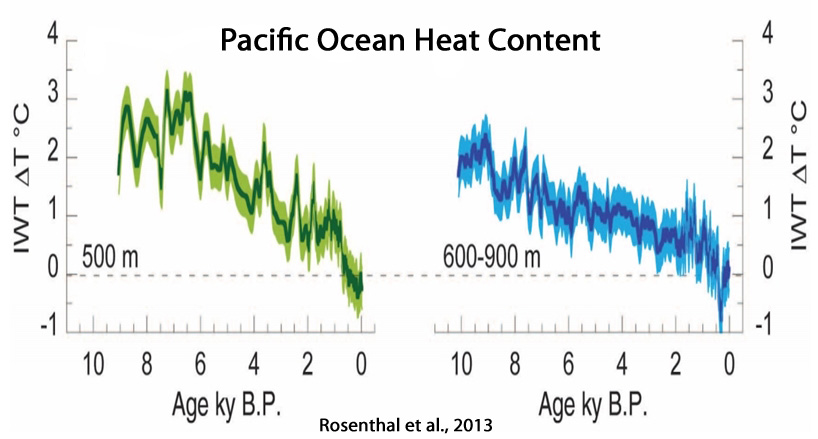
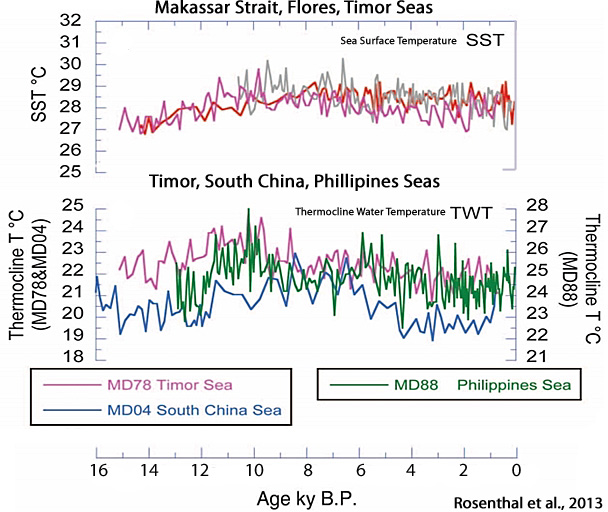
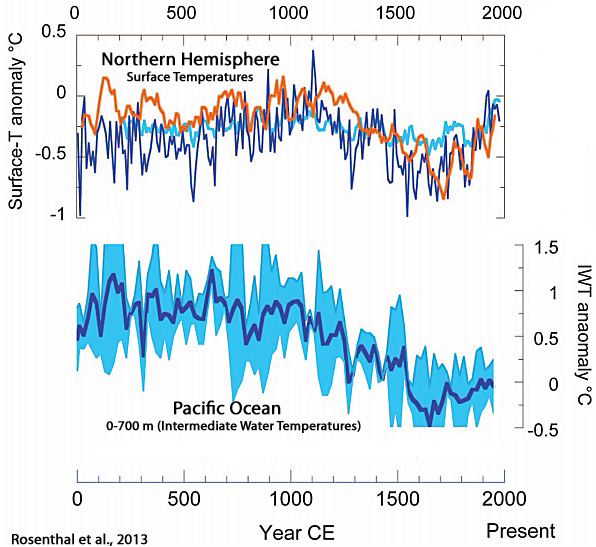
Rosenthal et al., 2013
“We show that water masses linked to North Pacific and Antarctic intermediate waters were warmer by 2.1°C and 1.5°C, respectively, during the middle Holocene Thermal Maximum than over the past century. Both water masses were ~0.9°C warmer during the Medieval Warm period than during the Little Ice Age and ~0.65° warmer than in recent decades.”
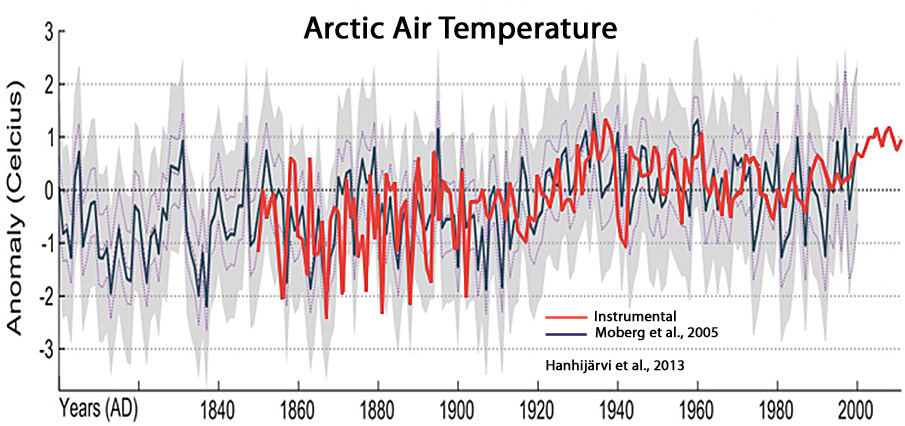
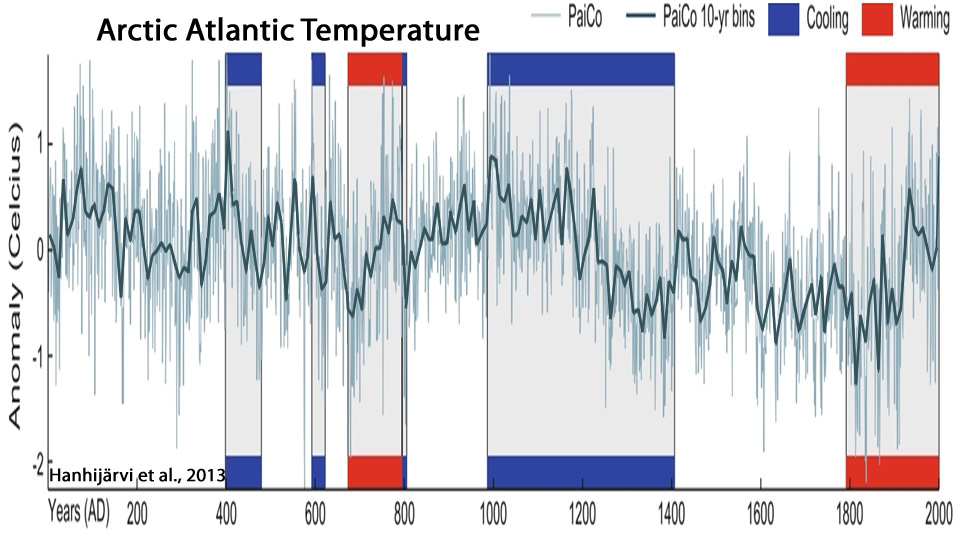
Hanhijärvi et al., 2013
“According to Chylek et al. (2009), the Arctic warming from 1900 to 1940 proceeded at a significantly faster rate than the warming during the more recent decades and was highly correlated with the Atlantic Multi-decadal Oscillation (AMO) suggesting that the Arctic temperature variability is highly linked to the Atlantic Ocean thermohaline circulation at various temporal scales.”
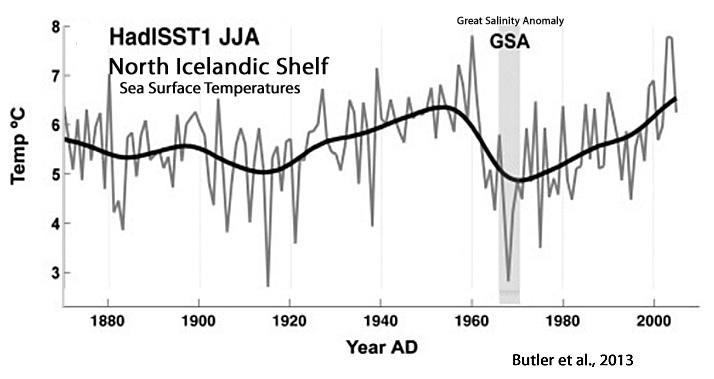
Butler et al., 2013

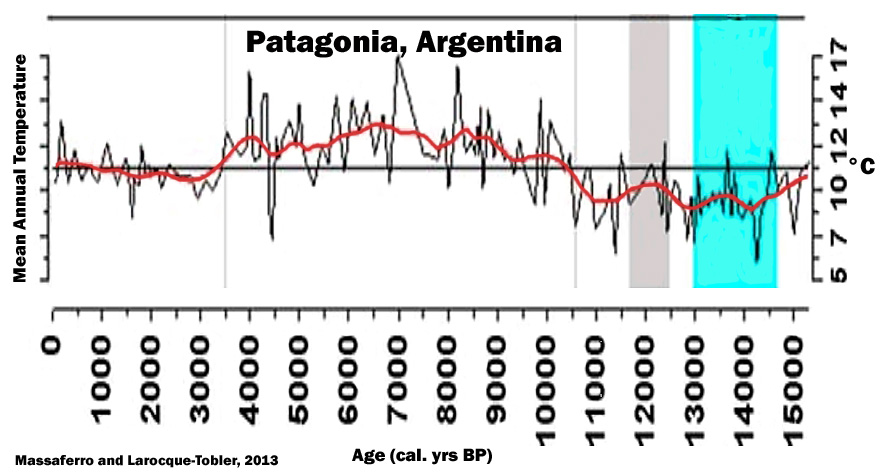
Massaferro and Larocque-Tobler, 2013
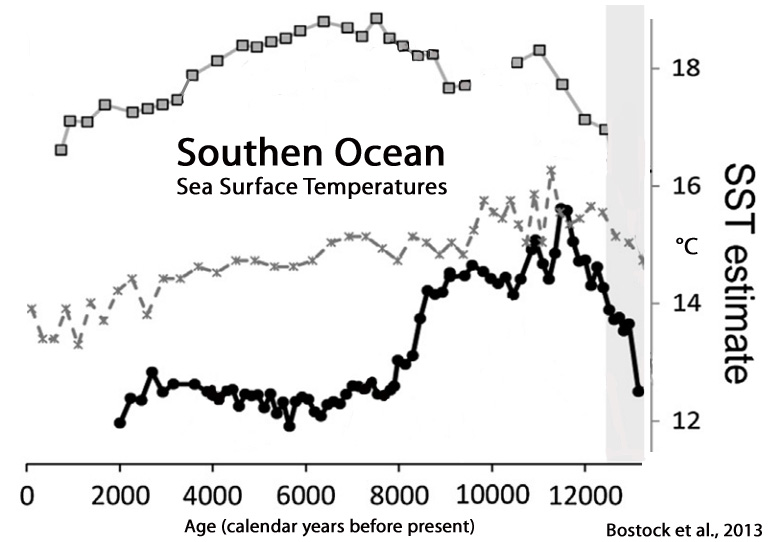
Bostock et al., 2013
Levy et al., 2013

Kylander et a., 2013

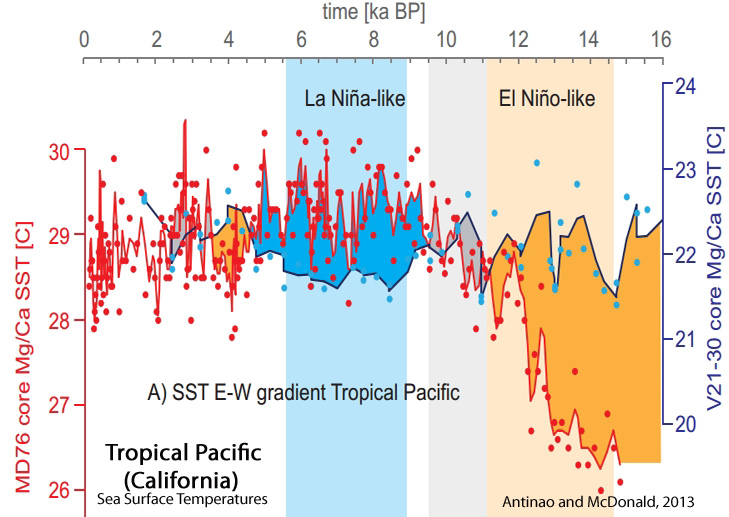
Antinao and McDonald, 2013


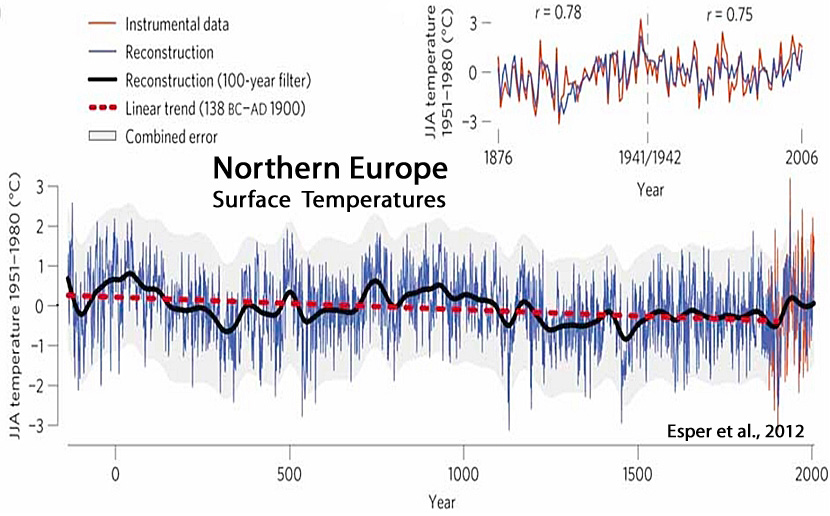
Esper et al., 2012
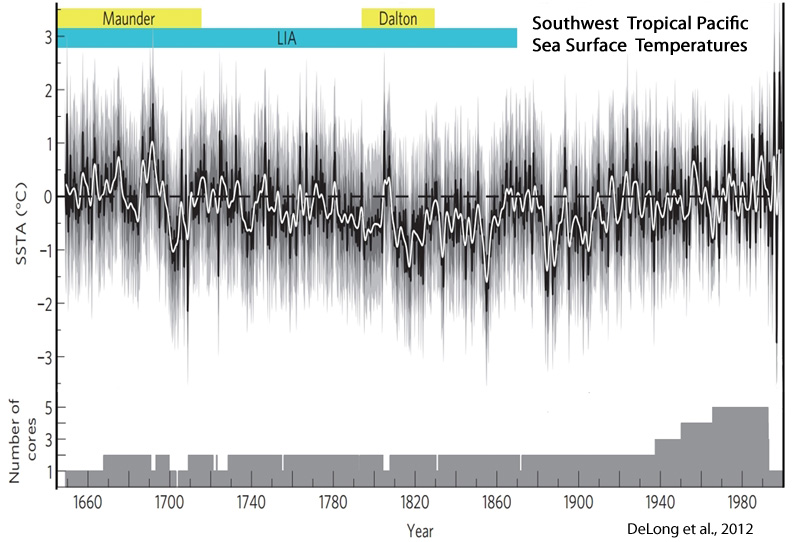
Delong et al., 2012
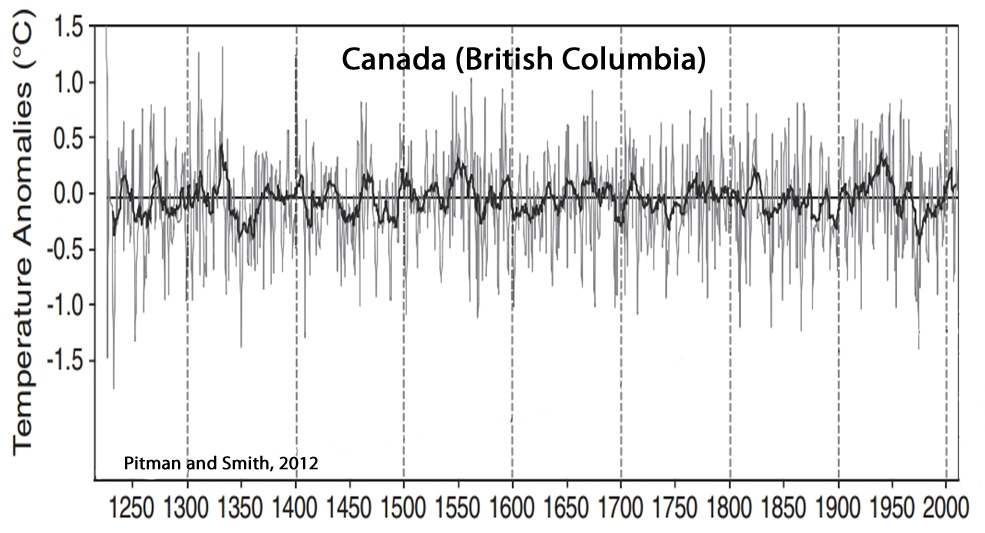
Pitman and Smith, 2012
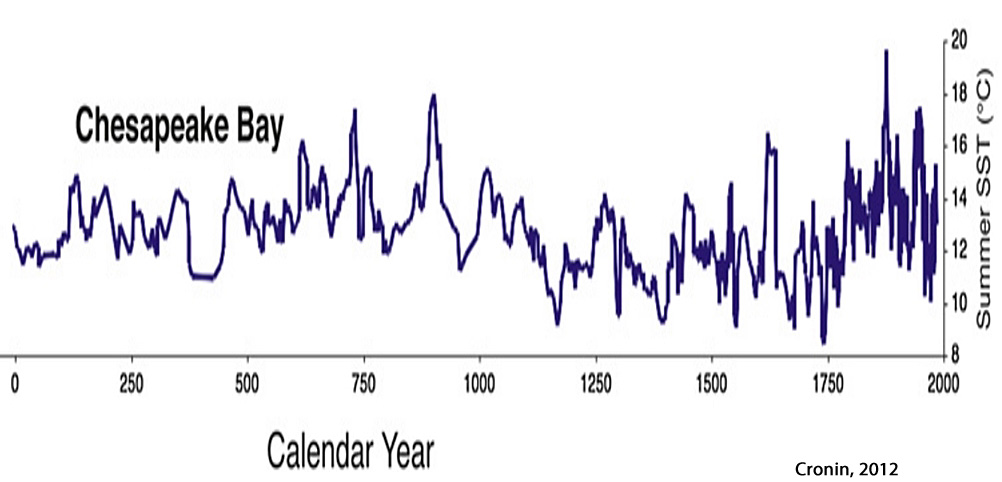
Cronin, 2012
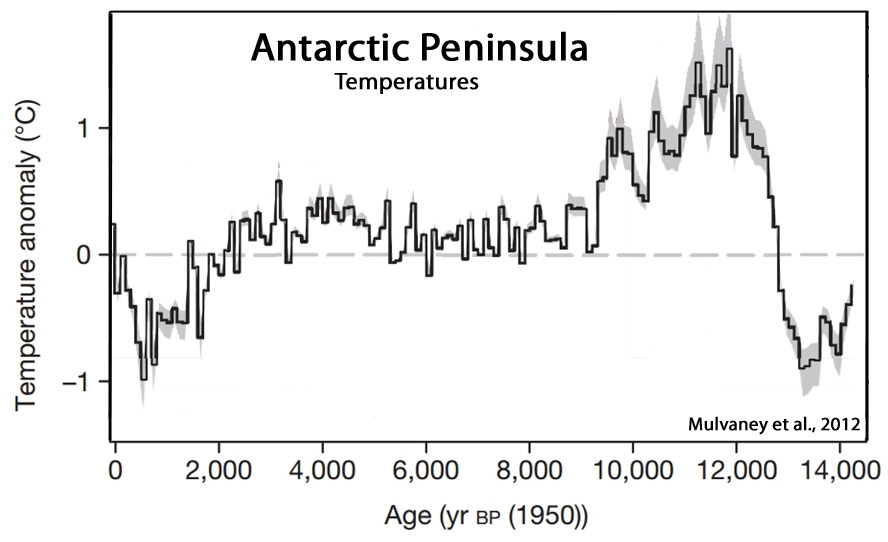
Mulvaney et al., 2012
“A marine sediment record from off the shore of the western Antarctic Peninsula also shows an early Holocene optimum during which surface ocean temperatures were determined to be 3.5°C higher than present. Other evidence suggests that the George VI ice shelf on the southwestern Antarctic Peninsula was absent during this early-Holocene warm interval but reformed in the mid Holocene.”
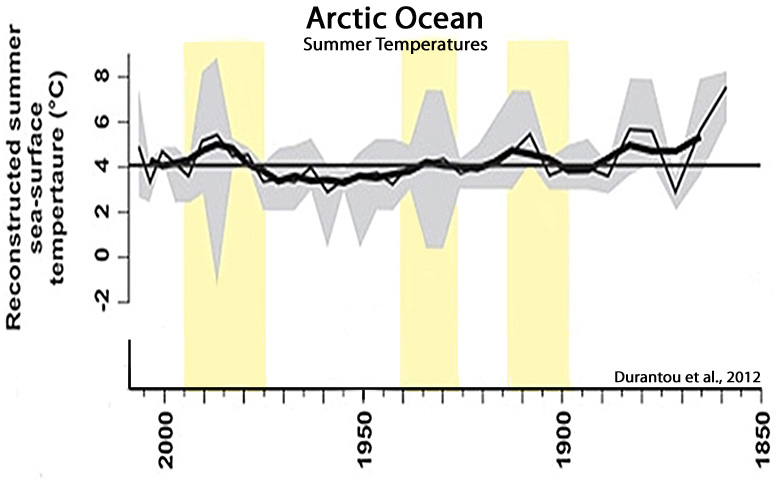
Durantou et al., 2012
“Sea surface temperature [Arctic Ocean] between ∼ AD 1885–1935 are warmer by up to 3°C with respect to the average modern temperature at the coring site. For the period ∼ AD 1887–1945, reconstructed sea ice cover values are on average 8.3 months per year which is 1.1 months per year lower than the modern values.”
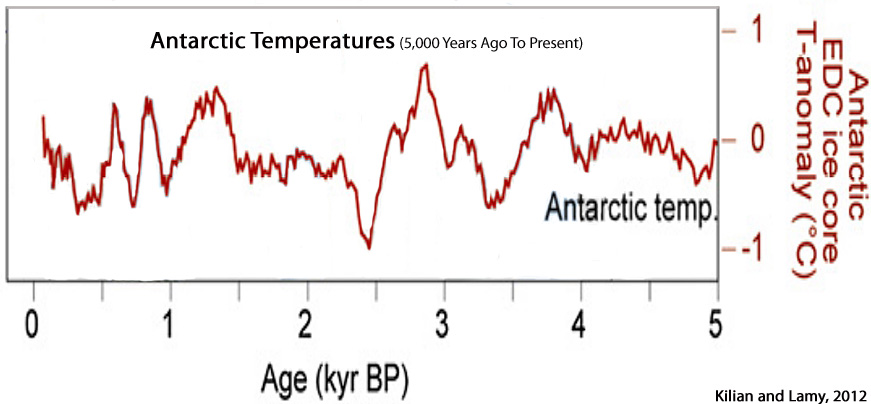
Kilian and Lamy, 2012



Li et al., 2011

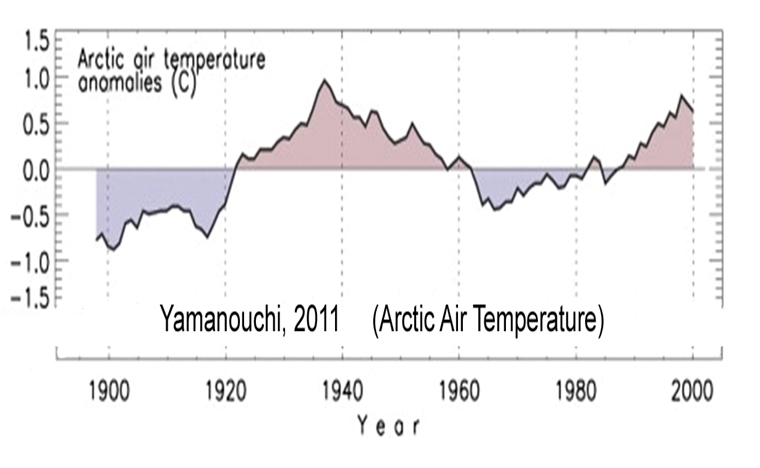
Yamanouchi, 2011
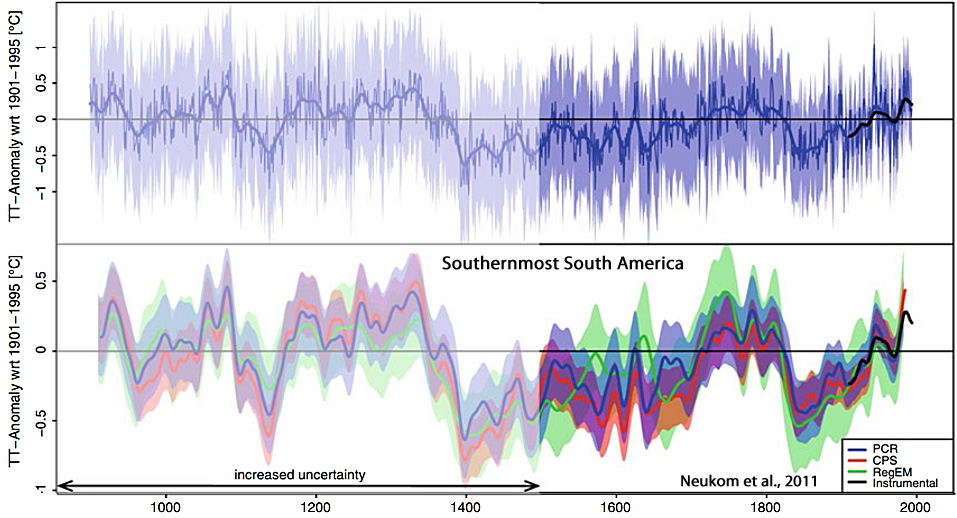
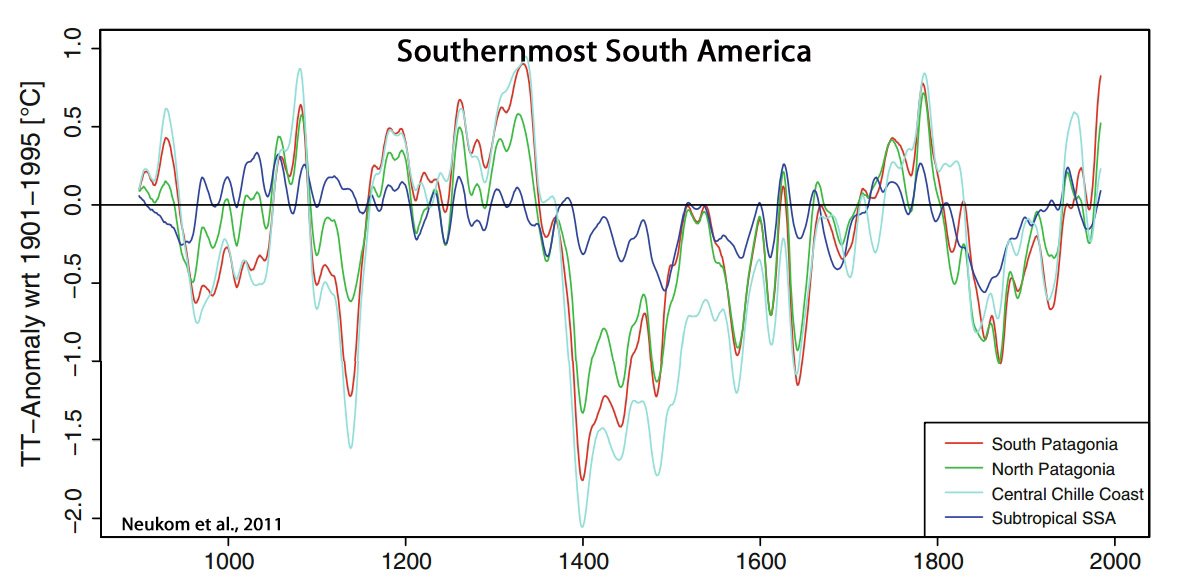
Neukom et al., 2011
“The reconstructed SSA [Southernmost South America] mean summer temperatures between 900 and 1350 are mostly above the 1901–1995 climatology. After 1350, we reconstruct a sharp transition to colder conditions, which last until approximately 1700. The summers in the eighteenth century are relatively warm with a subsequent cold relapse peaking around 1850. In the twentieth century, summer temperatures reach conditions similar to earlier warm periods.”
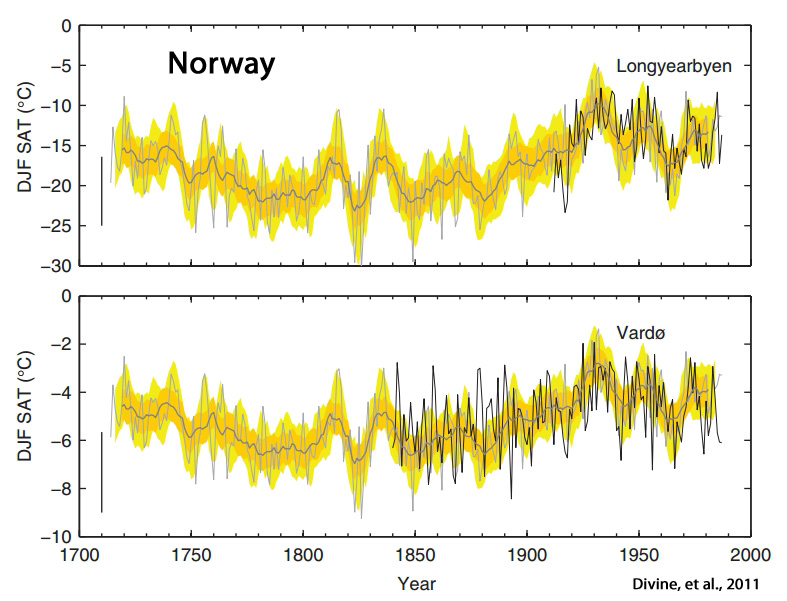
Divine et al, 2011
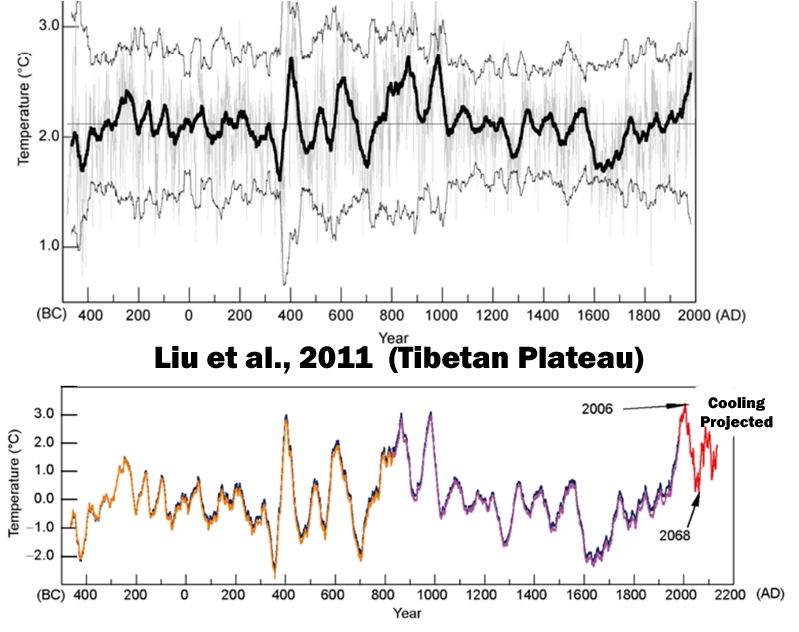
Liu et al., 2011
“Climate events worldwide, such as the MWP and LIA, were seen in a 2485-year temperature series. The largest amplitude and rate of temperature both occurred during the EJE [Eastern Jin Event (343–425 AD)], but not in the late 20th century. The millennium-scale cycle of solar activity determined the long-term temperature variation trends, while century-scale cycles controlled the amplitudes of temperature. Sunspot minimum events were associated with cold periods. The prediction results obtained using caterpillar-SSA showed that the temperature would increase until 2006 AD on the central-eastern Plateau, and then decrease until 2068 AD, and then increase again.”
Bird et al., 2011

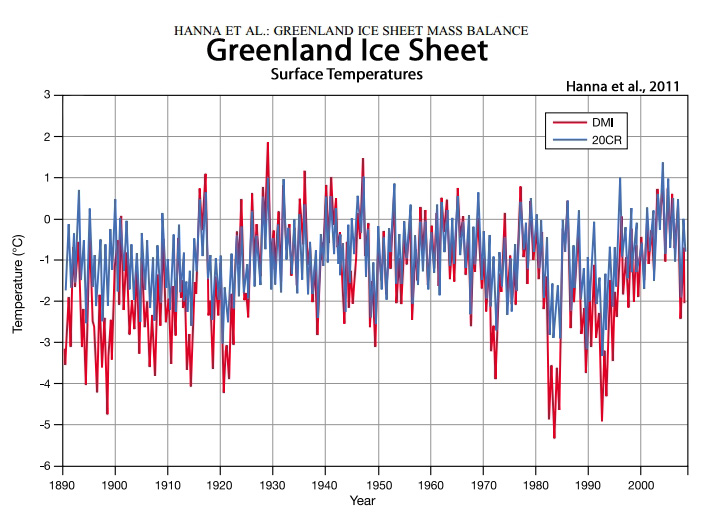
Hanna et al., 2011

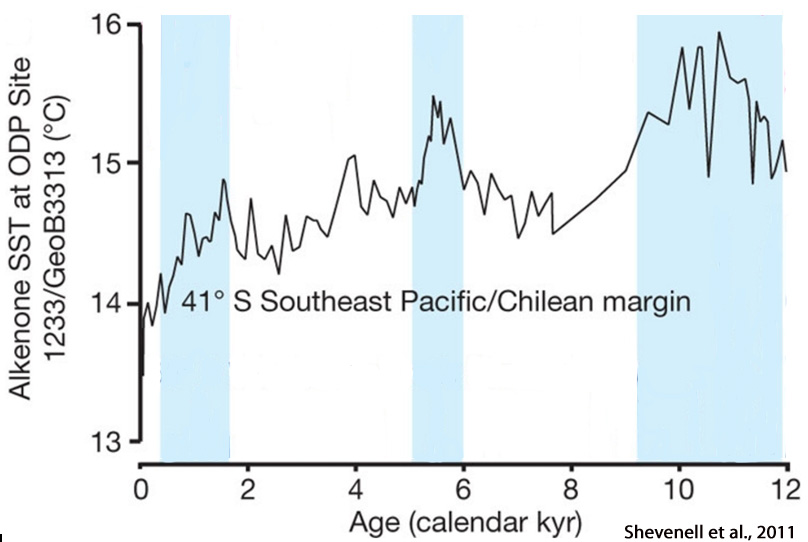
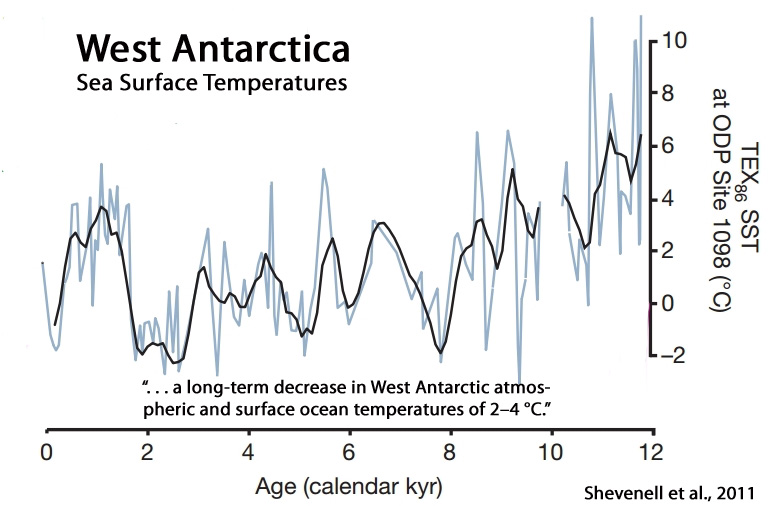
Shevenell et al., 2011
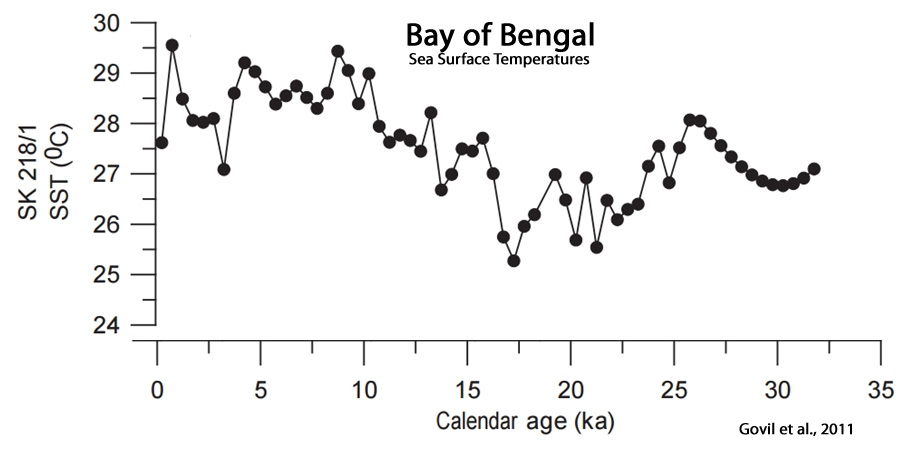
Govil et al., 2011
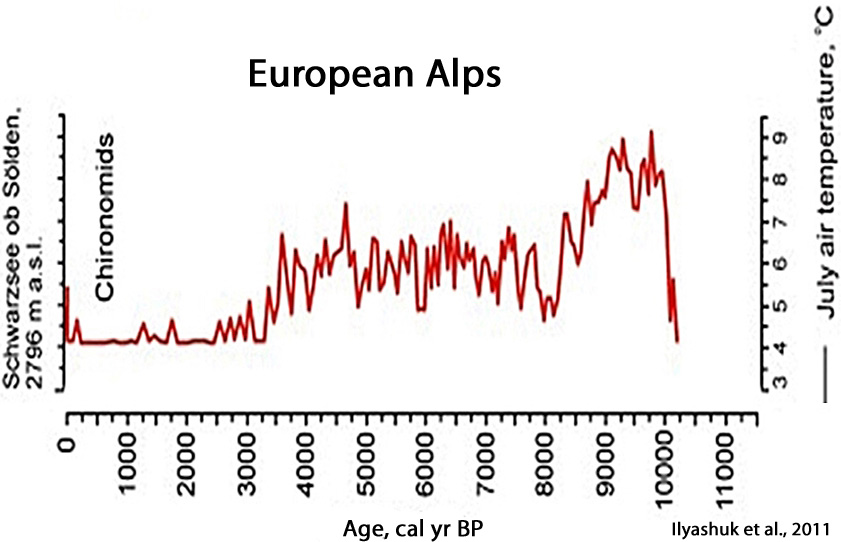
Ilyashuk et al. 2011
Shevenell et al., 2011
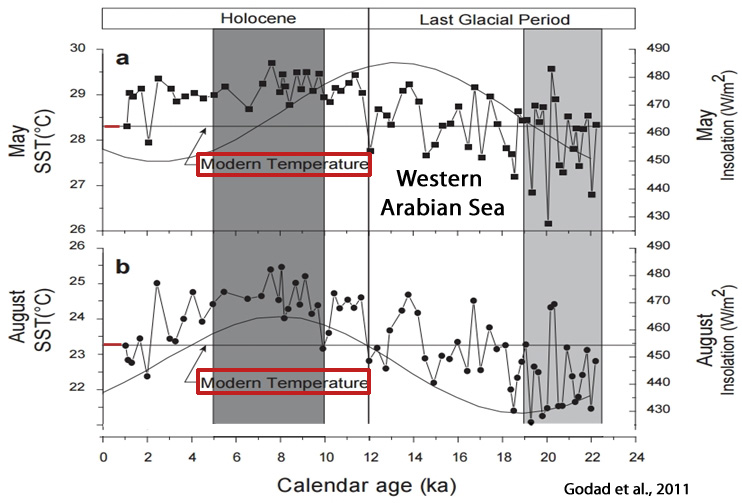
Godad et al., 2011
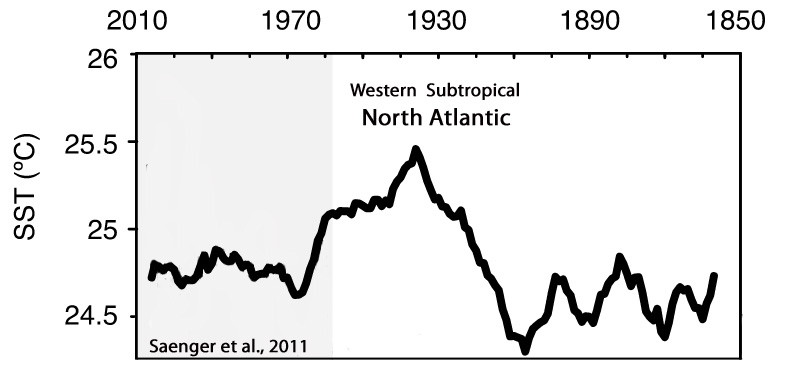
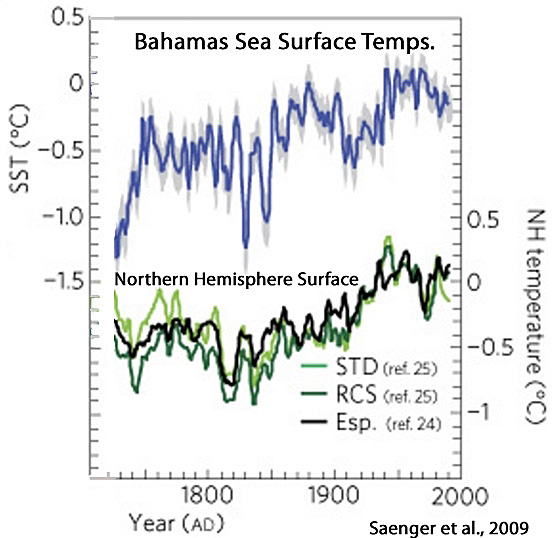
Saenger et al., 2011
“A prominent feature of this record is the ∼1°C warm anomaly that occurred between 1930 and 1950. … Carolina Slope SST does not exhibit the warming trend seen in the AMO since the 1970s suggesting that other factors also impact SST variability at our site.”


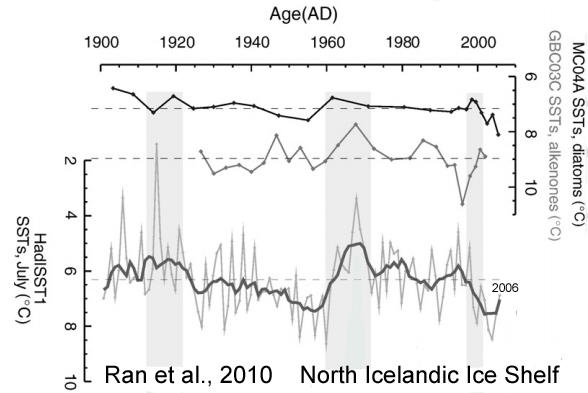
Ran et al., 2010
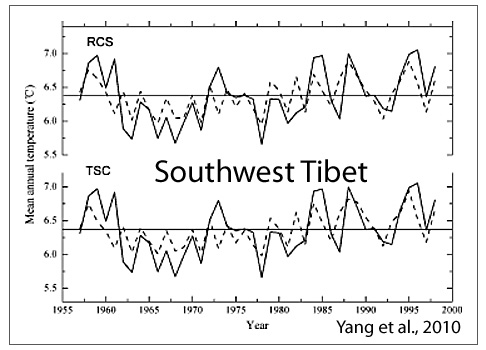
Yang et al., 2010
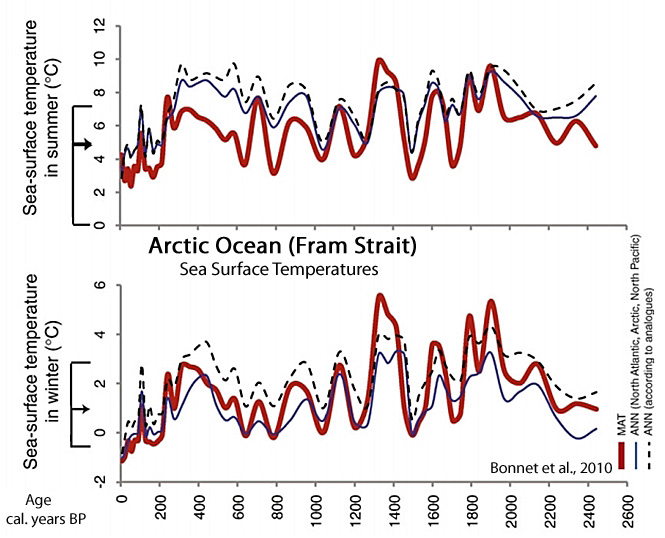
Bonnet et al., 2010
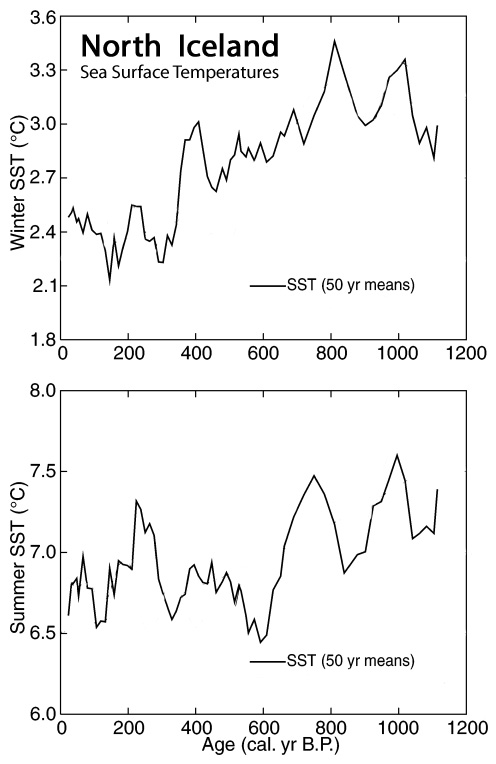
“Sea-surface temperature (SST) estimates suggest warmer conditions than present (anomaly∼+2 °C) averaging at 7 °C in summer until 300 cal. years BP, although cooling pulses are recorded around 1700, 1500, 1200 and 800 cal. years BP. The last 300 years were marked by a cooling from 7.6 to 3.5 °C and sea-ice cover increasing up to 7 months/yr. … From 2500 to 300 cal. years BP, SSTs were relatively high with mean values of about 2 °C and 7 °C in winter and summer, respectively. Warm phases are recorded around 1900, 1600, 1320, 1120 and 325 cal. years BP, with an optimum centered at 1320 cal. years BP. After 300 cal. years BP, SSTs were significantly lower with mean values of about 0 °C and 3.5–4 °C in winter and summer, respectively. … The record of sea-surface conditions from core JM04 indicates warmer winter SSTs during the last 2500 years than the modern average. The only exception is the interval spanning from 250 to 50 years BP, which is characterized by particularly low temperatures both in winter and summer.”
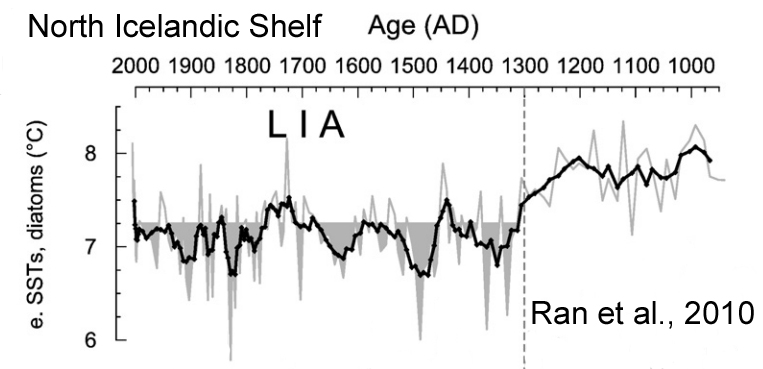
Ran et al., 2010


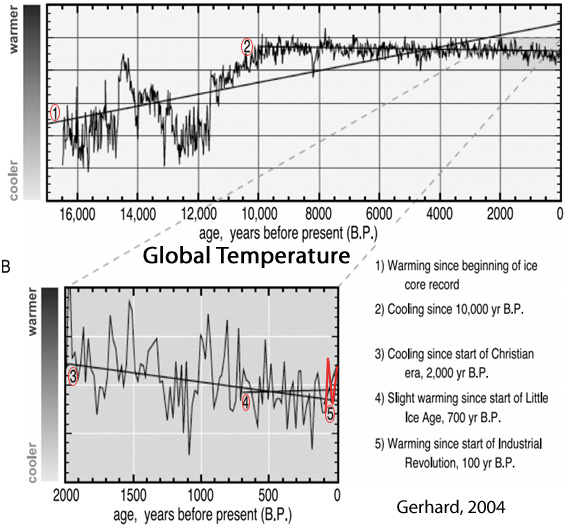
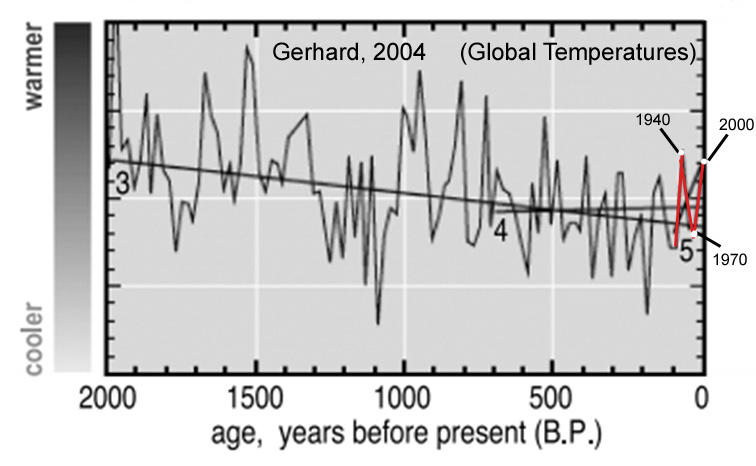
Gerhard, 2004
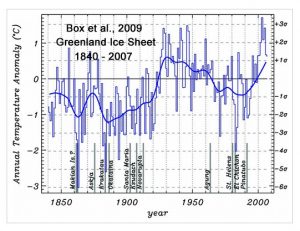
Box et al., 2009
“Meteorological station records and regional climate model output are combined to develop a continuous 168-yr (1840–2007) spatial reconstruction of monthly, seasonal, and annual mean Greenland ice sheet near-surface air temperatures. The annual whole ice sheet 1919–32 warming trend is 33% greater in magnitude than the 1994–2007 warming.”
Saenger et al, 2009
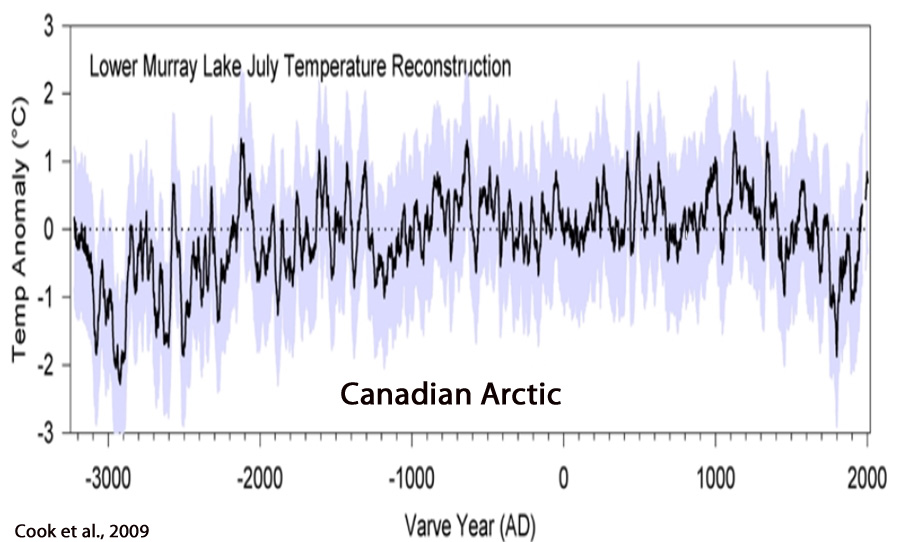
Cook et al., 2009
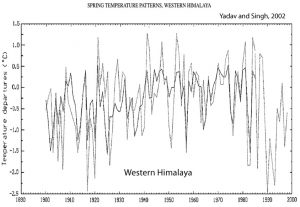
Yadav and Singh, 2002
“The 1945–1974 period was the warmest 30-yr mean period of the 20th century. However, this warming, in the context of the past four centuries, appears well within the range of normal limits. The 30-yr mean temperature anomaly for 1662–1691 (0.19°C) exceeds in magnitude (although not significantly, p = 0.23) the 1945–1974 mean (0.05°C).”
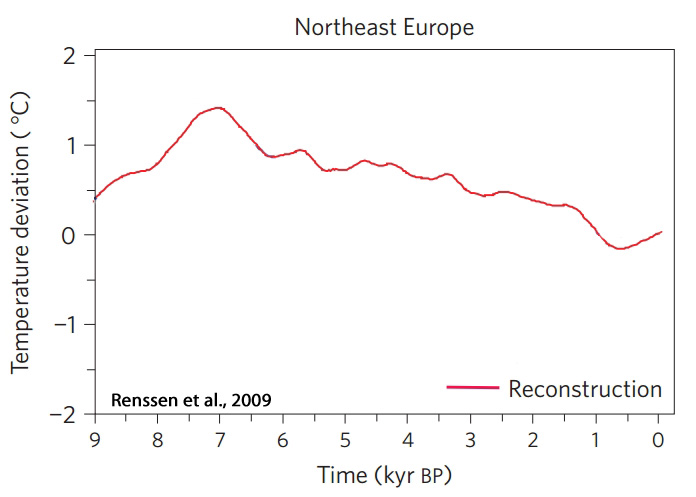
Renssen et al., 2009

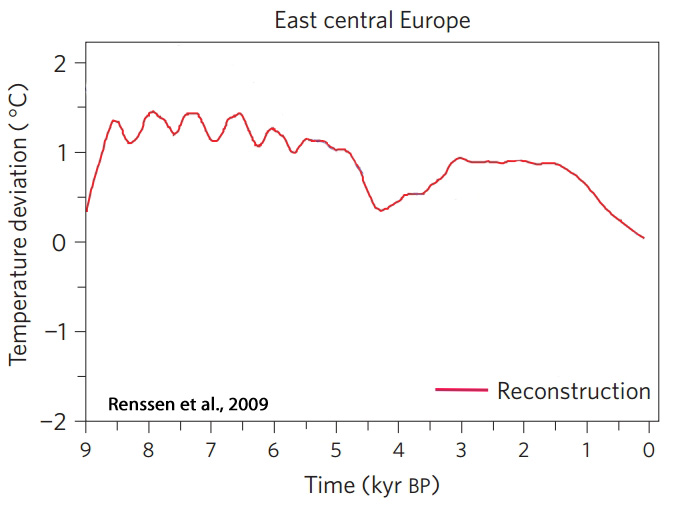
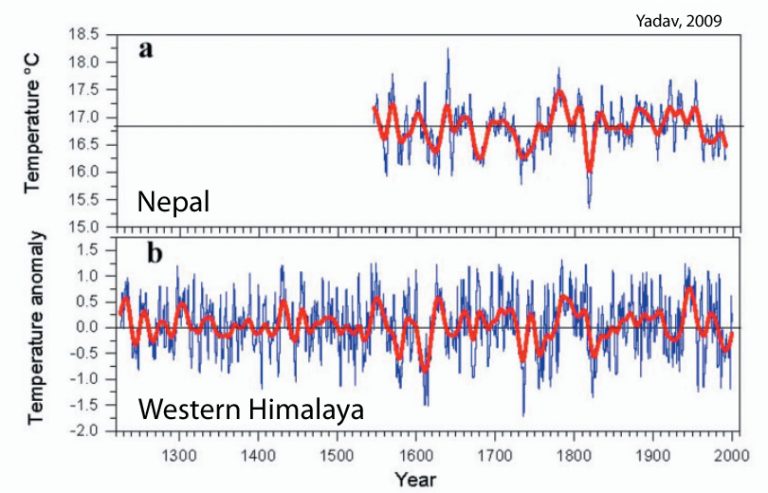
Yadav, 2009
“The decreasing temperature trend in late 20th century is consistent with trends noted in Nepal (Cook et al. 2003), Tibet (Briffa et al. 2001) and Central Asia (Briffa et al. 2001).”
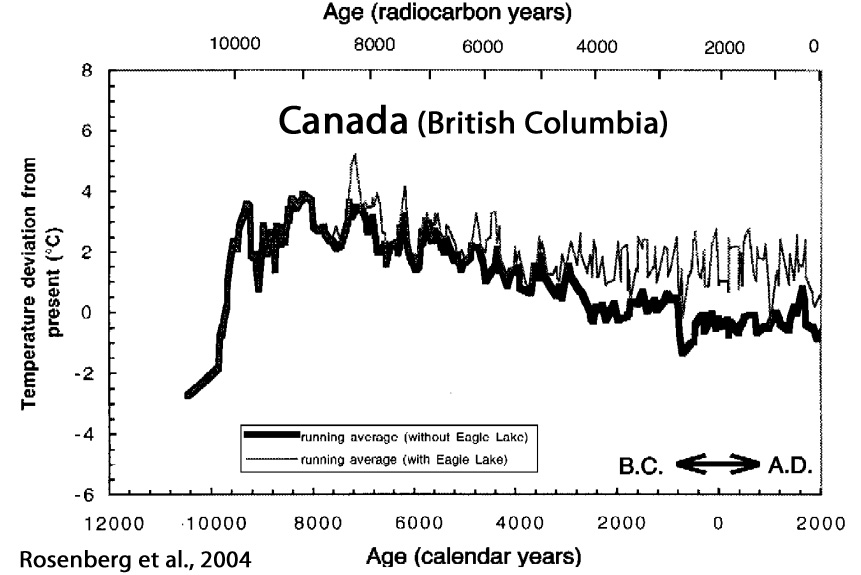
Rosenberg et al., 2004
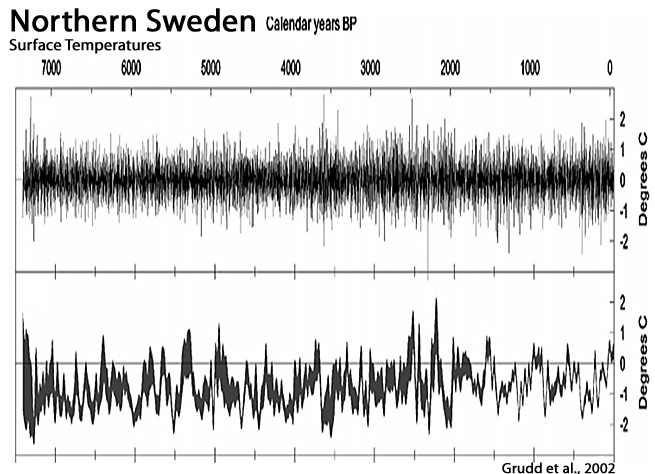
Grudd et al., 2002
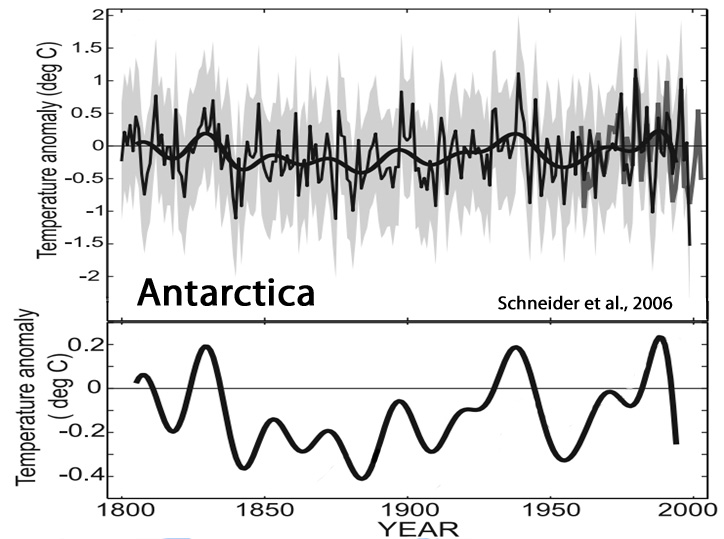
Schneider et al., 2006
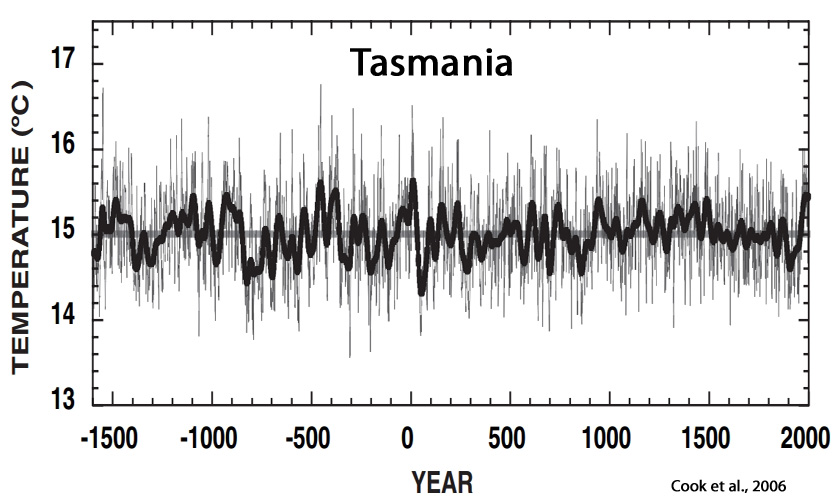
Cook et al., 2006
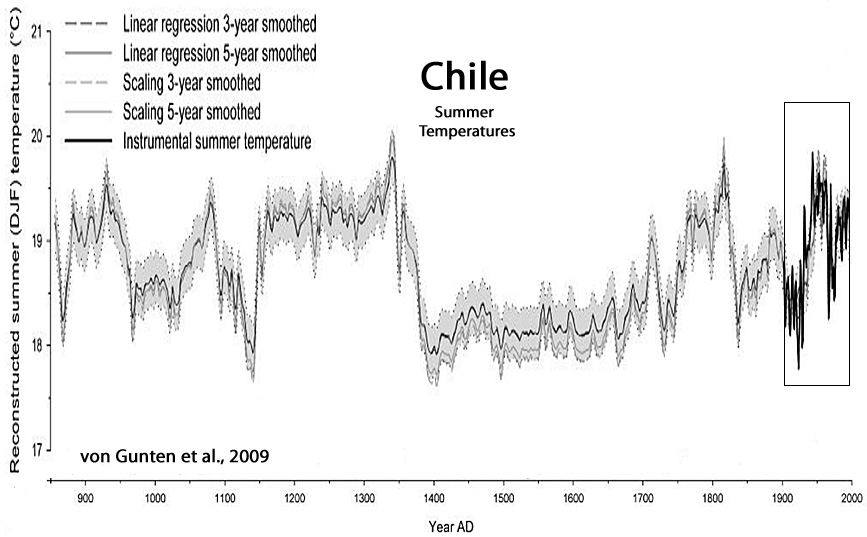
von Gunten et al., 2009
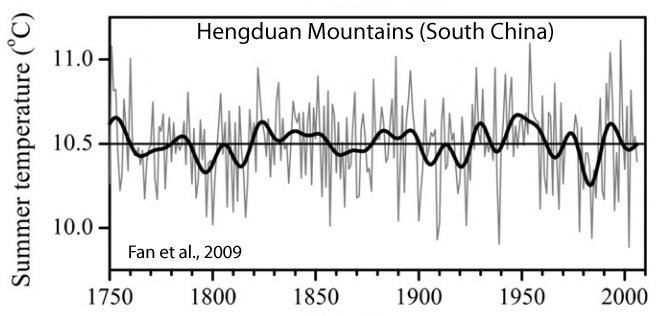
Fan et al., 2009
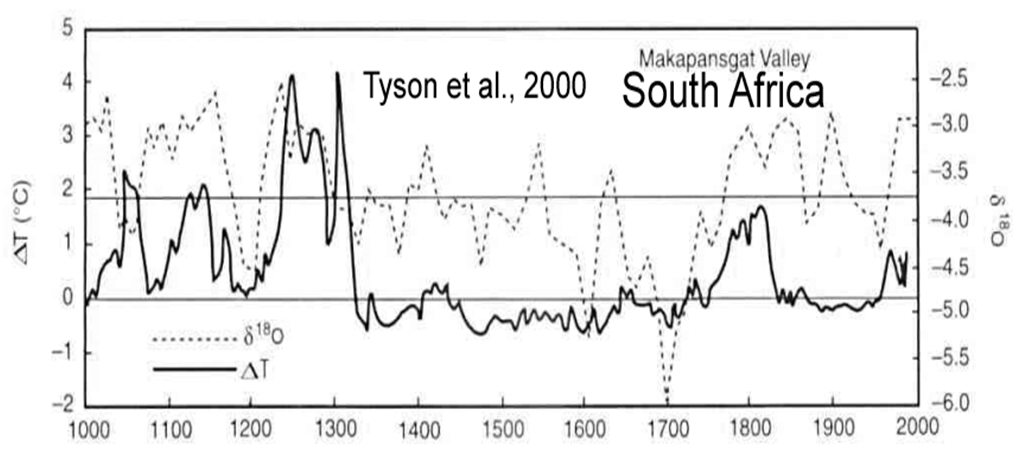
Tyson et al., 2000
“The climate of the interior of South Africa was around 1°C cooler in Little Ice Age [AD 1300 to 1800] and may have been over 3°C higher than at present during the extremes of the medieval warm period [AD 1000 to 1300]. … It was variable throughout the millennium, but considerably more so during the warming of the eleventh to thirteenth centuries. The lowest temperature events recorded during the Little Ice Age in South Africa are coeval with the Maunder and Sporer Minima in solar irradiance. The medieval warming is shown to have coincided with … the Medieval Maximum in solar radiation.”

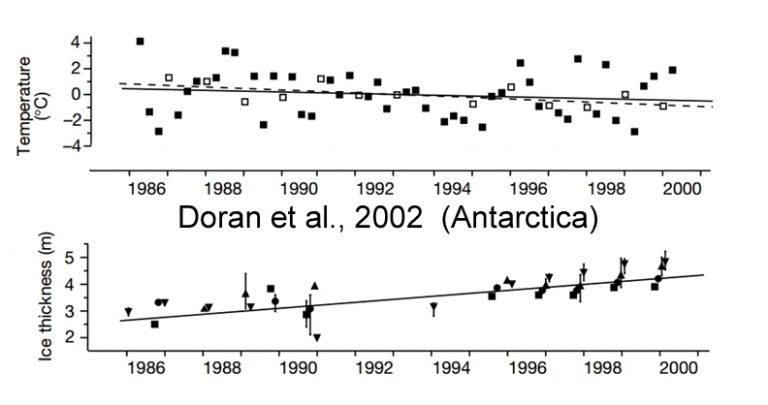
Doran et al., 2002
“[O]ur spatial analysis of Antarctic meteorological data demonstrates a net cooling on the Antarctic continent between 1966 and 2000, particularly during summer and autumn.”
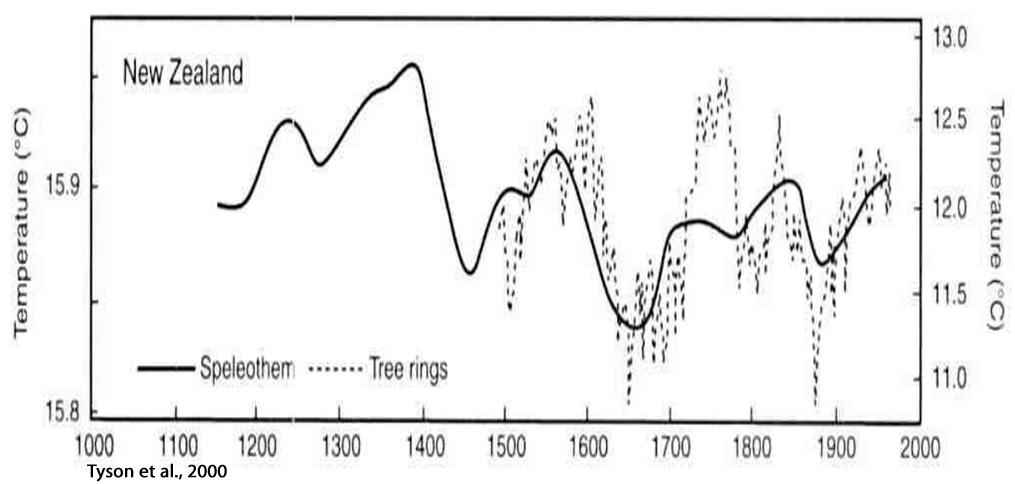
Cook et al., 2002
“This record is the longest yet produced for New Zealand and shows clear evidence for persistent above-average temperatures within the interval commonly assigned to the MWP [Medieval Warm Period]. Comparisons with selected temperature proxies from the Northern and Southern Hemispheres confirm that the MWP was highly variable in time and space. Regardless, the New Zealand temperature reconstruction supports the global occurrence of the MWP.”

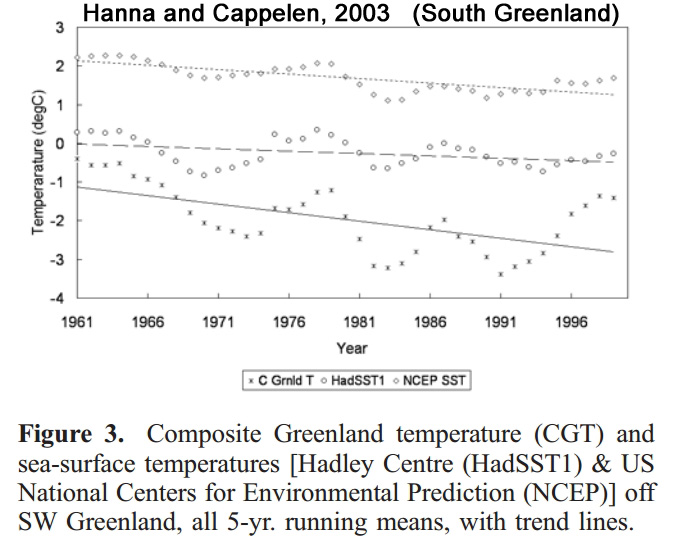
Hanna and Cappelen, 2003
“Analysis of new data for eight stations in coastal southern Greenland, 1958–2001, shows a significant cooling (trend-line change −1.29°C for the 44 years), as do sea-surface temperatures in the adjacent part of the Labrador Sea”
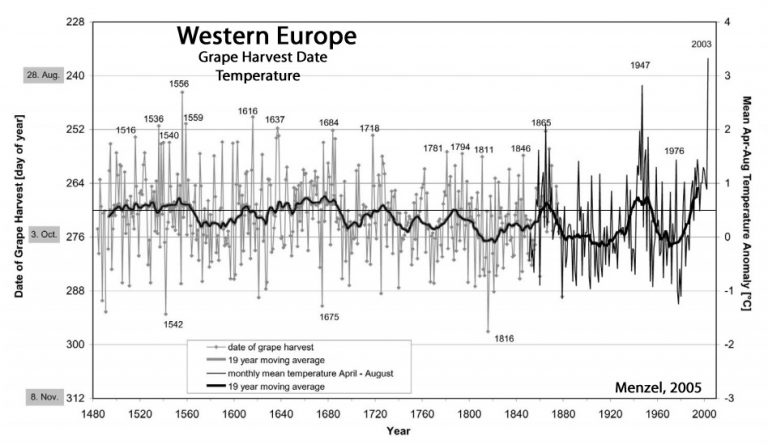
Chuine et al., 2004
“Figure 1 [below] shows two early warm decadal fluctuations: one in the 1380s (0.72 °C) and one in the 1420s (0.57 °C), both above the 95th percentile. The warm period of the 1420s was followed by a cold period that lasted from the mid-1430s to the end of the 1450s (0.45 °C, under the 10th percentile). Our series also reveals particularly warm events, above the 90th percentile, in the 1520s and between the 1630s and the 1680s. These decades were as warm as the end of the twentieth century. The high-temperature event of 1680 was followed by a cooling, which culminated in the 1750s (under the 5th percentile) — the start of a long cool period that lasted until the 1970s.”

Menzel, 2005
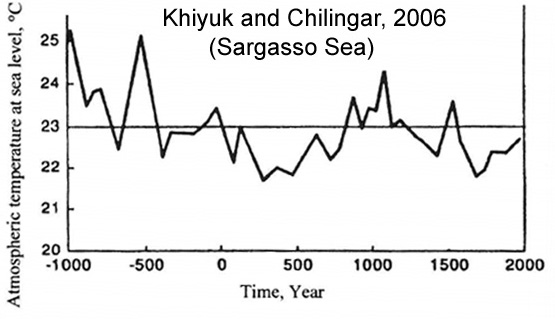
Khiyuk and Chilingar, 2006
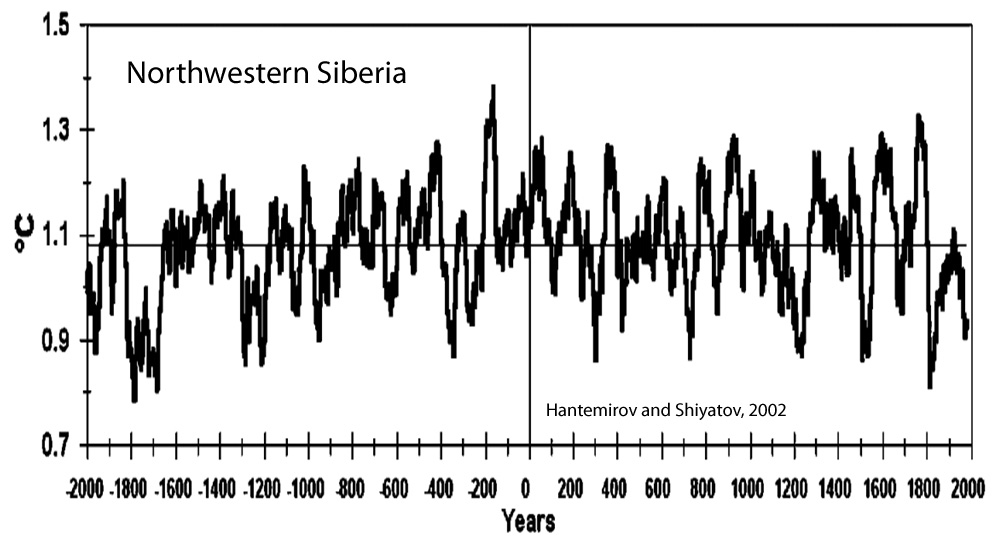
Hantemirov and Shiyatov, 2002
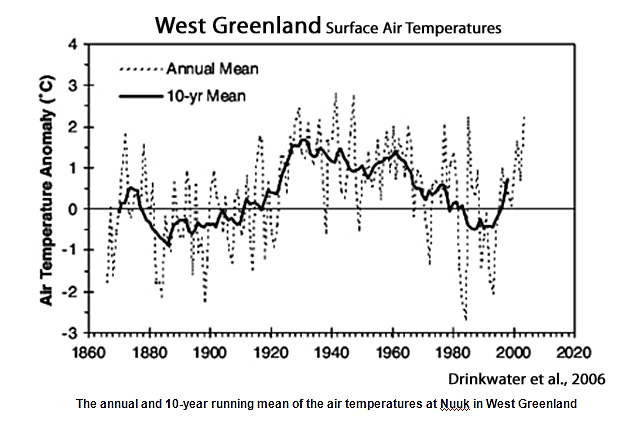
Drinkwater, 2006
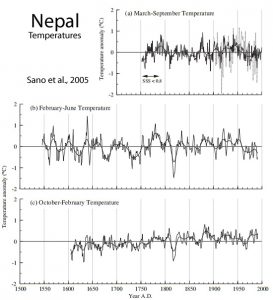
Sano et al., 2005
“March–September temperature was reconstructed for the past 249 years, which shows a warming trend from 1750s until approximately 1790, followed by cooling until 1810, then by a gradual warming trend extending to 1950, and a notable cold period continuing up to the present. No evidence of a consistent warming trend over the last century or two commonly appearing in higher latitudes was found in the present reconstruction”
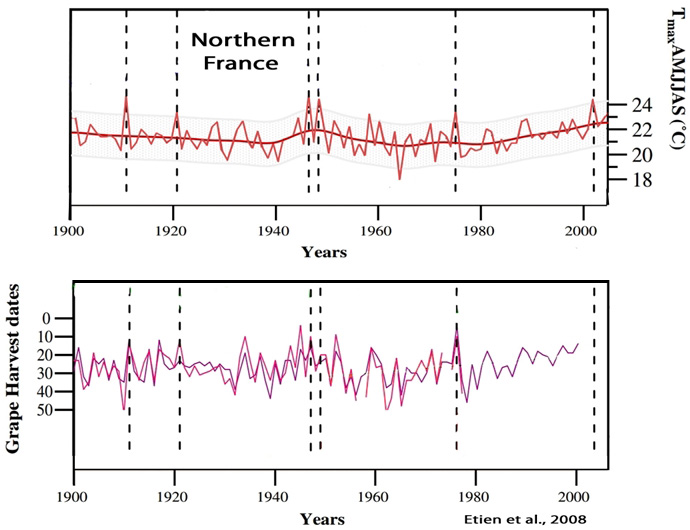
Etien et al., 2008
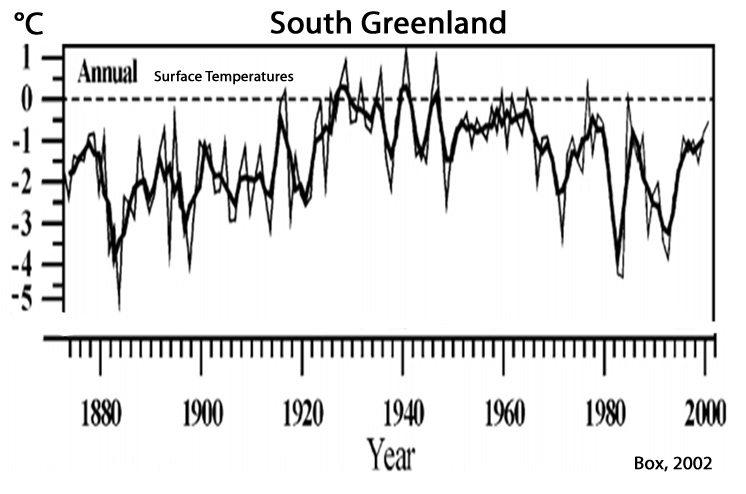
Box, 2002
“Temporal and spatial variability are analysed in Greenland instrumental temperature records from 24 coastal and three ice sheet locations. … The standard period 1961–90 was marked by 1–2°C statistically significant cooling.”
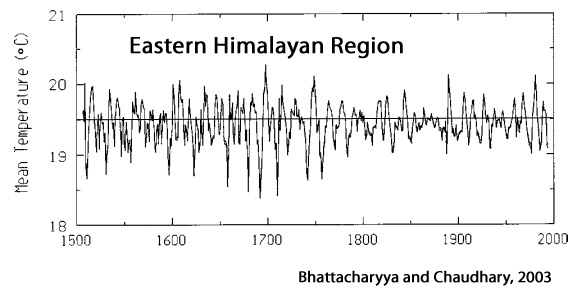
Bhattacharyya and Chaudhary, 2003
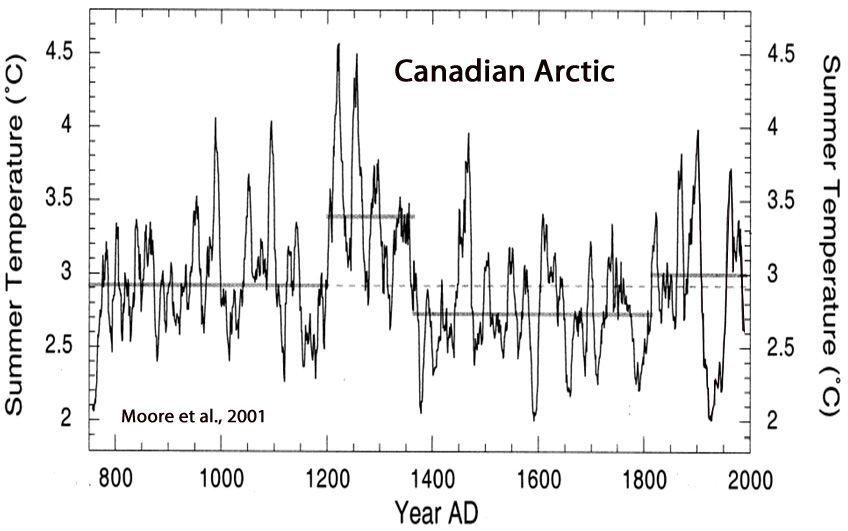
Moore et al., 2001
“Summer temperatures at Donard Lake [Canadian Arctic] over the past 1250 yrs averaged 2.9 °C. At the beginning of the 13th century, Donard Lake experienced one of the largest climatic transitions in over a millennium. Average summer temperatures rose rapidly by nearly 2 °C from 1195–1220 AD [+0.80 C per decade], ending in the warmest decade in the record (~4.3 °C).”
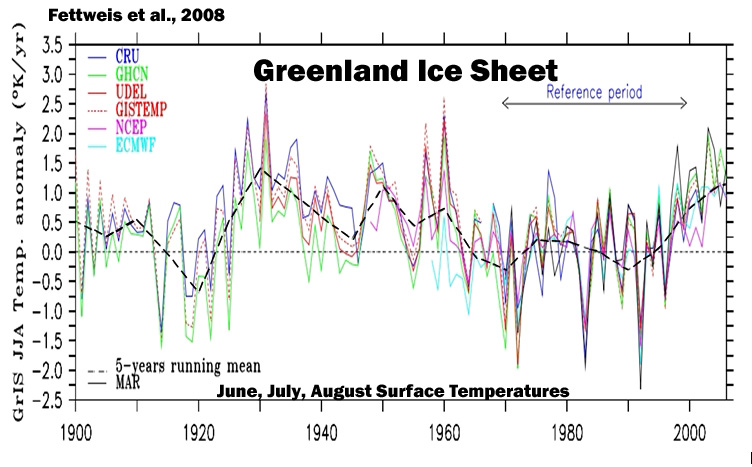
Fettweis et al., 2008
“The rate of warming in 1920– 1930 is the most spectacular as pointed out by Chylek et al. (2006). Finally, Greenland climate was colder around 1920 and, in the 1970s and 1980s. The temperature minimum (resp. maximum) seems to have occurred in 1992 after the Mont Pinatubo eruption (resp. in 1931). The warm summers of recent years (1998, 2003, 2005), associated with large melt extent areas (Fettweis et al., 2007), seem to be less warm than these of the 1930s, as also pointed out by Hanna et al. (2007). … The absolute minimum [surface mass balance] occurred around 1930 with a SMB anomaly near −300 km3 yr−1 . Secondary (minor) SMB minima appear to have occurred in 1950 and 1960, equalling the surface mass loss rates of the last few years (1998, 2003, 2006). … After the 1990s, the GrIS SMB decreases slowly to reach the negative anomalies of the last few years, although the summers of the 2000s were not exceptional compared to 70 yr ago“
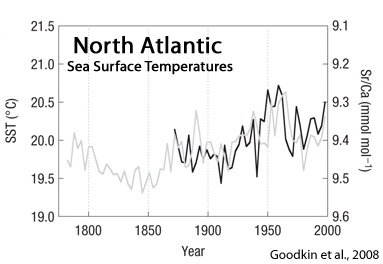
Goodkin et al., 2008
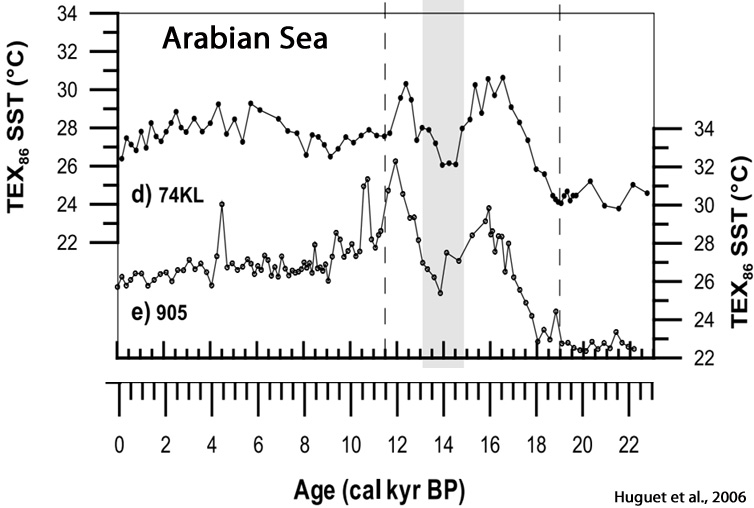
Huguet et al., 2006
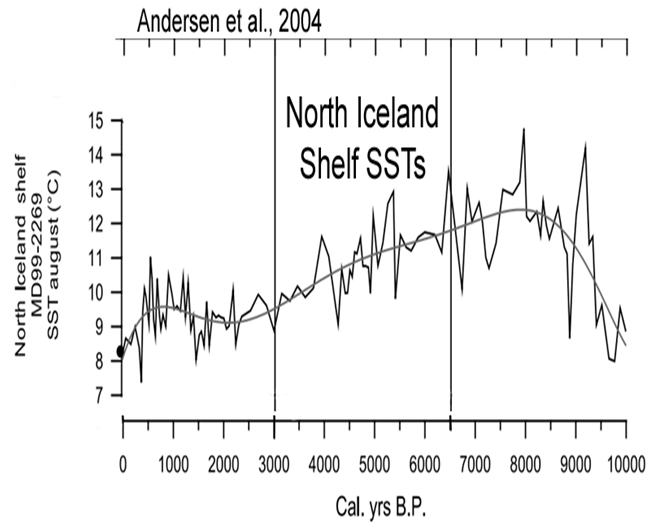
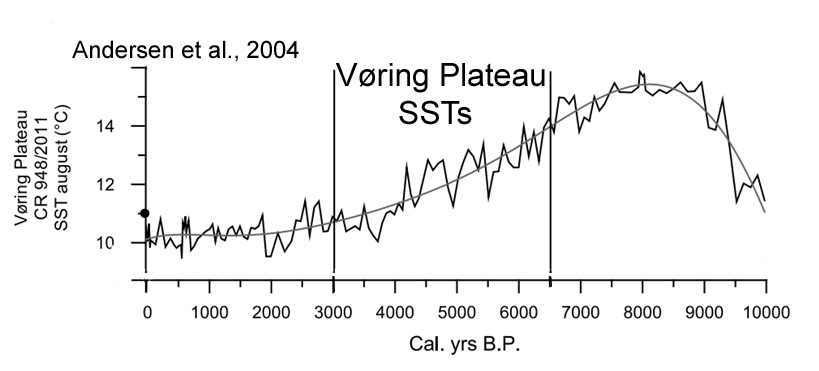
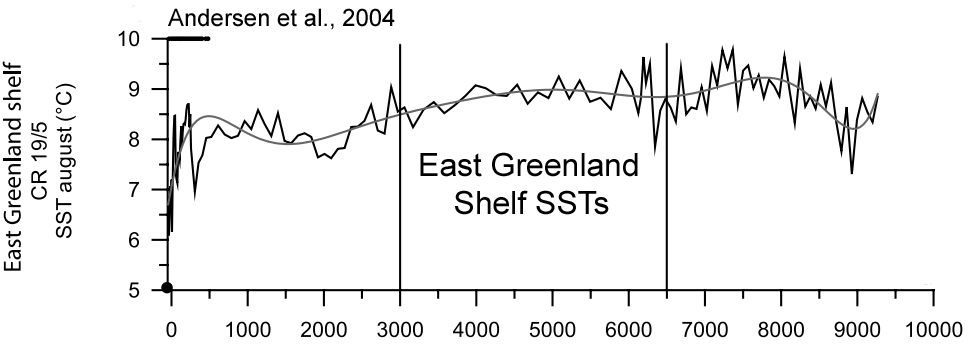
Andersen et al., 2004
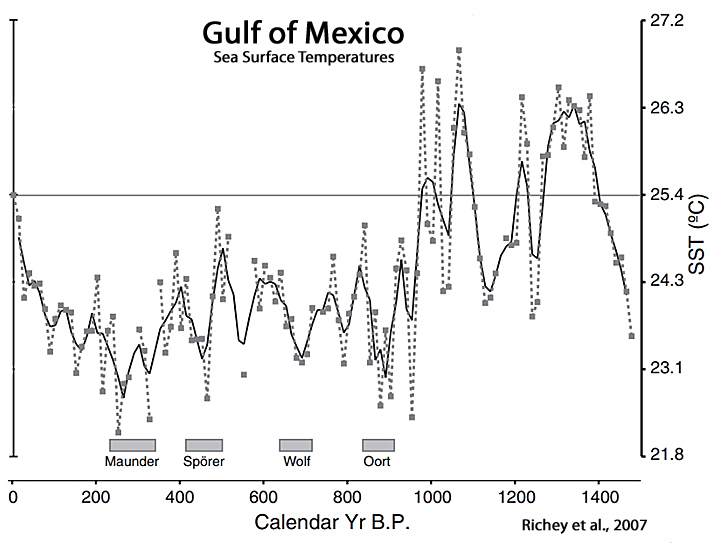
Richey et al, 2007
Jiang et al., 2005
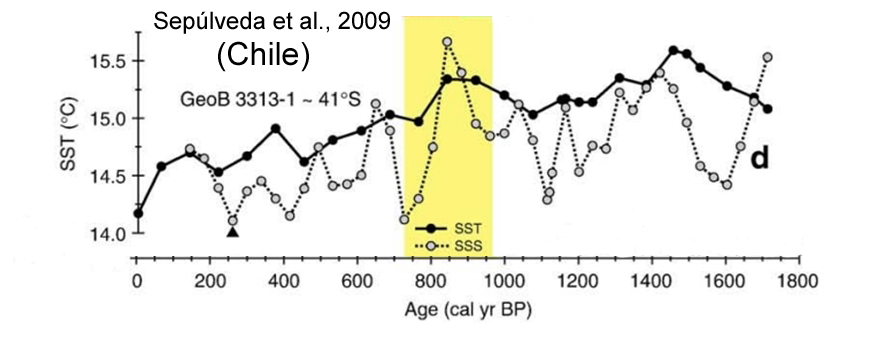
Sepúlveda et al., 2009
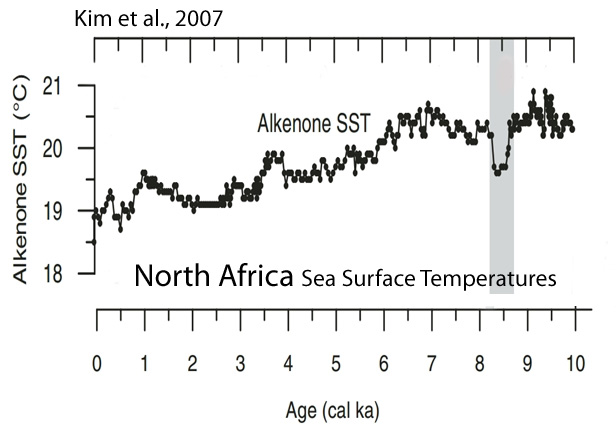
Kim et al., 2007
Viau and Gajewski, 2009

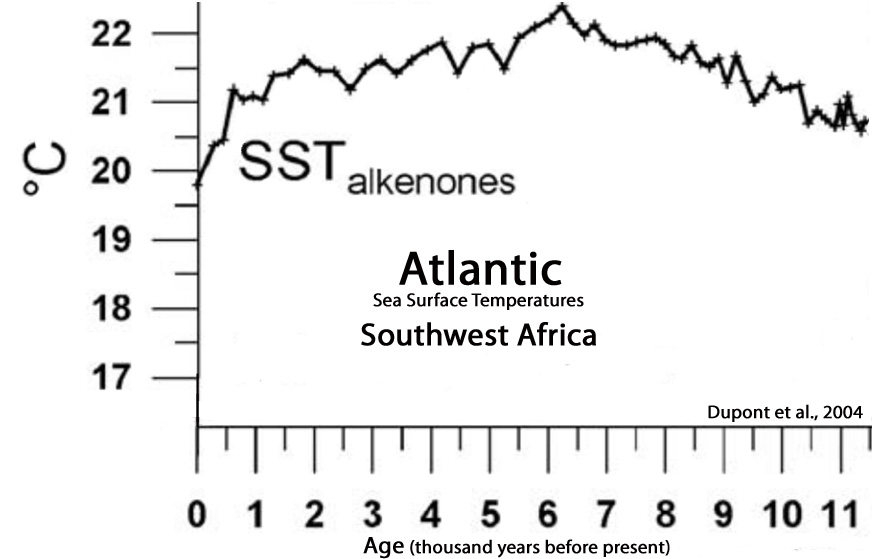
Dupont et al., 2004
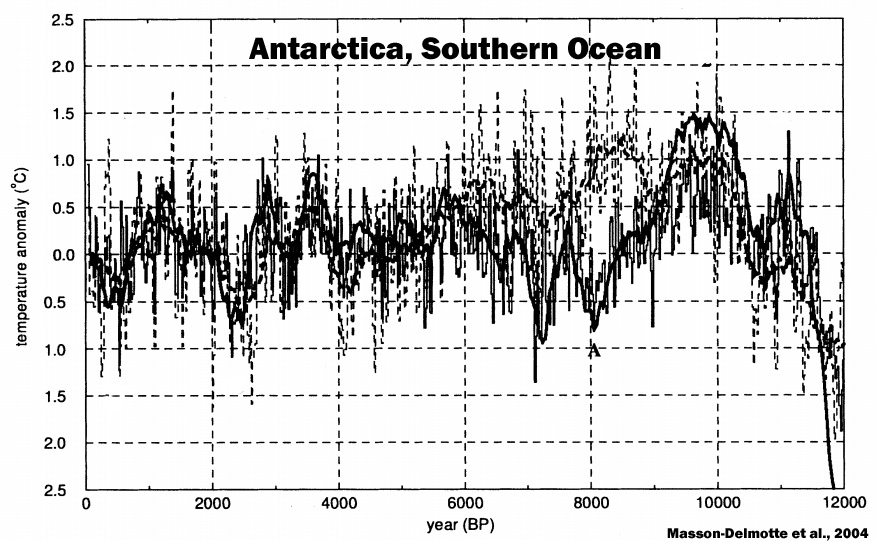
Masson-Delmotte et al., 2004
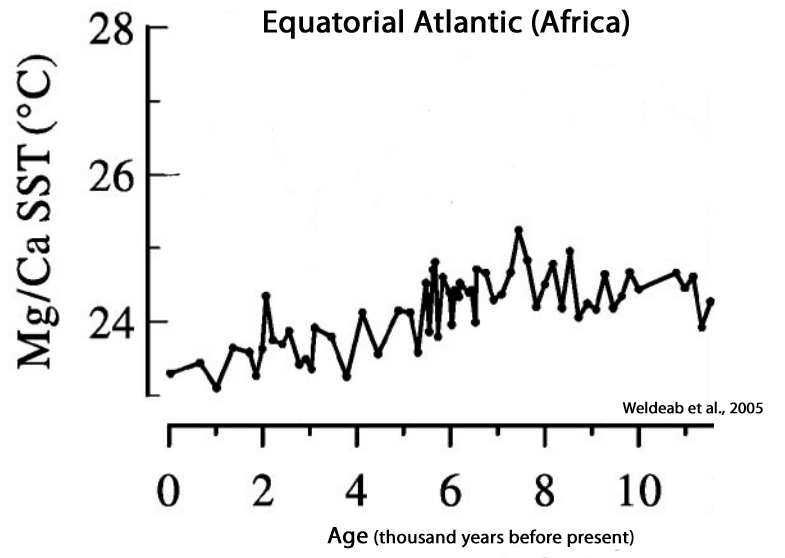
Weldeab et al, 2005
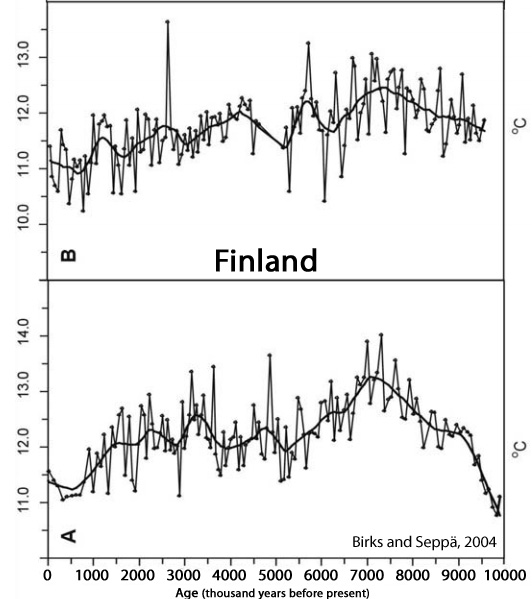
Birks and Seppä, 2004
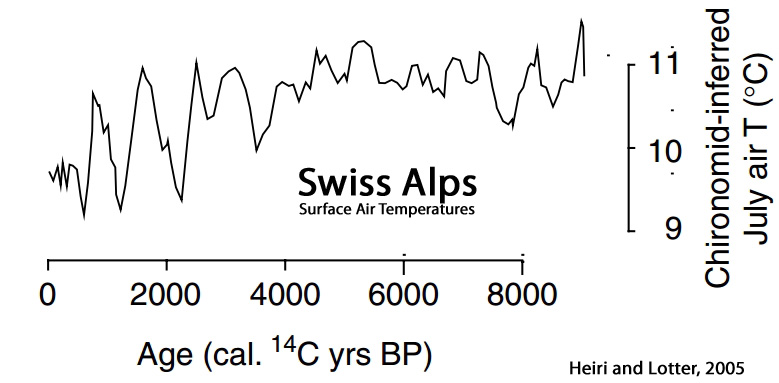
Heiri and Lotter, 2005
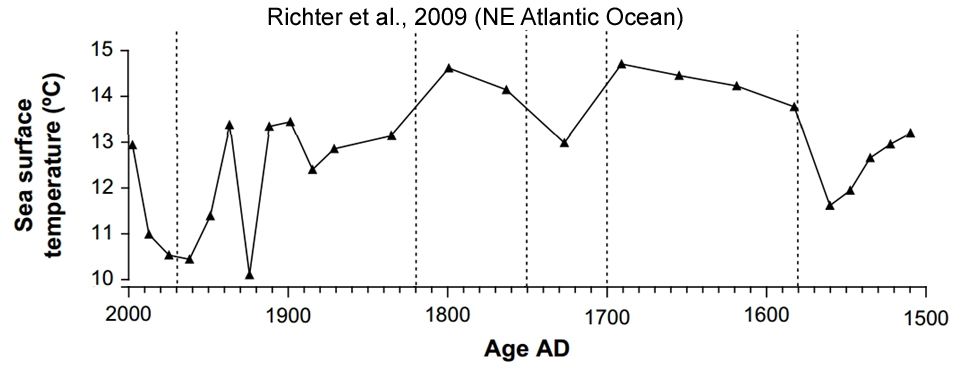
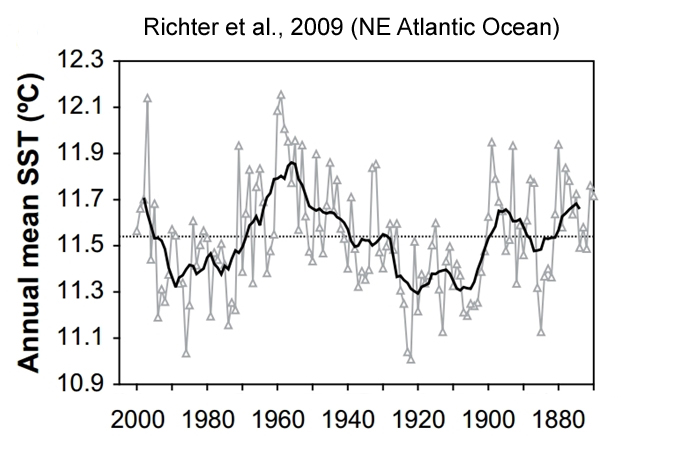
Richter et al., 2009
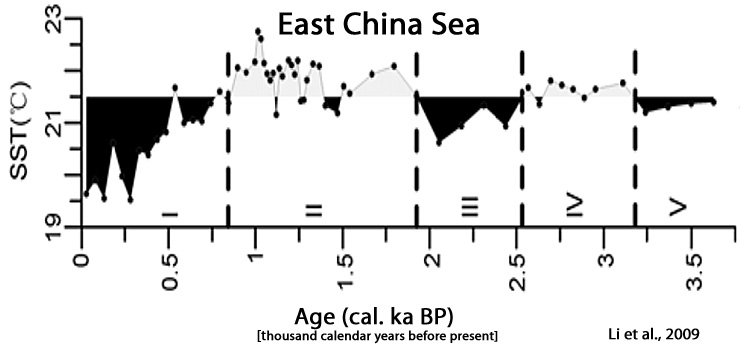
Li et al., 2009
“The highest temperature was 22.7°C which was recorded at 1.01 cal ka BP. … Cooling period from 0.85 cal. ka BP to present. SST declined obviously in this period, with the maximum decrease amplitude of 2℃. … No global climate warming due to the greenhouse effect since the Industrial Revolution occurs in the study area.”
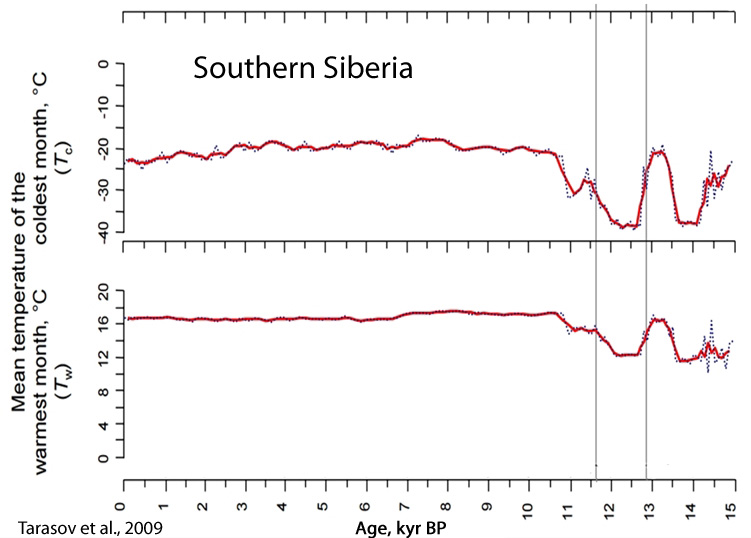
Tarasov et al., 2009


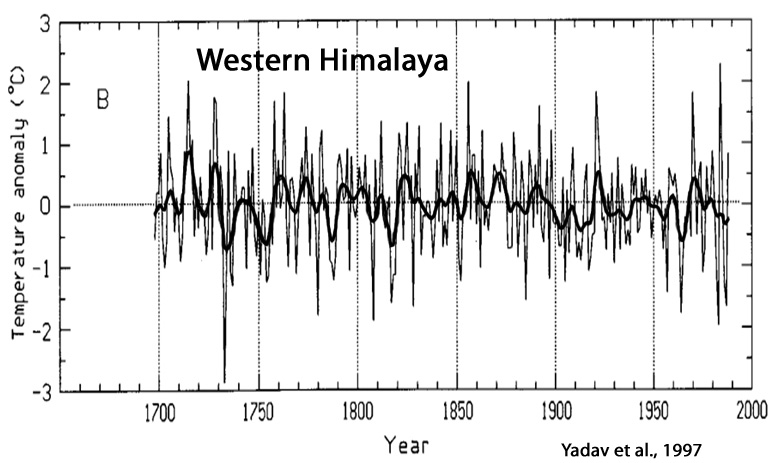
Yadav et al., 1997
“The most striking feature of the present reconstruction is the absence of any warming trend in the 20th century”
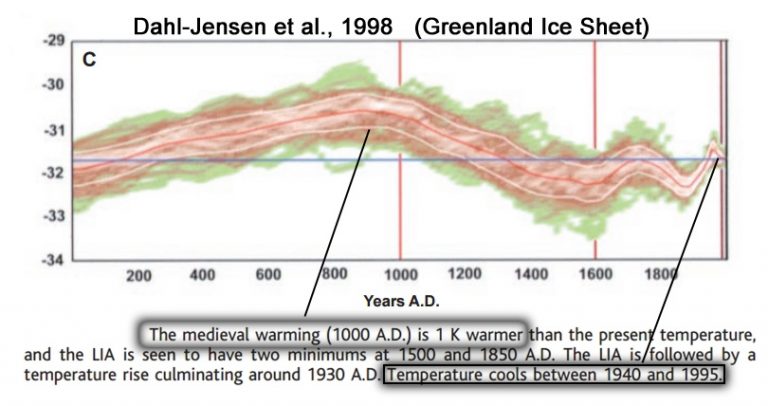
Dahl-Jensen et al., 1998
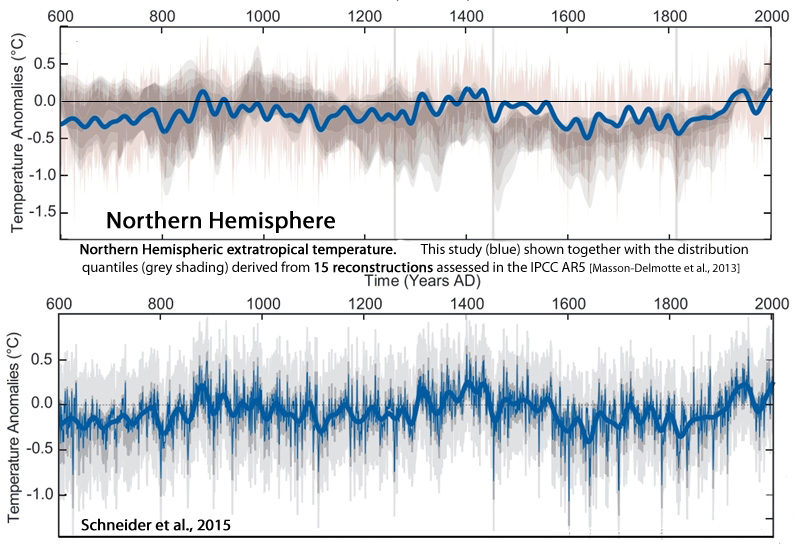



Thank-you Kenneth Richard excellent post!
Yet again more scientific papers showing the UN’s ideas appear as errors, away from reality, and that natural variations are totally in control of this planet.
These graphs illustrate magical properties of changing CO2 levels assigned to it the by the UN-IPCC is not apparent. That the effects of man’s CO2 generation (the infamous fingerprint) is missing, as CO2’s ‘forcing factor’ appears to be many times less than the IPCC’s assumptions, and may well not exist at all.
These graphs also illustrate that the process of science is not a list of known facts but an ongoing search for the truth in the reality of nature.
When all the parameters, their nonlinear interrelating variations and couplings are not all known, and this system is still being scientifically investigated then there is only research. At this juncture there is NO definitive answer.
When the truth is unknown, imaginative descriptions of it by those pretending to know are not winners or losers, they are only charlatans or fools.
Climate scientists of all persuasions need to learn to recite the words —
“At this time, we just don’t know.”
Outstanding compilation!
Shock and awe!
Todays article is sure to leave a mark.
Jun 15, 2017 HAHA!!! GLOBAL WARMING STUDY CANCELED, THE REASON WILL HAVE YOU ROLLING ON THE FLOOR LAUGHING!!!
American Lookout reports, In a perfect example of irony, a scientific research study that intended to study global warming was cancelled after encountering large amounts of ice. Breitbart reported, A global warming research study in Canada has been cancelled because of “unprecedented” thick summer ice. Naturally, the scientist in charge has blamed it on ‘climate change.’
https://youtu.be/MNn7lkO_dkM
Kenneth,
You may also be interested in these recent papers…
‘Internal and external forcing of multidecadal Atlantic climate variability over the past 1,200 years’
Authors: Jianglin Wang1, Bao Yang1, Fredrik Charpentier Ljungqvist2, 3, Jürg Luterbacher4, 5, Timothy J. Osborn6, Keith R. Briffa6, Eduardo Zorita7,
Available at —
https://www.nature.com/ngeo/journal/vaop/ncurrent/full/ngeo2962.html
Nature Geoscience (2017) doi:10.1038/ngeo2962
~~~~~~~~~~~~~~~~~~~~~~~~~~~
Research Article
Slowdown of Global Surface Air Temperature Increase and Acceleration of Ice Melting
Authors: A. Berger,Q.Z. Yin, H. Nifenecker, J. Poitou
DOI: 10.1002/2017EF000554
http://onlinelibrary.wiley.com/doi/10.1002/2017EF000554/abstract?
~~~~~~~~~~~~~~~~~~~~~
A hiatus in the tropopause layer change
Authors: Tao Xian, Yunfei Fu
DOI: 10.1002/joc.5130
Available at http://onlinelibrary.wiley.com/doi/10.1002/joc.5130/abstract?
[…] Read More: Almost 300 Graphs Undermine Claims Of Unprecedented, Global-Scale Modern Warmth […]
Nice to see all these regional graphs that contradict what we’re told we should believe. I’d like to see a compilation of all the regional temperature graphs that have been published in recent years, pro or con to the prevailing view. It may be asking a for a lot of research to put that together, but I think a non cherry picked set of graphs would be a more credible demonstration that although the earth appears to have been warming at a rate of around 1 degree F per century since the end of the Little Ice Age in the mid 1800s, there’s no convincing evidence that this warming is anything other than a natural process.
The thing to understand is that there is NO global climate!
There are only regional climates, and local climate effects.
[…] blog of the day is NoTricksZone, with a post on almost 300 graphs undermining claims of unprecedented, global scale modern […]
Fantastic, this should keep me occupied for a year or two.
[…] Kenneth Richard, June 16, 2017 in […]
[…] Fonte: notrickszone […]