Post-1940s ‘Agricultural Intensification’
Caused Deep Cooling, 400% Crop Growth
In a new paper published in Geophysical Research Letters, three MIT scientists assert that the human influence on the climate of the Central United States is dominated by agricultural activity rather than greenhouse gas (GHG) emissions.
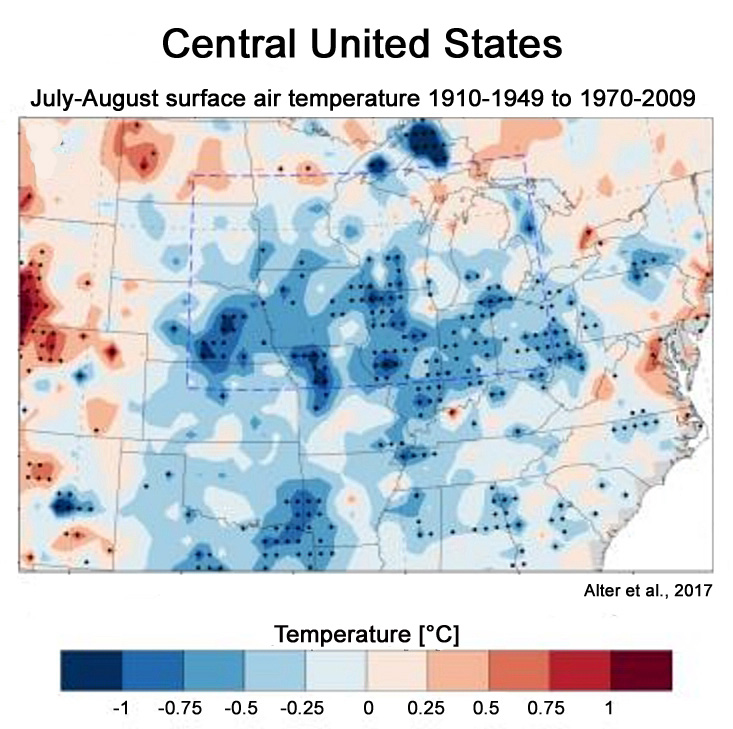
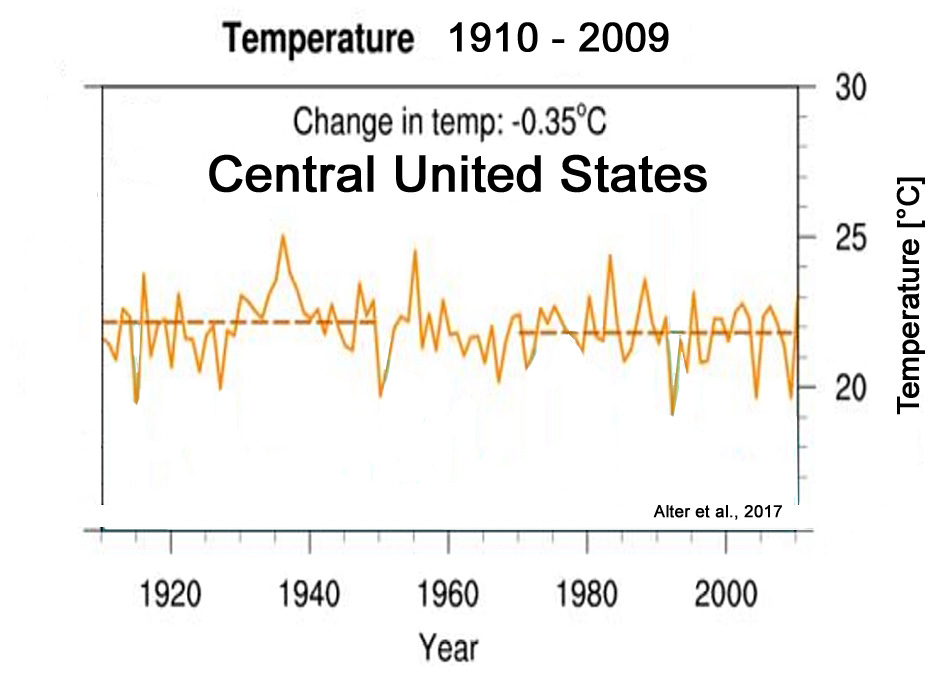
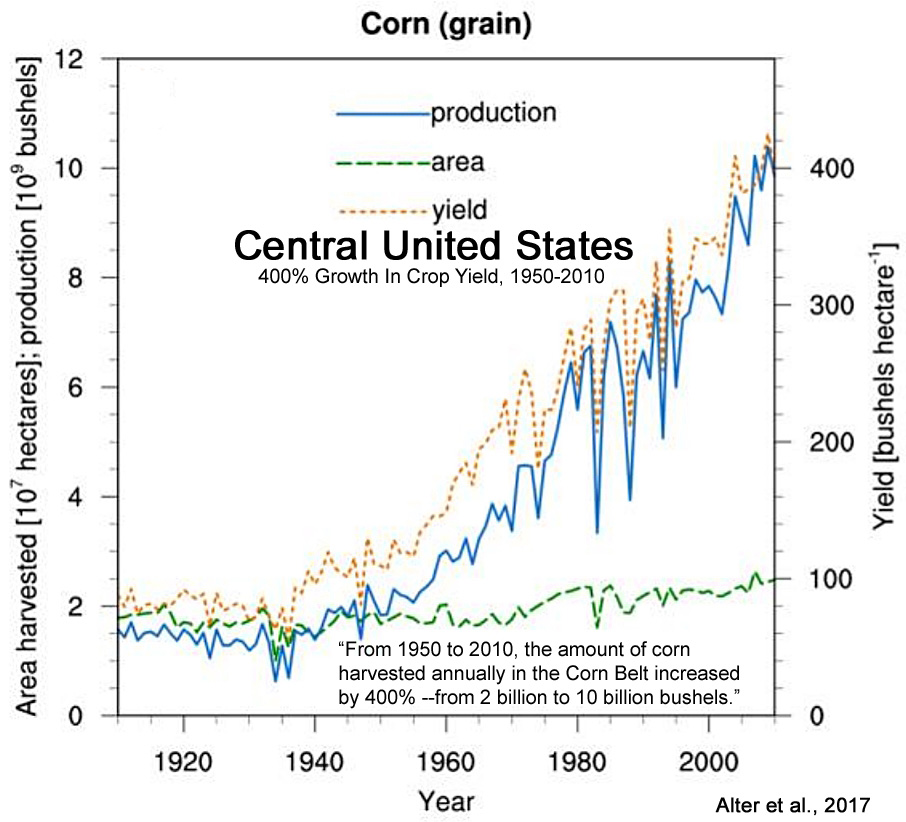
Human activity has caused a significant long-term cooling trend (-0.35°C between the 1940s and 2009) and higher rainfall totals via the mechanism of “agricultural intensification” – a photosynthesis-associated increase in the air’s water vapor or humidity levels due to an explosive (400%) increase in crop production and yield since the 1940s.
The authors assert that the human-caused post-1940s cooling trend and increase in precipitation dramatically conflict with climate model expectations which project a human-caused warming trend and decreasing rainfall with the advent of increasing GHG emissions.
From all appearances, the effects of the human influence on climate is still teeming with inconsistencies and contradictions.

Alter et al., 2017
Summary
“Observations and numerical simulations both suggest that agricultural intensification has cooled temperatures and enhanced rainfall.”
Climate Models Predicated On A Driving Influence For GHG Emissions…Are Wrong

“From 1910- 1949 (pre-agricultural development, pre-DEV) to 1970-2009 (full agricultural development, full-DEV), the central United States experienced large-scale increases in rainfall of up to 35% and decreases in surface air temperature of up to 1°C during the boreal summer months of July and August … which conflicts with expectations from climate change projections for the end of the 21st century (i.e., warming and decreasing rainfall) (Melillo et al., 2014).”
“The output from this subset of CMIP5 models [climate models predicated on CO2 emissions assumptions] indicates only small changes in rainfall (between -2% and +4%) during the summer in the central United States, which are much smaller than the frequency distributions of rainfall change from both the observational data and the agricultural intensification simulations. This implies that GHG [greenhouse gas] emissions may not have been a major driver of the observed changes in summer rainfall.”
“[T]he CMIP5 [climate model] results instead show an increase in temperature and a much subdued increase in specific humidity, which may be due to GHG-induced warming and subsequent increases in the water vapor holding capacity of the atmosphere, respectively. Thus, it seems that GHG emissions do not contribute greatly to the regional changes in summer climate that have been observed in the central United States.”
Mechanism: More Crops = More Water Vapor = More Cooling
“Within the regional climate model, an increase in photosynthesis for cropped areas leads to a decrease in stomatal resistance within those areas. This allows more water vapor to be released to the atmosphere through evapotranspiration (ET), specifically through transpiration. This increased flow of water out of the plants results in an increase in atmospheric moisture (humidity) over the same areas. Regarding the energy budget, the latent heat flux increases in tandem with ET, but the sensible heat flux decreases, resulting in temperature decreases over the cropped areas.”
‘Unprecedented Growth’ In Crop Productivity Since The 1940s

“Over the last century, the world has experienced unprecedented growth in cropland area and productivity (Ramankutty & Foley, 1999; Pielke et al., 2011). As part of this expansive agricultural development, the Corn Belt of the central United States – one of the most productive agricultural areas in the world (Guanter et al., 2014; Mueller et al., 2016) – experienced major increases in both corn and soybean production. For example, from 1950 to 2010, the amount of corn harvested annually in the Corn Belt increased by 400%, from 2 billion to 10 billion bushels (NASS, 2016).”
“[S]ince vast tracts of land worldwide have experienced similar booms of agricultural productivity in recent decades, it is possible that other areas of the world have experienced similar climatic effects due to agricultural intensification, especially in light of recent observational connections between extreme temperatures and agricultural intensification in other intensely cropped regions (Mueller et al., 2017).”


[…] Read more at notrickszone.com […]
This paper provides a significant basis for Tony Heller’s consistent observations that summer temperatures in the US have declined since the 1930s, and further calls into question the official NOAA temperature record.
You should know that the claim is an argument of the AGW club. „Look, this is where the lost heat went to! Without the yield improvement we would see another 0.1 degrees global warming. In future there will be a yield decrease due to GW which will drive temps higher than calculated. You see, it‘s even worse than we thought!
The paper claims that more water vapour equals more cooling. Yet traditional climate models claim that more co2 leads to more water vapour which leads to warming. A direct contradiction. These so called climate scientists are probably unable to tell the time of day, nevermind work out how the climate works.
Evaporating water has a different effect than water vapor in the atmosphere (which can also move around). You should be able to differentiate between these things when you are trying to criticize climate scientists.
You are a lowly computer hack, seb
You have no idea of how H2O functions in the atmosphere..
STOP PRETENDING !!
I’ll suggest an alternative.
Most of those counties lost population aspeople fled the family farm to cities and agribusinesses consolidated farms.
Less people. Less warming. And I’m not blaming CO2. I’m talking waste heat etc.
https://sunshinehours.files.wordpress.com/2012/03/countypop_shrinking_counties.png
The “official” NOAA temperature record has an Orwellian ring to it.
Newspeak is alive and well- it is called climate “science”.
Nothing to do with the AMO, though..
Can’t mention the AMO 😉
https://notrickszone.com/wp-content/uploads/2017/09/Global-Ocean-AMO-Temperature-Correlation-1950-to-2014-Dieng-2017.jpg
Dieng et al., 2017
http://onlinelibrary.wiley.com/doi/10.1002/joc.4996/full
We can note that the correlation between GMST [global mean surface temperature] trends and AMO trends is quite high. It amounts 0.88 over the whole time span. At the beginning of the record, the correlation with PDO trends is also high (equal to 0.8) but breaks down after the mid-1980s. The GMST and AMO trends shown in Figure 6 show a low in the 1960s and high in the 1990s, suggestive of a 60-year oscillation, as reported for the global mean sea level by Chambers et al. (2012). Thus the observed temporal evolution of the GMST [global mean surface temperature] trends may just reflect a 60-year natural cycle driven by the AMO.
“an increase in photosynthesis for cropped areas leads to a decrease in stomatal resistance within those areas. This allows more water vapor to be released to the atmosphere through evapotranspiration “
Not necessarily so while CO2 levels are climbing. That gives a decrease in stomatal area/density, so gives LESS evapotranspiration.
This study seems to conflict with Kunkel et al. (1996), which found that evaporation from corn agriculture significantly increased the “sensible heat” of Midwest summers, including the deadly 1995 Chicago heat wave. The study is available here: (http://journals.ametsoc.org/doi/pdf/10.1175/1520-0477(1996)077%3C1507:TJHWIT%3E2.0.CO;2. I wrote a post on it last year noting the irony that increased corn production due to the Renewable Fuel Standard, a program touted as a climate mitigation policy, was contributing to Midwest “summer swelter”: https://cei.org/blog/does-global-warming-policy-increase-summer-swelter. Do these studies come to opposite conclusions or there is a way to reconcile them?
U. S. farming has been an on-going process of improvement in equipment, practices, and seeds.
Field workers and animals were replaced by equipment, and output increased.
Read the following for a simple introduction:
Farming in the 1930s
It’s my understanding that NVAP data shows as atmospheric CO2 increases, water vapor decreases; exactly opposite what climate models predict because they assume water vapor is a net positive feedback; more wv, more warming, more wv, more warming…..the ubiquitous “runaway greenhouse” effect.
After reading this paper, my head is spinning from all the contradictions.
Svensmark’s theory has been reaffirmed. It now concludes that the sun’s impact is 5+ times greater than recognized by the current crop of computer modelers.
But it’s still an interaction with the universe (via cosmic rays). The sun activity level modulates the incoming cosmic rays and that interaction affects the low cloud cover. The amount of low cloud cover impacts the planet’s temperature.
Clouds are causing climate, not human activity.
The Climate Industrial Complex continues to collapse.
The idea that agricultural intensification adds moisture to overall conditions is consistent with observations that clearcutting the Amazon jungle causes drought and turns the barren land into dried mud.
Drying in the Amazon rainforest – what could it mean for climate …
https://www.carbonbrief.org/drying-in-the-amazon-rainforest-what-could-it-mean-for…
Oct 22, 2013 – The southern reaches of the Amazon rainforest are drying up – a little bit more each year. That’s according to a new study which finds that since 1979, the region’s dry season has got about a week longer each decade. If these outer edges of the rainforest spend too much time each year exposed to dry …
[…] […]