Hat-tip: Die kalte Sonne here.
Over the years we’ve all heard the dire predictions of snow becoming a thing of the past and that especially in the Alps the ski industry would in large part disappear. Warmer temperatures would put an end to snow as we know it.
Yet an analysis of the data tells a very different story, according to Austrian ski industry researcher Günther Aigner in a video presentation dubbed: Will the Arlberg see snow disappear? An analysis of historical temperature and snow datasets:
In the video Aigner shows what’s going on concerning winters in the Alps. He begins by presenting some predictions of disappearing snow made by renowned scientists such David Viner and Mojib Latif. Other scientists such as Andreas Reiter, a future studies researcher, predicted Tirol would soon become mostly just a wine region. Other scientists made even more absurd predictions, Aigner shows.
Yet these bold prognoses are now proving to be deceptive at best, and bordering on outright fraud at worst.
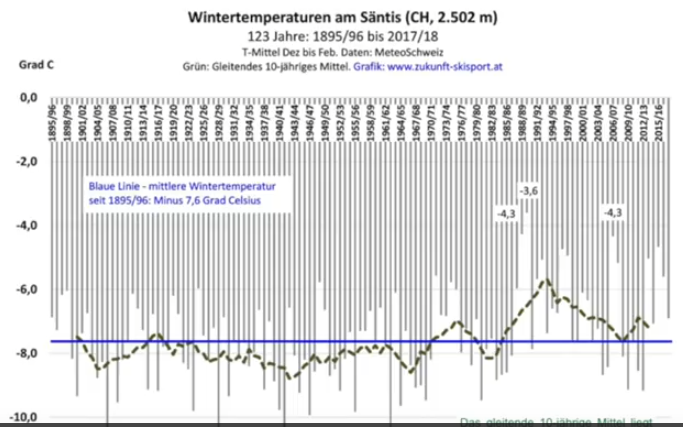
At the 7-minute mark Aigner shows the 123-year temperature series for Säntis ski area, 2500 m elevation in Switzerland:
Falling winter temperatures
Though we see that ther overall trend since the 1940s has been upwards, the trend over the past 30 years has been downward. The Alps have been cooling, and not getting warmer. The situation, Aigner says, is simialr at all the stations he’s looked at in the Alps region.
Aigner notes that for the Säntis station, the 10 year running average is currently only 0.4°C above the long-term mean.
Looking at the last 48 winters (since 1970) for Arlberg, Aigner points out the current level for the 10-year running mean is precisely where it was almost 50 years ago (see 11:55). Aigner summarizes:
There’s been no significant change in winter temperatures from 1971 – 2018.”
1.4°C colder than 30 years ago
At the 13-minute mark, Aigner looks at the past 30 years. Here the result is nothing short of surprising.
The winters have gotten colder not only at Galzig, but also at every mountain station that I have examined in the eastern Alps, western Alps and in the German central mountains.”
At the Galzig station the mean temperature has in fact dropped 1.4° C over the period!
Snow depths unchanged
Next Aigner examines maximum snow levels in the Alps (15:06). Here as well maximum snow depth has seen so significant trend. And this year there’s a strong possibility that a new record snow depth will be set, which would break the record set back in 1941. The Austrian researcher summarizes:
At a single glance we can say the annual maximum snow depth over the past 92 years has not changed at all.”
Aigner also examined “fresh snow” amounts, i.e. the new snow one finds each morning at 7 a.m. and whose amounts are tallied up (18:38). Over the past 72 years we see total accumulated snow fall ranged from just over 300 cm to over 1300 cm. The 10-year running average here as well shows no significant trend change.
Winters in the Alps today as long as 75 years ago
Finally Aigner looks at the dataset for days with snow on the ground for Lech am Arlberg (20:34) going back to 1946. The location sees snow on the ground an average of 196 days per year. Once again, Aiger here says: “No change at all.”
Last winter was slightly above normal.
Interestingly days without snow on the ground were more common back in the 1940s and 50s! Overall, Aigner summarizes, winters are just as long today as they were 75 years ago. The length of the ski season has also not changed over the past 72 years.
Aigner then shows the stats for ski resort Zürs, where the trends behave similarly.
What has changed, Aigner shows, are the June-July-August temperatures (29:34). Here we see that they ‘ve increased since 1975. Yet when looking at the chart, most of the increase occurred between 1975 and 1995.
At 31.45 Aigner shows why summers have warmed up in the Alps: the number of hours with sunshine rose a whopping 25%.


The only thing David Viner is renowned for is saying, some 10 years ago, that
“Snow would become a thing of the past and that in future children won’t know what snow is”
That prediction has come true. Not.
Viner the Whiner.
Well, not unlike predictions from certain skeptics that we would see temperatures 2+ degrees below average by now (also made 10 years ago). So true, Not.
No doubt, it is easy to find crackpots. But the issue is: what are the projections of the mainstream of the “two” sides. For the AGW crowd, respected analysts — quoted as experts and scientists by MSM — have made tons of wrong projections. Despite their errors, they keep on being regarded as spokespeople for the CAGW camp, and supposedly this camp consists of the 97% of scientists. When I read from Skeptics — Watts, Christy, Spencer, McIntyre, Curry, and even Heller — I am not seeing anything like a projection of -2 degrees in ten years.
Nice one, Pierre – “Other sicnetists”.
That probably explains Climate Science, it’s the domain of sicnetists.
97% of sicnetists believe in global warming is the correct slogan.
As for SebastianH he will be along shortly to dispute the article. He is definitely an other sicnetist.
If I am allowed to comment … Not much coming through moderation these days.
Not the alps, but snow season in North America is showing a decrease:https://www.epa.gov/climate-indicators/climate-change-indicators-snow-cover
Everything came through, must have seen a cached version of the site. So please ignore 😉
Oh, so now you start whining like a 5 year old.
PATHETIC. !!
Funny how the epa data differs from the source data. 😉
https://climate.rutgers.edu/snowcover/images/namgnld_season1.png
Does this guy ever troll anywhere else? He seems to be on here incessantly spouting BS.
From 1987 onwards, which represents a true climate reading of 30 years’ duration, the snow cover is increasing.
Statistics are a double-edged sword. Surely you weren’t intending to cut yourself, but you did.
The major problem is the utter belief in the climate models.
Thankfully most good meteorologists understand the limitations of models as they often see weather models (which like the climate models are based on tweaked known physics and mathematics) fail. Meteorologists know that these models are very inaccurate and imprecise in many areas of the world for forecasts greater than about a week. The long range weather models (seasonal and longer) often get huge weather features’ evolutions wrong — the longer the time period the worse they are.
No doubt Andreas Reiter, David Viner and Mojib Latif based there prognostications on climate model projections. Dumb idea when the models are so poor in accuracy, and just generally poor.
Have any of these guys ever confirmed that they were wrong and apologized? I doubt it, for that would burst their hubris, humble is not in their personal lexicons. However nature, pure and simple, has defeated their predictions. Nature not CO2 rules the climate, just as it rules the weather.
Nature has more imaginative ways of controlling this planet than humans have the wit to understand.
Same amount of skiing, warmer, sunny summers in tne mountains. Sounds terrific to me.
… [Trackback]
[…] Find More Informations here: notrickszone.com/2018/02/28/latest-data-show-winters-in-european-alps-are-cooling-proving-climate-scientists-wrong/ […]
Proving climate sicnetists wrong is not difficult.
Proving ignorant politicians wrong is much harder.
AGW caused “hot” snow in Venice, Corsica, Capri…
…. people DYING of the cold.
https://www.express.co.uk/news/weather/925283/snow-weather-latest-beast-from-east-spain-france-italy-europe-siberian-winter
But you can bet our resident trollette is nice and warm in his fossil fuel heated basement.
How are the bats in Australia? Dying because of the heat wave?
https://www.thetimes.co.uk/article/heatwave-kills-off-australia-s-flying-foxes-q6l5qn0z2
How many people died because of heat waves in Australia?
http://www.abc.net.au/news/2018-01-18/heatwaves-australias-deadliest-hazard-why-you-need-plan/9338918
If cold weather is a sign for you that AGW isn’t real, than hot weather must be a sign that it is. Right?
Heat waves in Australia are nothing new. They were known in the early years of the colony. Read the account in this diary, beginning on page 111, with the account of dying bats on page 113. http://setis.library.usyd.edu.au/ozlit/pdf/p00044.pdf
“Cold waves” are nothing new in Europe either. I like how everyone is declaring heat in Australia as completely normal and a cold week in Europe is “definitive proof for AGW not being real” for some here 😉
Poor seb, triggered yet again.
Its like continually pretending to throw a ball for a young puppy. !
Except the puppy eventually learns. 🙂
Provide PROOF for AGW, come on… we are waiting
Still waiting for you to provide one single piece of empirical evidence that enhanced atmospheric CO2 has ANY WARMING EFFECT WHAT-SO-EVER.
You remain TOTALLY EMPTY of any scientific support for the very basis of your brain-hosing.
And your PATHETIC ATTEMPTS at avoiding the issue by distraction and side-tracking, and running around like a headless chook, are a continue cause for extreme mirth for all.
*yawn* AndyG55, when will you learn that proofs don’t exist in physics?
AGW is the best and only explanation for what is happening, what we can measure and observe. Come up with a better explanation that doesn’t involve perpetuum mobiles and I’ll consider changing my mind. So far, nothing. Skeptic’s really have nothing. Calling data fake and fantasy physics is all you got.
Let’s see if this triggers a reply with lots of capital letters from you, “puppy” 😉
Poor seb, the perpetuum thing comes ONLY from your PROVEN total ignorance of physics. (see elsewhere, where you don’t even know the units of ‘work’) So hilarious.! 🙂
It is YOUR fantasy, based on YOUR ignorance.
You STILL cannot produce one single piece of scientific evidence for atmospheric CO2 warming oceans, atmosphere or anything.
Proofs and evidence certainly don’t exist in YOUR wonky version of fizzics/psyence. !!
“AGW is the best and only explanation for what is happening,”
AGW is NOTHING but a fantasy based on ignorance.
No wonder it appeals to your headless chook mentality.
Sub zero CET means for the last day of the meteorological winter (28th or 29th Feb)
1783: -0.1
1785: -3.8
1786: -0.9
1795: -1.0
1796: -0.3
1800: -0.2
1816: -0.5
1866: -3.2
1875: -0.3
1877: -1.0
1881: -0.1
1886: -0.3
1904: -2.9
1929: -1.7
1946: -0.8
1955: -2.3
2018: -3.6
Cold wave are just SO common for the end of February?
No, Sebastian, no one is saying that cold waves is anything new in Europe. The argument I hear is that cold waves show CAGW is not unfolding as projected. A cold wave or a heat wave is proving nothing, except that we are not on a unimodal path in one direction.
https://www.smh.com.au/national/death-toll-soared-during-victorias-heatwave-20141112-9ubd.html
“it was not possible to say how many of the deaths had been brought forward by days or weeks because of the extreme heat.
“Nor is it possible to say how many cases the death was totally unexpected and due principally to the effects of the heatwave”
“We can not tell you who these people were, what they died from, or where they lived,” Dr Carnie said.
OOPS , seb misses yet again.
Hot weather in Australia is a sign of NATURAL CLIMATE.
Nothing has “CHANGED”. Note the large downward slope in “maybe” heat related death with a single anomaly in 2009
Hottest period in Australia was the late 1800’s-1910.
UAH Australia for last 20 years…
https://s19.postimg.org/dbjwm4dwj/UAH_Australia.png
Notice any AGW ??
Yes, I notice “any AGW”:
https://imgur.com/a/Qd7hz
Ahhh.. the human AGW fingerprint of ADJUSTMENT.
Be it from BOM, or NOAA/GISS
Thanks for drawing that to EVERYBODY’S attention. 🙂
KNMI is a RABID AGW propaganda site.
The ONLY so-called scientist at KNMI is Geert Jan van Oldenborgh, who is a RABID AGW NUTTER? ACTIVIST. !! Real science is NOT in his realm.
Some of the “climate change” attributions that crazed goose has come up with, even YOU would laugh at, that is how ABSURD they are.
The WARMEST period in Australia was the late 1800’s to 1910. Even BOM admits that
Shows just how concocted the KHMI NON-data is.
DNFTT
The heat waves during the Federation Drought (1895-1903), when there could be little global warming due to human CO2 emissions. As Jo Nova points out:
“The BOM don’t often mention all their older temperature data. They argue that all the recordings then were not taken with standardized equipment. The BOM prefers to start long term graphs and trends from 1910 (except when they start in 1950 or 1970, or 1993).”
From Don Garden’s excellent and well researched book (Droughts, Floods & Cyclones: El Niños that Shaped Our Colonial Past) CHAPTER THIRTEEN: THE FEDERATION DROUGHT OF 1895-1903,EL NIÑO AND SOCIETY IN AUSTRALIA.
“Two extreme heatwaves occurred in January 1896 and in the heatwave summer of 1897-98. During the 1896 heatwave, furnace-
like winds from central Australia pushed temperatures well into the forties Celsius across much of the eastern half of the continent, setting new records and causing great suffering from heat and diseases, and numerous deaths. Conditions were particularly bad in outback New South Wales where there were reports of heat up to 52ºC. The town of Bourke had an average over three weeks of 44°C, including four consecutive days of 48°C. Those who could had fled Bourke by train, but some 160 people
died of heat and disease. The summer of 1897-98 was even hotter and windier in parts of eastern Australia. Many towns ran short of water and there were more deaths from heat and outbreaks of typhoid. In New South Wales the death rate increased by more than 20 percent over these weeks, and was particularly high among infants.”
SebastianH wrote:
Probably less than the number who will or have died in Europe as the result of the recent cold spell, given the past 6-month mean temperature anomaly and low population density of the areas most affected by the highest temperatures:
http://www.bom.gov.au/jsp/awap/temp/index.jsp?colour=colour&time=latest&step=0&map=meananom&period=6month&area=nat
Seb, the link you provided regarding heatwaves stated this : A history of deadly heatwaves
“Australia has a long history of deadly heatwaves. The table below shows numbers of deaths and death rates per 100,000 population from episodes of extreme heat in Australia by decade, reaching back to 1844.
The information comes from PerilAUS, a database that records the impact of natural hazards reaching back to the early days of Australia’s European settlement
The death rate is the number of deaths per head of population in the country at that time, and was consistently, significantly higher between 1890 and 1939 than for any period before or since.”
Heatwaves occurring in Australia are hardly considered a new phenomenon.
If you are worried about our flying fox bat population you can check on their status here
http://www.environment.gov.au/biodiversity/threatened/species/flying-fox-monitoring – Last census count total of all fox bats Aug 2017 was 669000 and on a side note, flying fox bats have endured many heatwaves in the past as well as the present.
Winter snow of Eurasia is an increasing trend according to this graph (1967-2017) from Rutgers University Global Snow Lab.
https://climate.rutgers.edu/snowcover/chart_seasonal.php?ui_set=eurasia&ui_season=1
A little bit of compensating mathematics will fix that right up. The house always wins in this game.