46 New (2018) Non-Warming Graphs Affirm
Nothing Climatically Unusual Is Happening
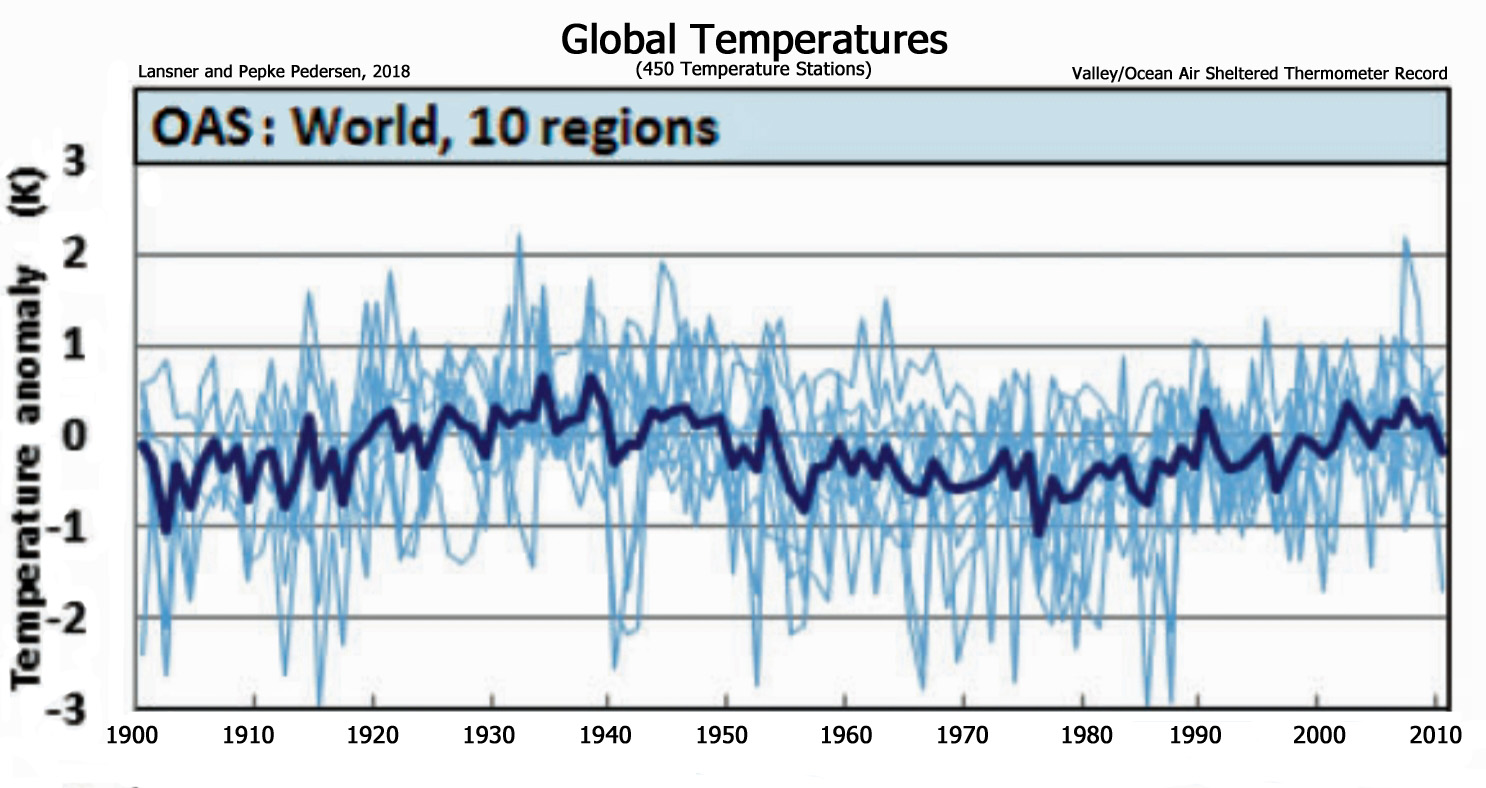
Image Source: Lansner and Pepke Pedersen, 2018
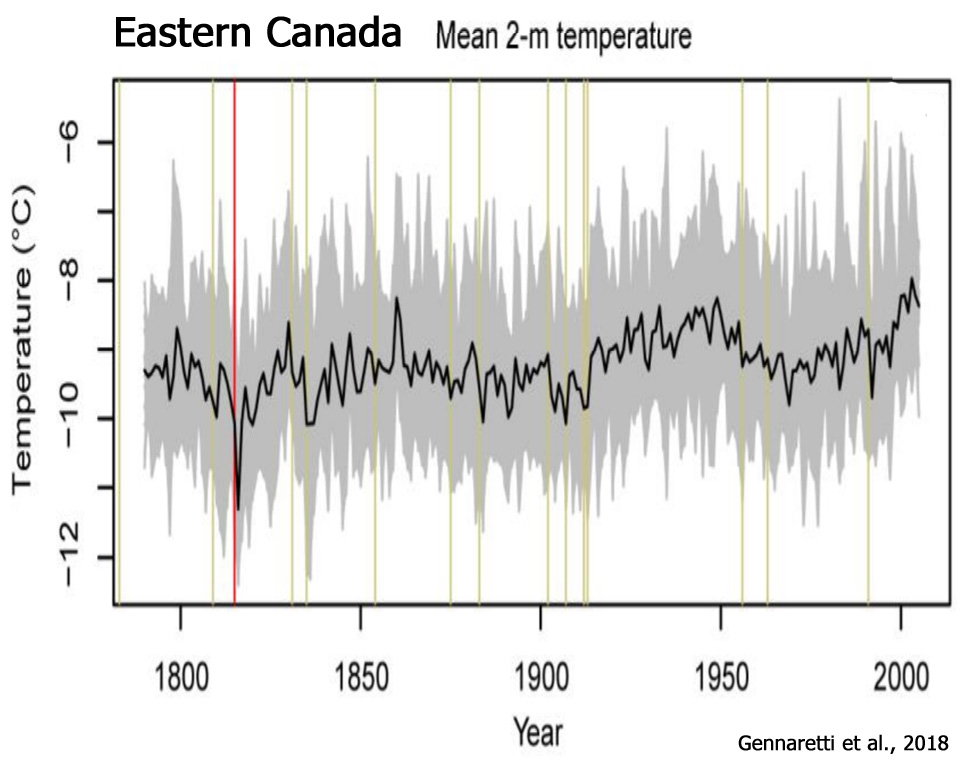
During 2017, there were 150 graphs from 122 scientific papers published in peer-reviewed journals indicating modern temperatures are not unprecedented, unusual, or hockey-stick-shaped — nor do they fall outside the range of natural variability.
We are less than 3 months into the new publication year. Already 46 new graphs from 40+ scientific papers undermine claims that modern era warming — or, in some regions, modern cooling — is climatically unusual.
2018 and 2017 Non-Hockey Stick Graphs (~200)
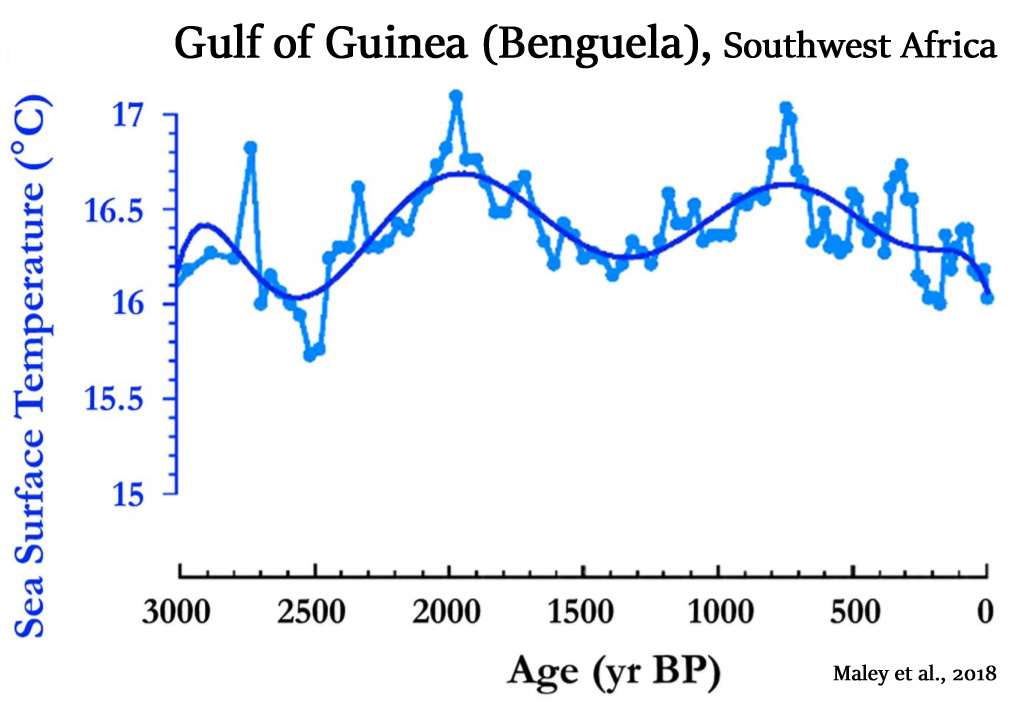
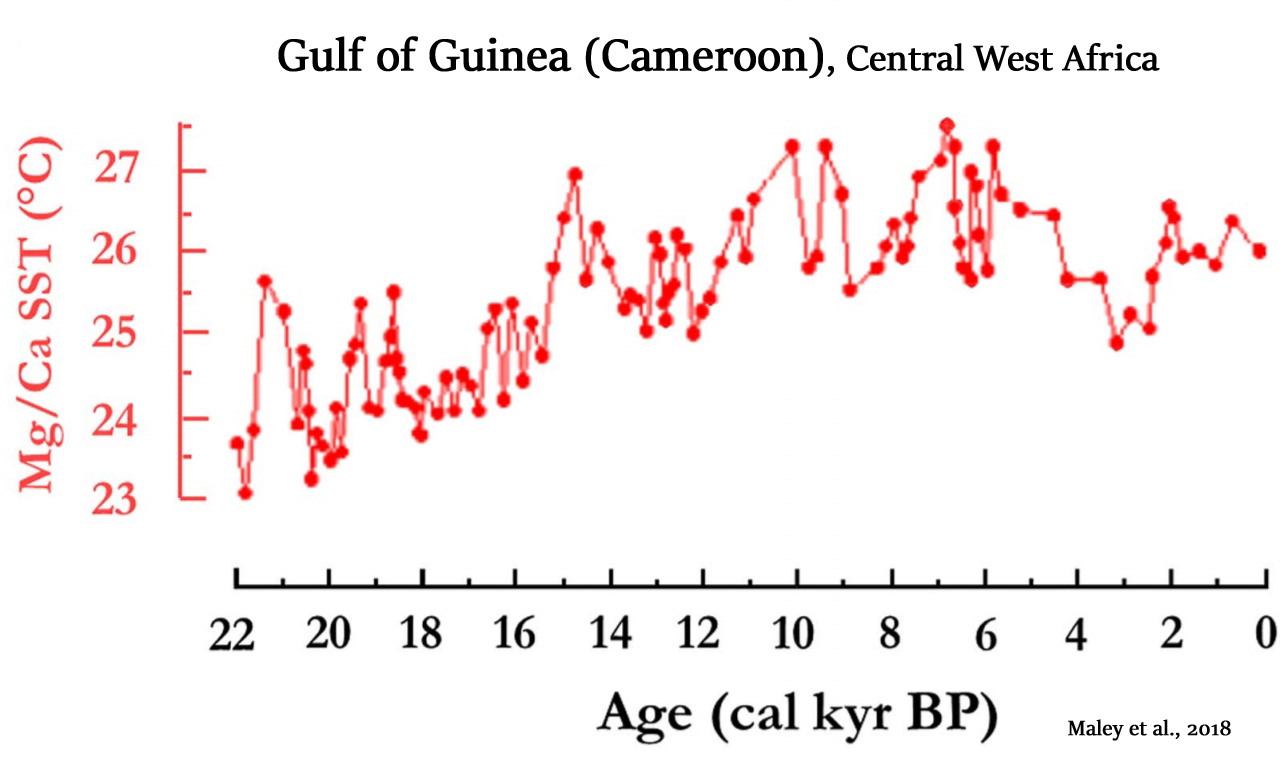
Maley et al., 2018
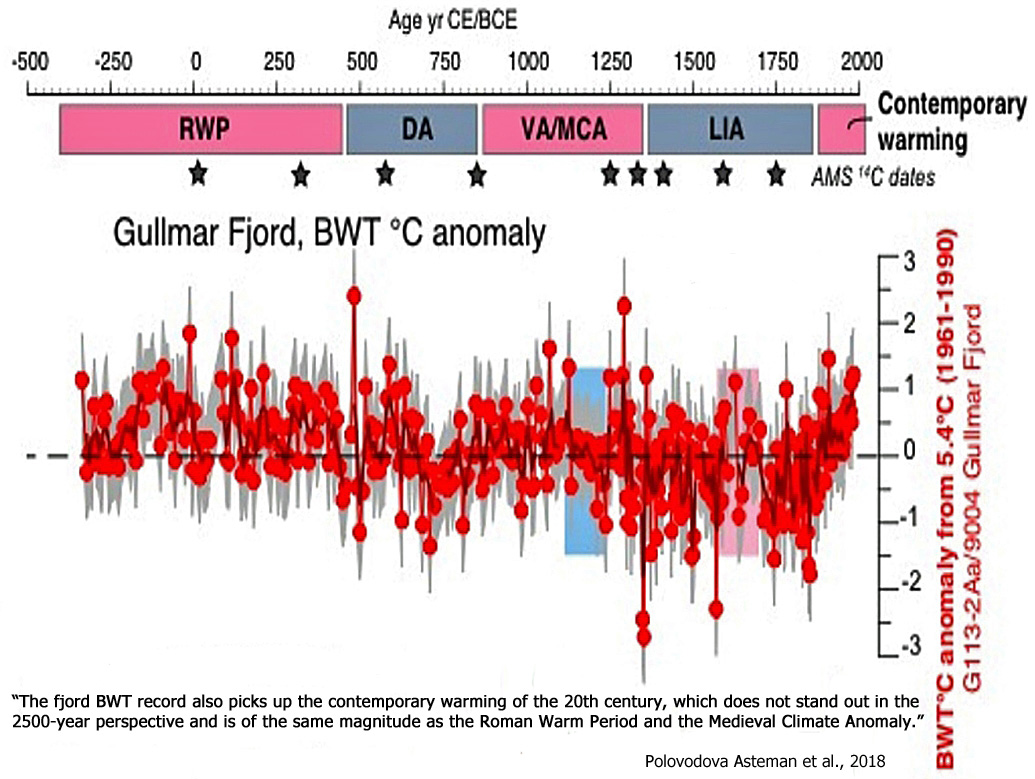
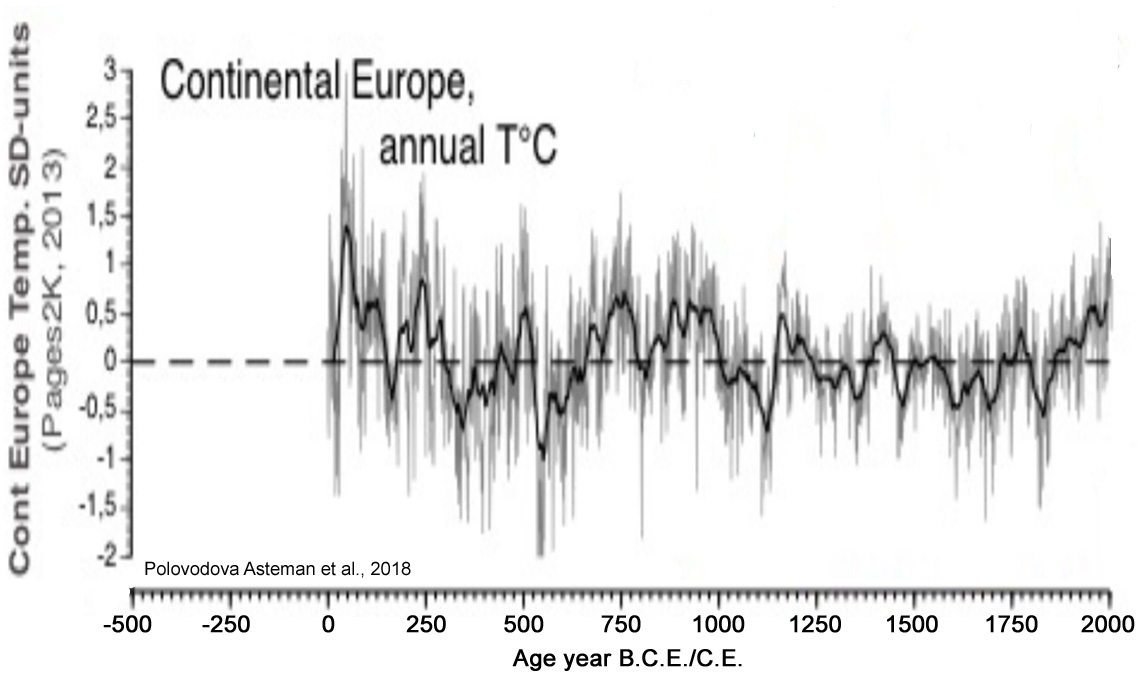
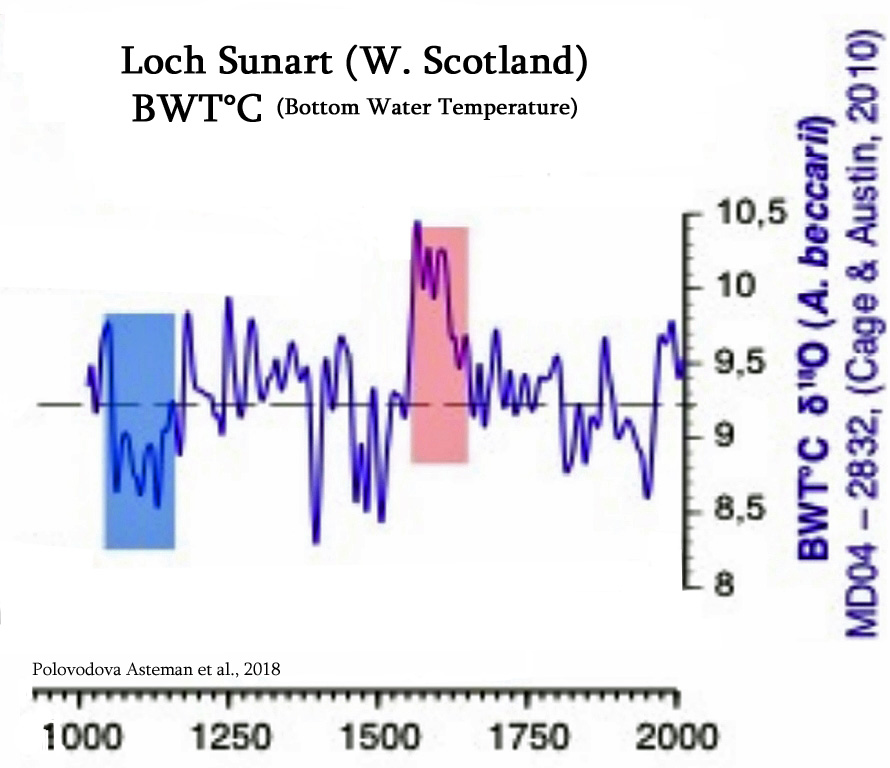
Polovodova Asteman et al., 2018
“The record demonstrates a warming during the Roman Warm Period (~350 BCE – 450 CE), variable bottom water temperatures during the Dark Ages (~450 – 850 CE), positive bottom water temperature anomalies during the Viking Age/Medieval Climate Anomaly (~850 – 1350 CE) and a long-term cooling with distinct multidecadal variability during the Little Ice Age (~1350 – 1850 CE). The fjord BWT [bottom water temperatures] record also picks up the contemporary warming of the 20th century, which does not stand out in the 2500-year perspective and is of the same magnitude as the Roman Warm Period and the Medieval Climate Anomaly.”
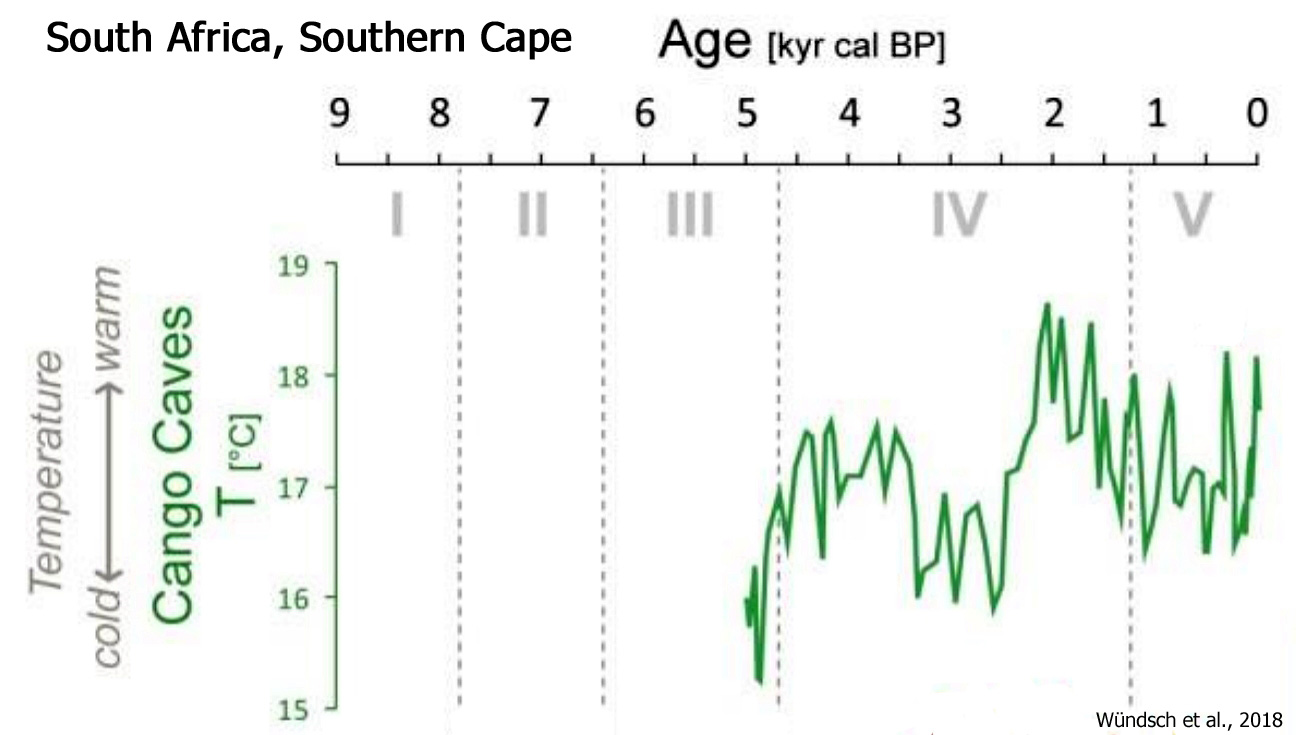
Wündsch et al., 2018
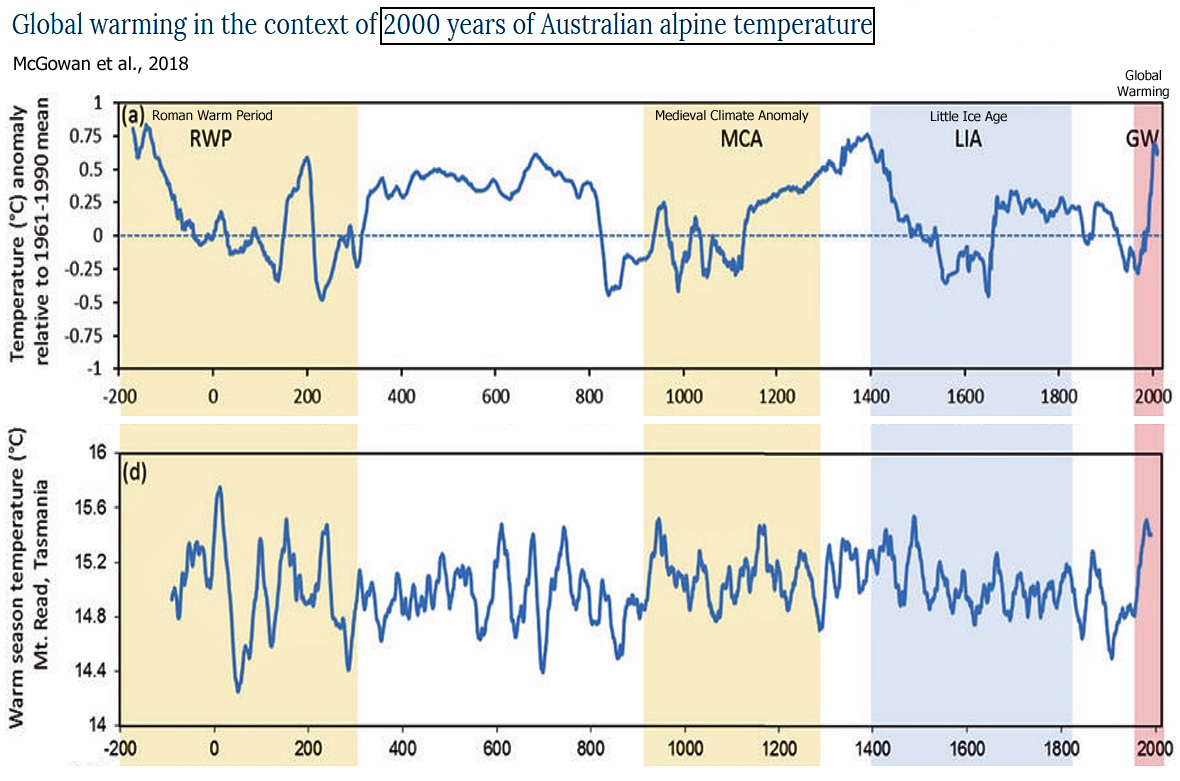
McGowan et al., 2018
“Our reconstructed Tmax [temperature maximum] for these warmer conditions peaks around 1390 CE at + 0.8 °C above the 1961–90 mean, similar to the peak Tmax during the RWP [Roman Warm Period]. These results are aligned with the findings that show the period from 1150 to 1350 CE to be the warmest pre-industrial chronzone of the past 1000 yrs for southeast Australia.”
Wu et al., 2018
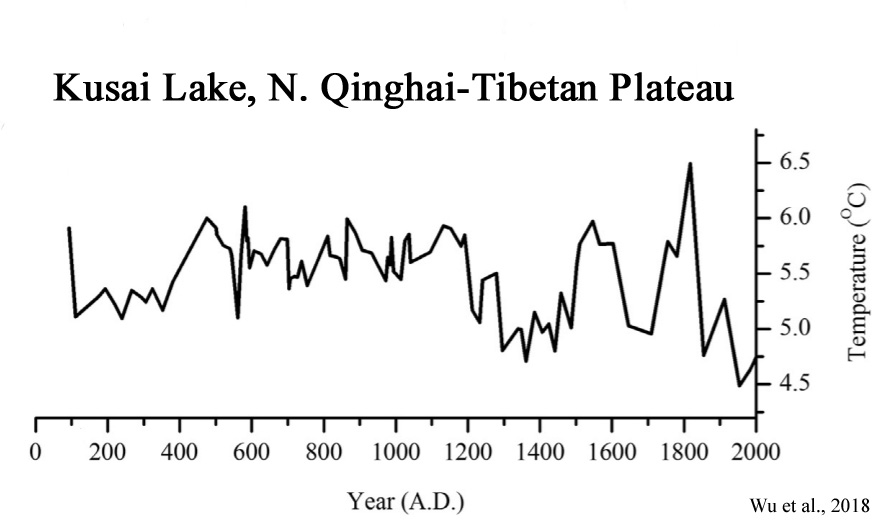
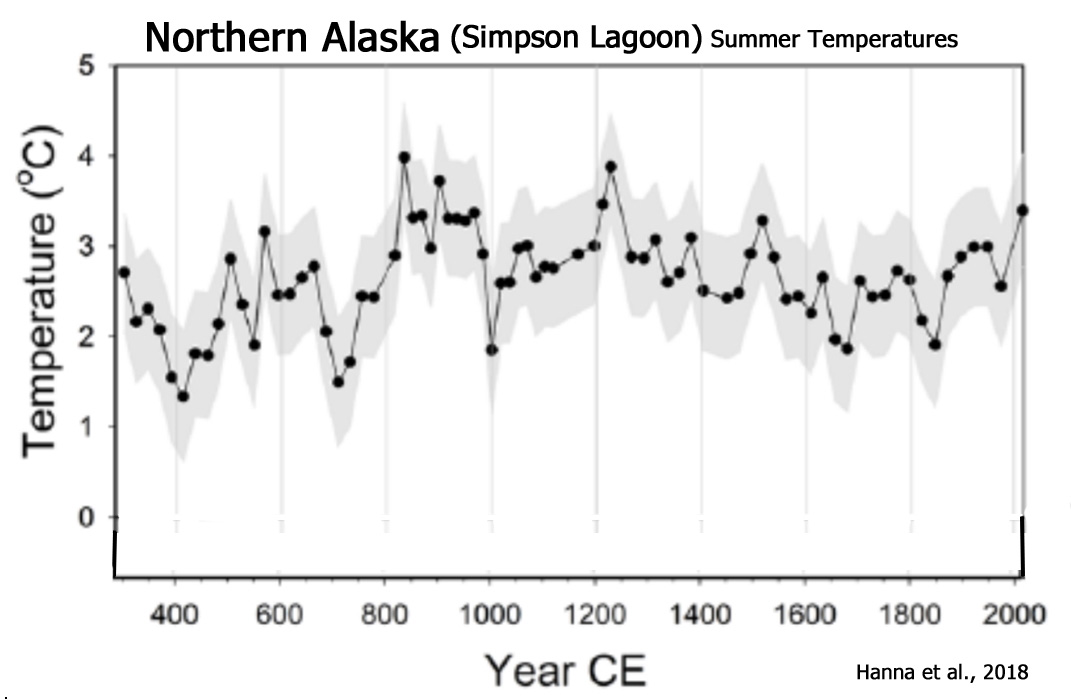
Hanna et al., 2018
“Reconstructed temperatures are generally coolest between 300 and 800 CE (Tavg = 2.24 ± 0.98°C), displaying three temperature minima centered at 410 CE (1.34 ± 0.72°C), 545 CE (1.91 ± 0.69°C), and 705 CE (1.49 ± 0.69°C). Temperatures then rapidly increased, reaching the warmest interval (800–1000 CE) in the approximately 1700-year record. During this interval, average temperatures were 3.31 ± 0.65°C, with a maximum temperature of 3.98°C.”
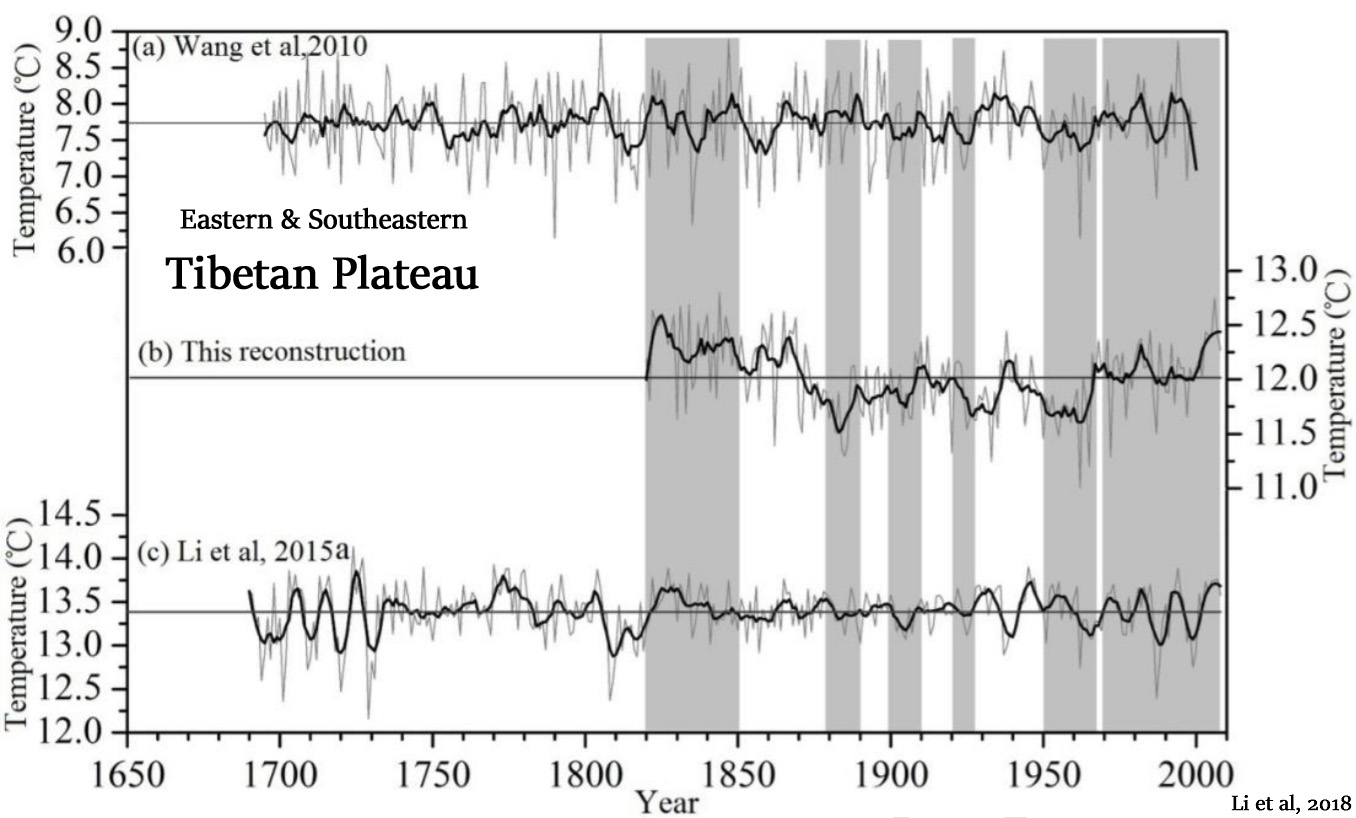
Li et al., 2018
“There are also other studies that suggest that the recent climate warming over the southeastern TP actually began in the 1820s (Shi et al., 2015). However, a few reconstructions from the west and northwest parts of Sichuan or from the southeastern TP indicate that there were no obvious increase of temperature during the past decades (Li et al., 2015b; Zhu et al., 2016).”
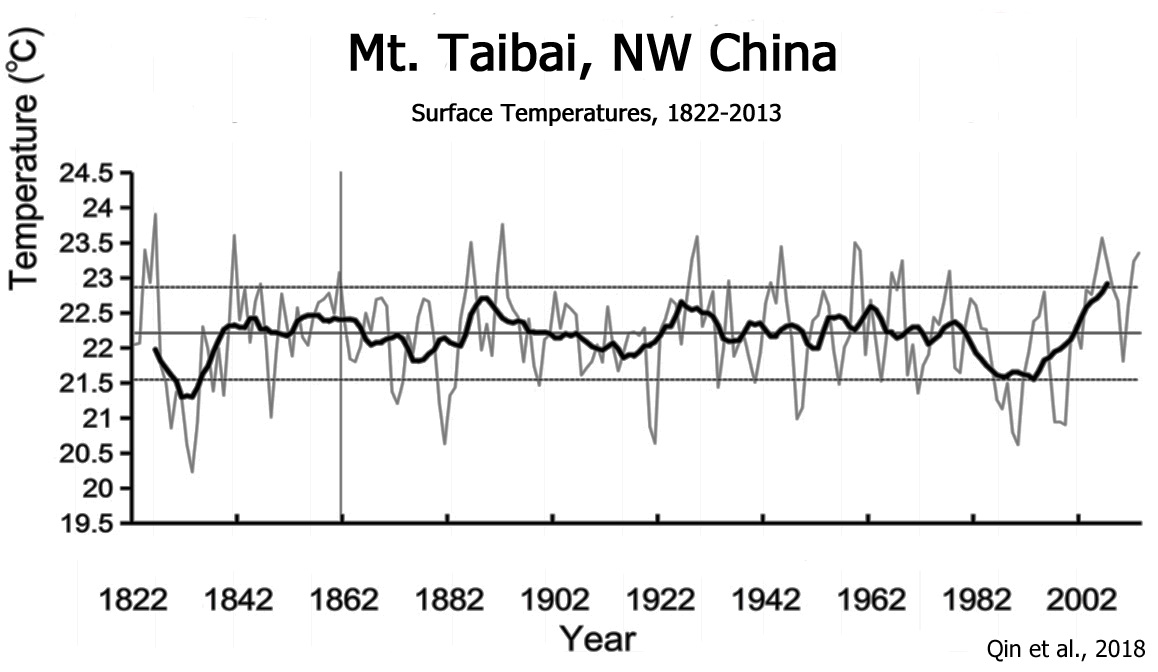
Qin et al., 2018
“Three quasi-oscillations with cycles of 31–22, 22–18, and 12–8 years may reflect the joint influence of PDO, southern oscillation, and solar activity on climate variation in the Qinling Mountains. … [T]he third cycle of 12–8 years exhibited 18 distinct cold-hot events, which were approximately equivalent to the changes of solar activity and sunspot activity and corresponded to the 11-year cycle of drought in northwestern China (Cai and Liu. 2007).”
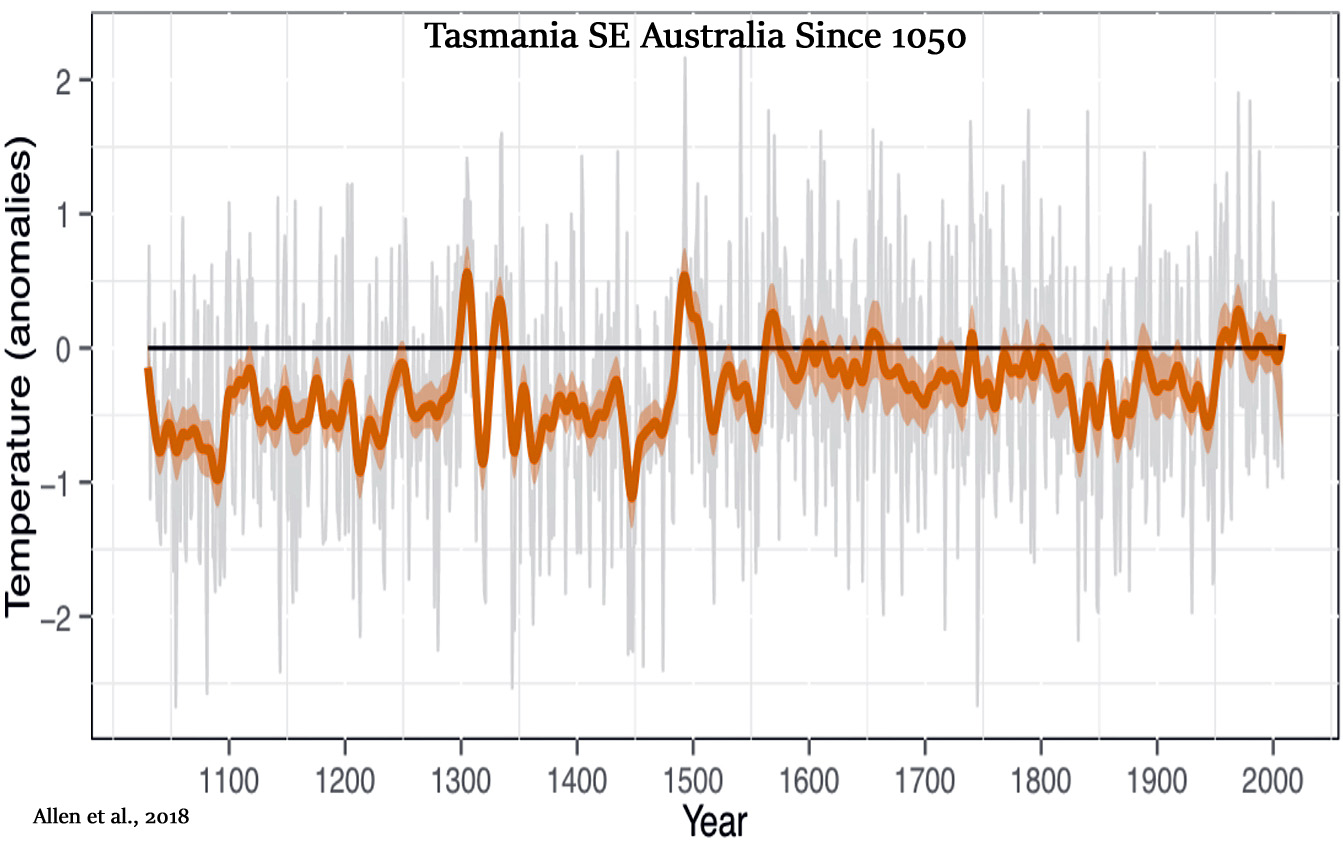
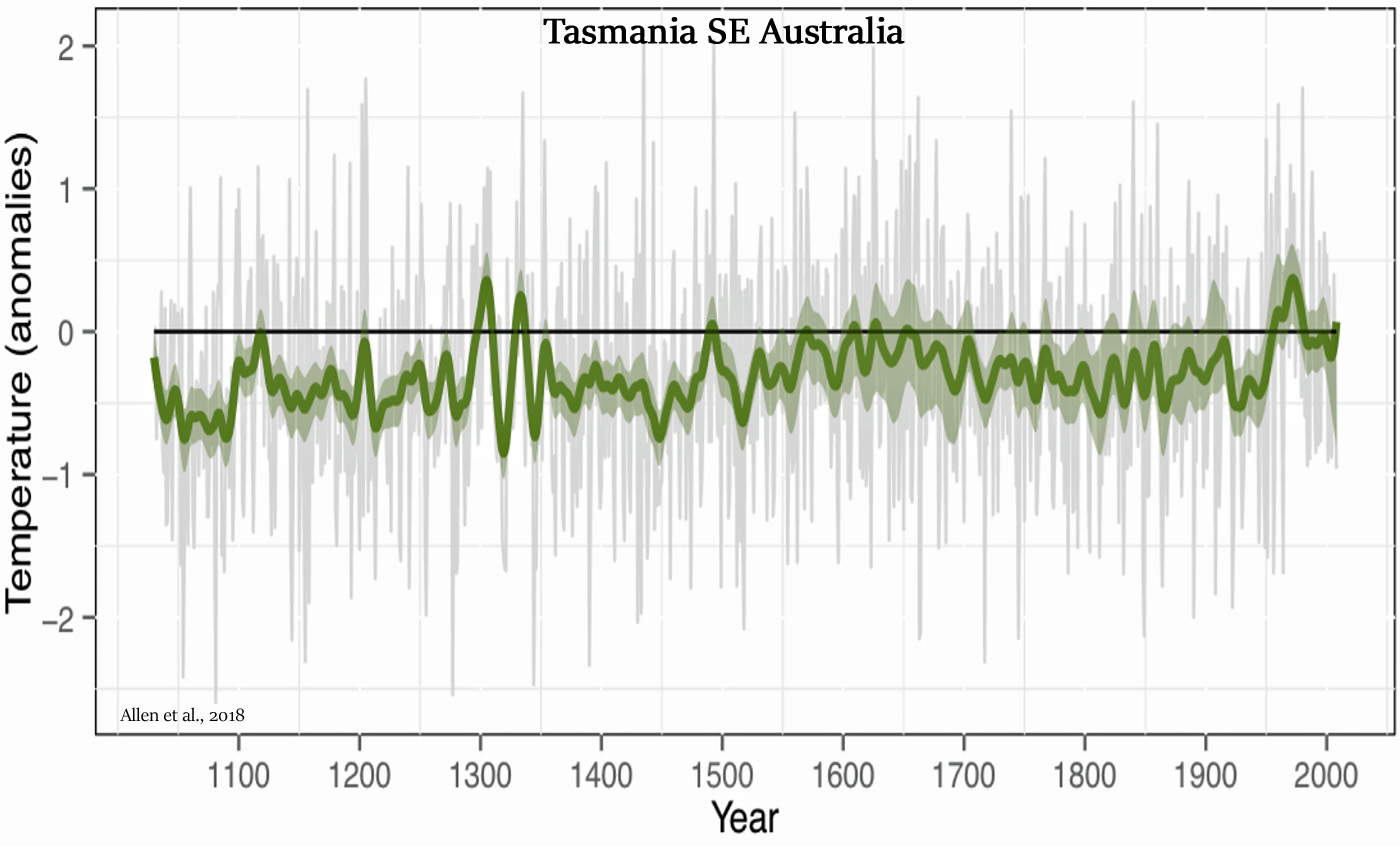
Allen et al., 2018
“The longest sustained period of relatively high temperatures in the reconstructions is the post 1950 CE period although there are clearly individual years much earlier that were warmer than any in the post-1950 period.”

Oppedal et al., 2018
“This advance was documented by historical evidence (Hayward, 1983), showing that many glaciers advanced in the twentieth century. Cirque and valley glaciers were at its most advanced position in the 1930s, while larger valley and tidewater glaciers reached their maximum glacier extent in the 1970s. Such a glacier advance is also documented for the Hamberg glacier by Van Der Bilt et al. (2017). Furthermore, during the recession phase after the twentieth century advance, many cirque glaciers deposited annual moraines (Gordon and Timmis, 1992), such as the ones observed in the innermost moraine cluster. Thus, Diamond glacier followed a similar pattern to that observed for small glaciers (0.1–4.0 km2) on South Georgia during the late Holocene, with a Little Ice Age advance, a period of recession, a twentieth century advance and a recent recession (Gordon and Timmis, 1992).”

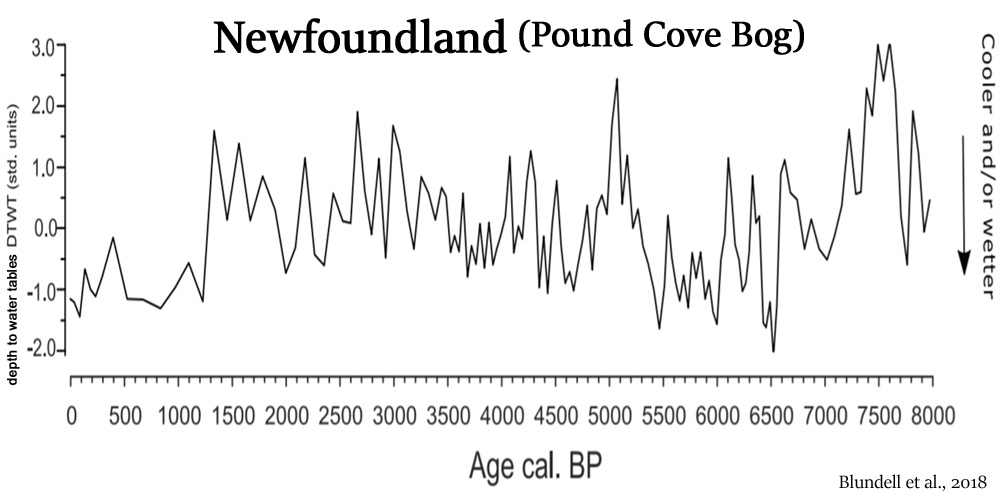
Blundell et al., 2018
“Energy carried by warm tropical water, transported via the Atlantic Meridional Overturning Circulation (AMOC), plays a vital role in regulating the climate of regions bordering the North Atlantic Ocean. Previous phases of elevated freshwater input to areas of North Atlantic Deep Water (NADW) production in the early to mid-Holocene have been linked with slow-downs in the AMOC and changes in regional climate.”
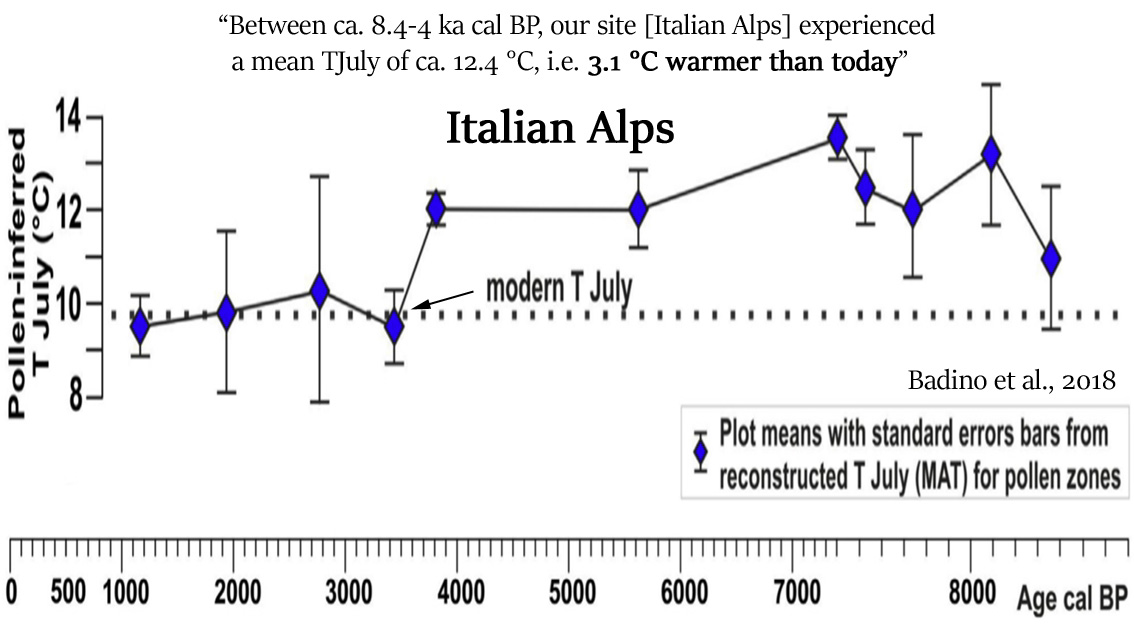
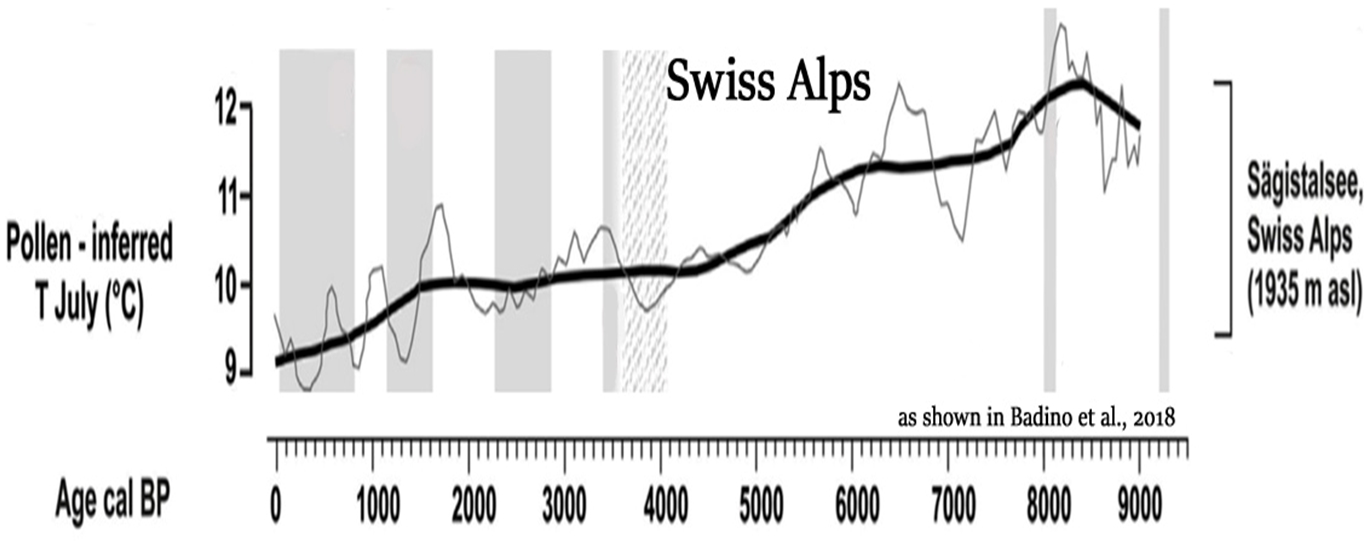
Badino et al., 2018
“Between ca. 8.4-4 ka cal BP [8,400 to 4,000 years before present], our site [Italian Alps] experienced a mean TJuly of ca. 12.4 °C, i.e. 3.1 °C warmer than today [9.3 °C]. … Between 7400 and 3600 yrs cal BP, an higher-than-today forest line position persisted under favorable growing conditions (i.e. TJuly at ca. 12 °C).”
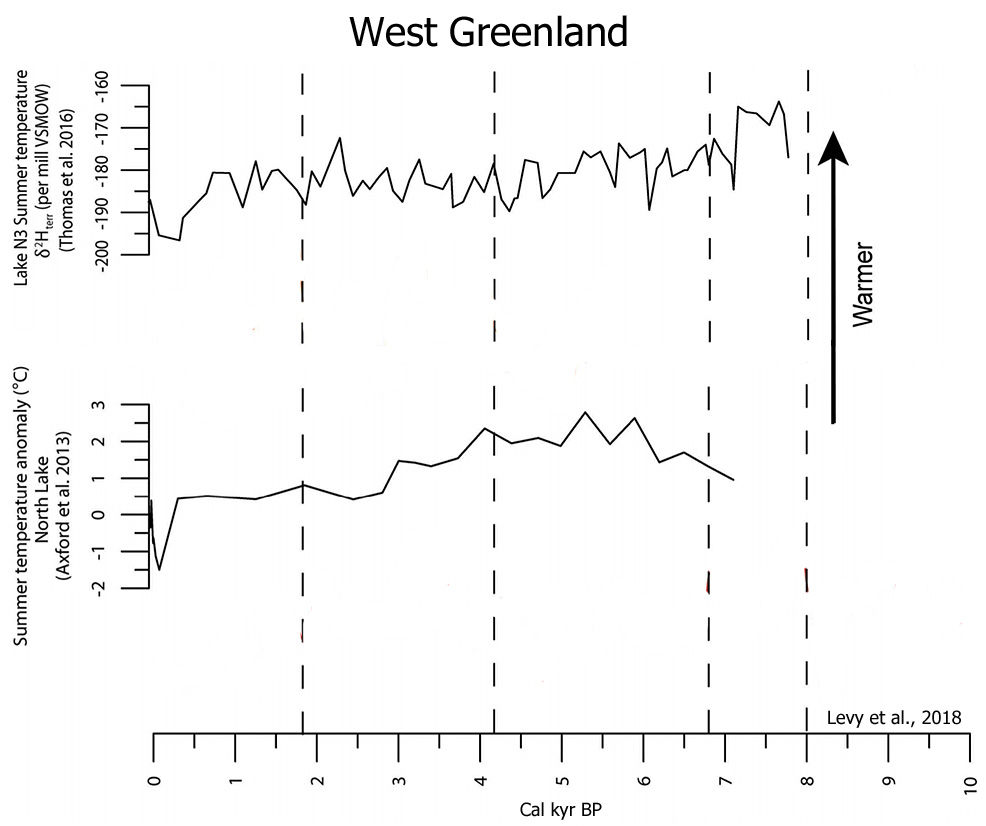
Levy et al., 2018
“The three historical moraine crests indicate that there were at least three ice-margin stillstands or advances during historical time. Summer temperature records from North lake (Axford et al. 2013) and Lake N3 (Thomas et al. 2016) broadly register cooling in the past 200 years in western Greenland, which likely influenced the advance to the historical moraines.”
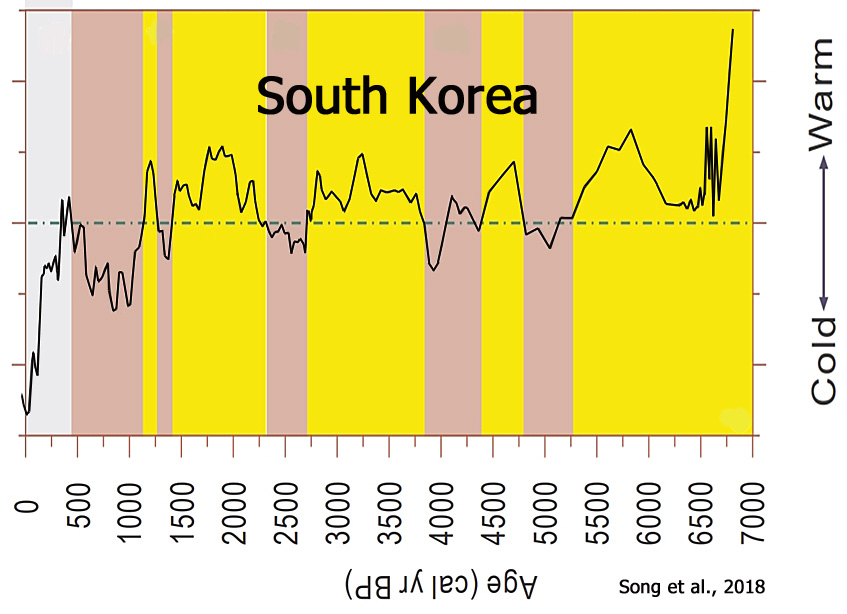
Song et al., 2018
“[A] general warm to cold climate trend from the mid-Holocene to the present, which can be divided into two different stages: a warmer stage between 6842 and 1297 cal yr BP and a colder stage from 1297 cal yr BP to the present.”
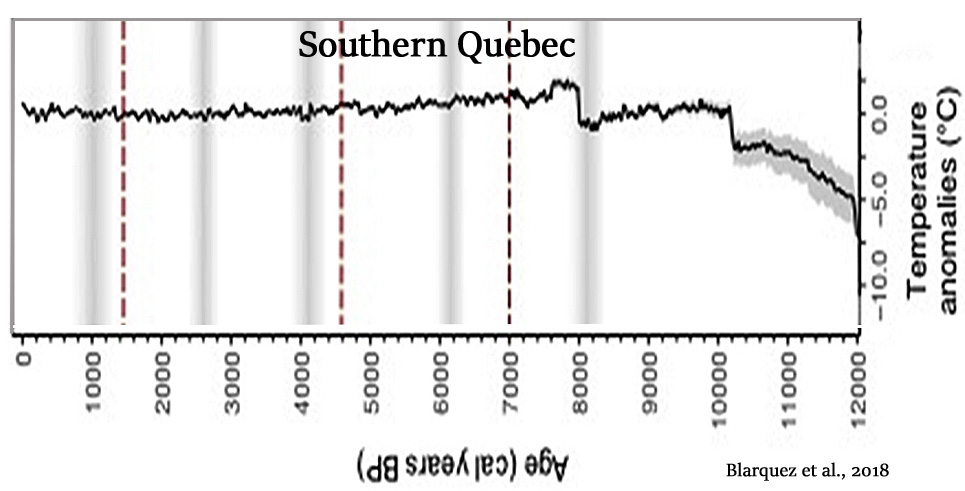
Blarquez et al., 2018
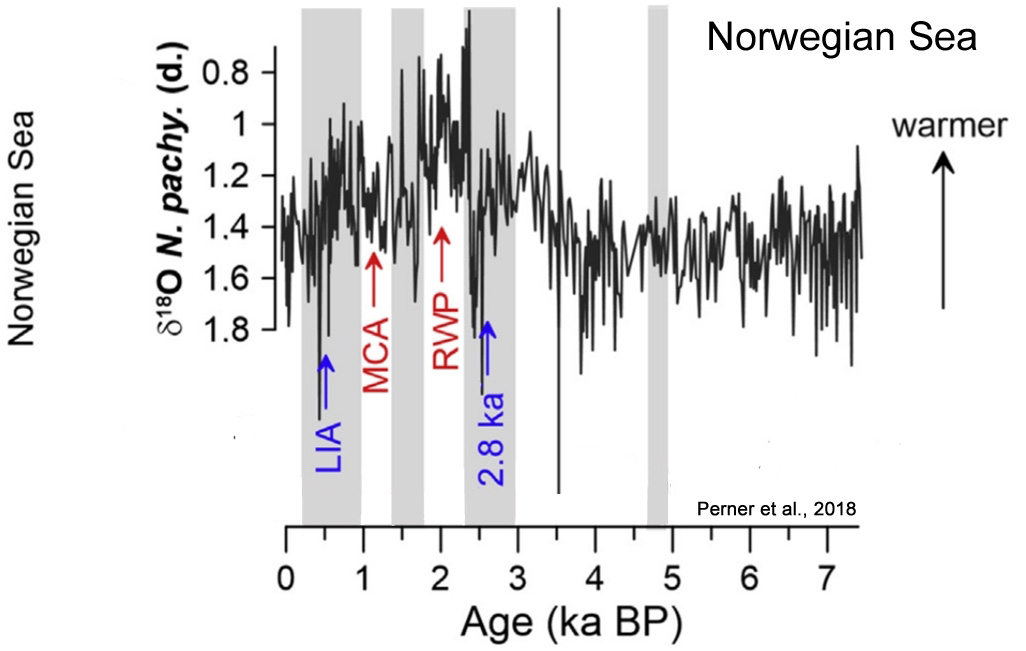
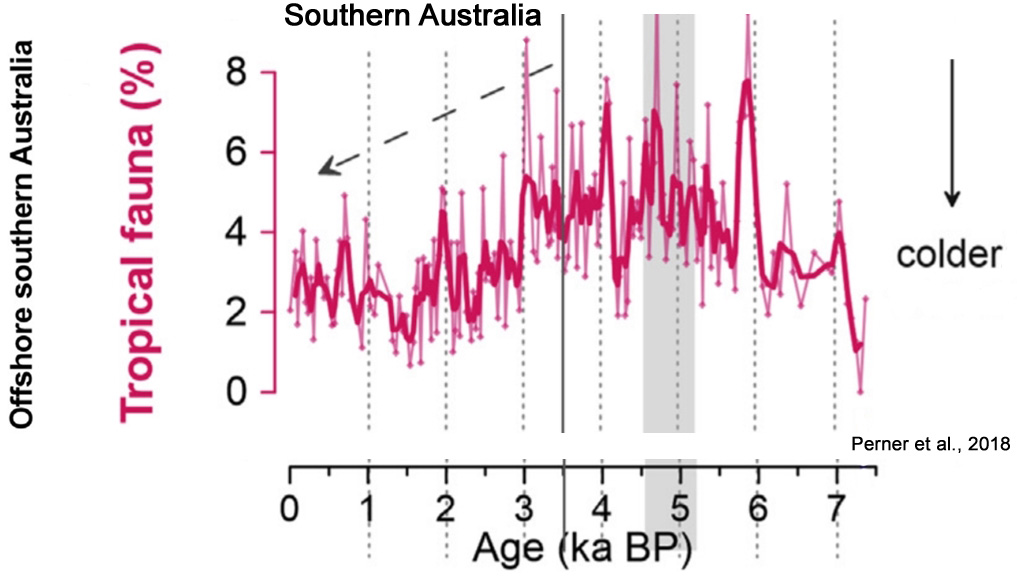
Perner et al., 2018
“[W]e find evidence of distinct late Holocene millennial-scale phases of enhanced El Niño/La Niña development, which appear synchronous with northern hemispheric climatic variability. … Phases of dominant El Niño-like states occur parallel to North Atlantic cold phases: the ‘2800 years BP cooling event’, the ‘Dark Ages’ and the ‘Little Ice Age’, whereas the ‘Roman Warm Period’ and the ‘Medieval Climate Anomaly’ parallel periods of a predominant La Niña-like state.”
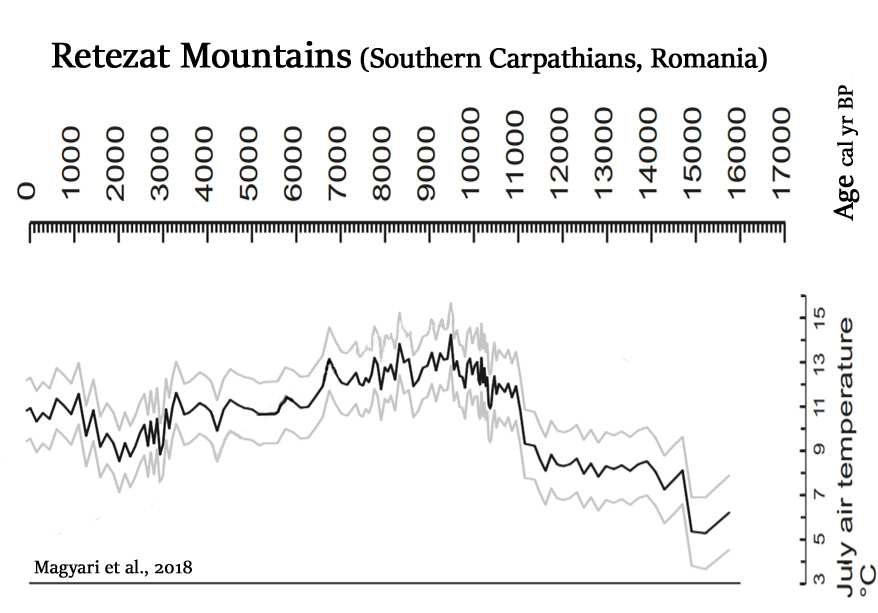
Magyari et al., 2018
“…its climatic tolerance limits were used to infer July mean temperatures exceeding modern values by 2.8°C at this time [8200-6700 cal yr BP] (Magyari et al., 2012).”
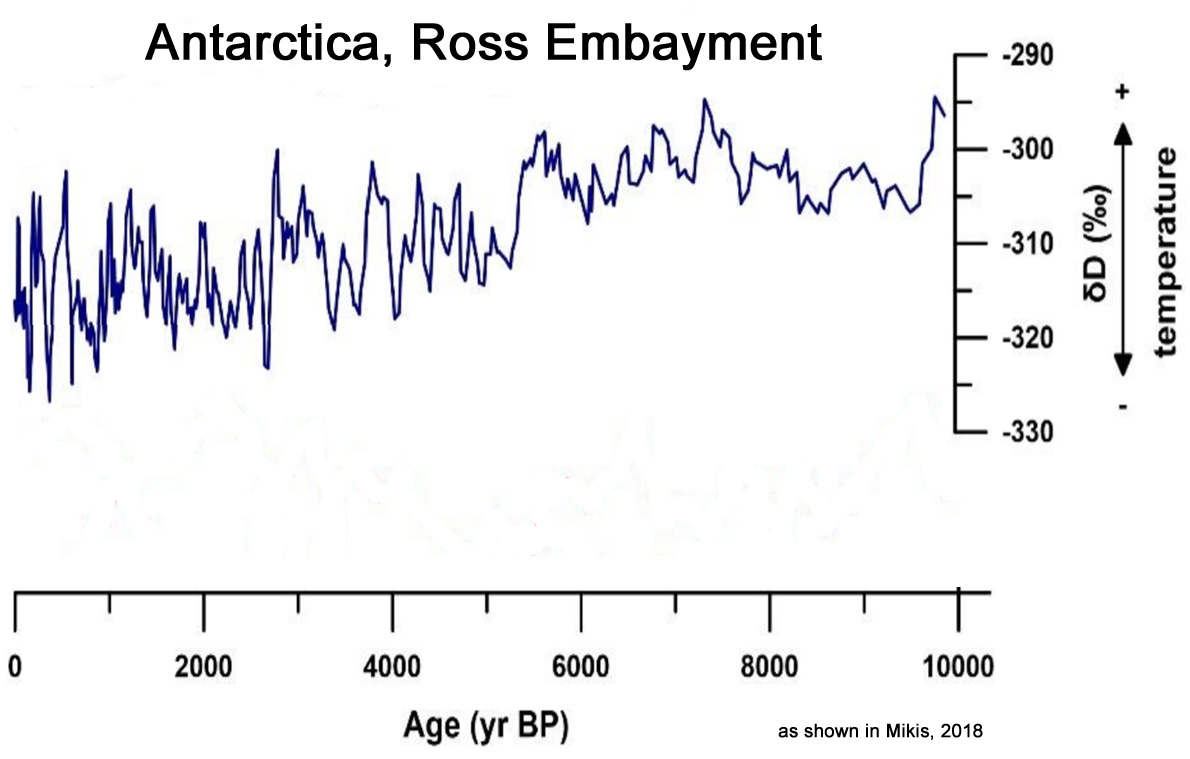
Mikis, 2018
Papadomanolaki et al., 2018 (Baltic Sea)
“A large fraction of the Baltic Proper became hypoxic again between 1.4 and 0.7 ka BP, during the Medieval Climate Anomaly (MCA), when mean air temperatures were 0.9–1.4 °C higher than temperatures recorded in the period 1961–1990 (e.g. Mann et al., 2009; Jilbert and Slomp, 2013).”
Leonard et al., 2018 (Great Barrier Reef, Australia)
“Coral derived sea surface temperature (SST-Sr/Ca) reconstructions demonstrate conditions ∼1 ◦C warmer than present at ∼6200 (recalibrated 14C) and 4700 yr BP, with a suggested increase in salinity range (δ18O) associated with amplified seasonal flood events, suggestive of La Niña (Gagan et al., 1998; Roche et al., 2014).”
Suvorov and Kitov, 2018 (Eastern Sayan, Siberia)
“The authors examined the variability of activity of modern glaciation and variation of natural conditions of the periglacial zone on climate and on dendrochronological data. Results of larch and Siberian stone pine growth data were revealed at the higher border of forest communities. … It is believed that the temperature could be 3.5 °C warmer at the Holocene optimum than at the present time (Vaganov and Shiyatov 2005). … Since 2000, there has been growth of trees instability associated with a decrease in average monthly summer temperatures. … Since the beginning of 2000, decrease in summer temperatures was marked.”
20th/21st Centuries Non-Warming
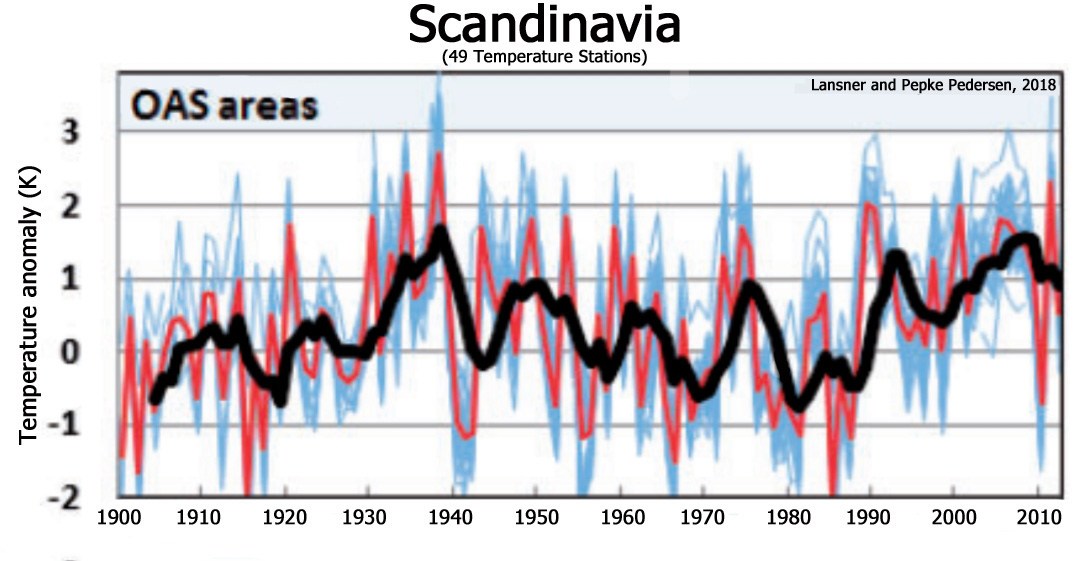
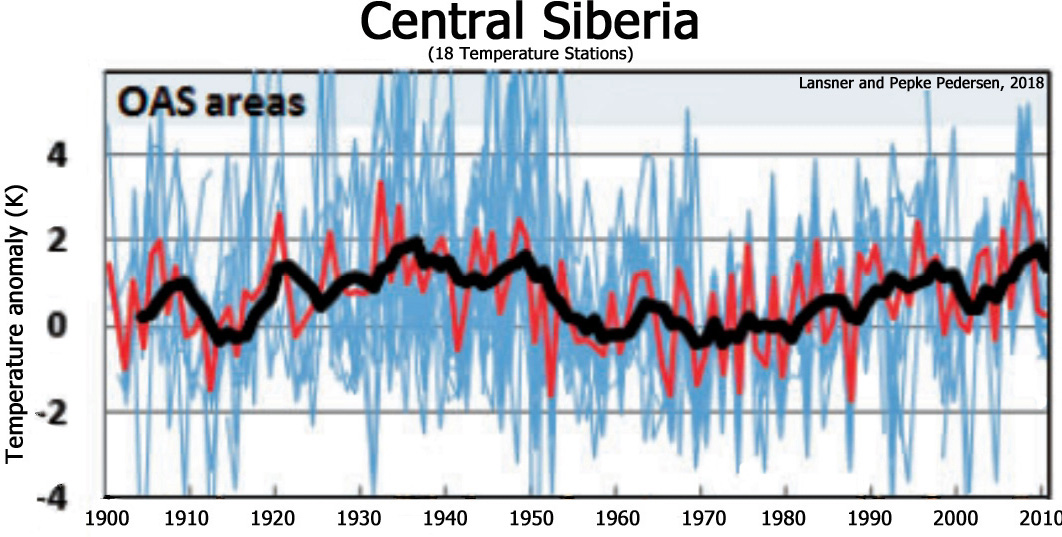
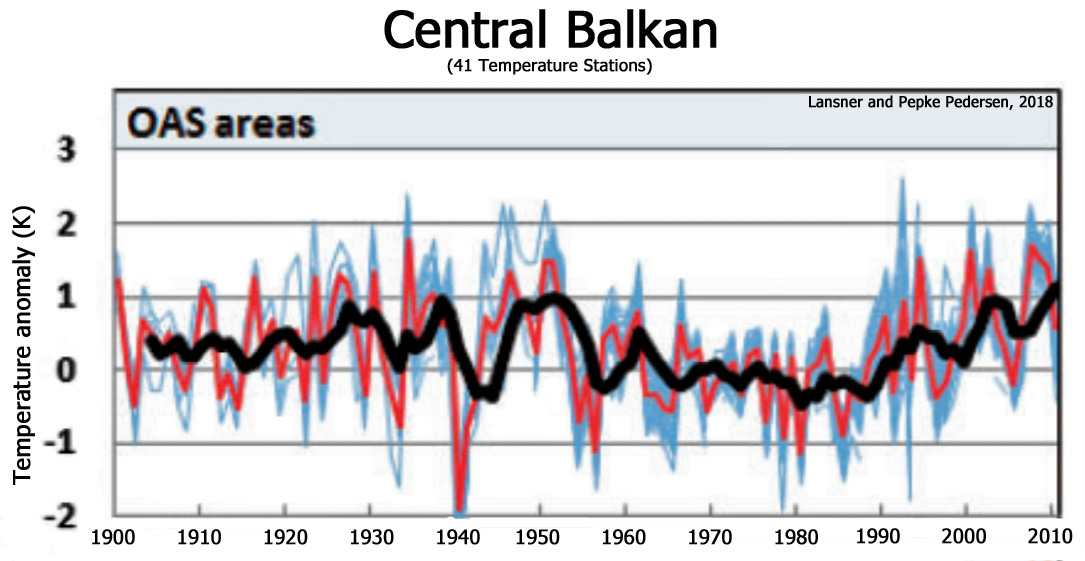
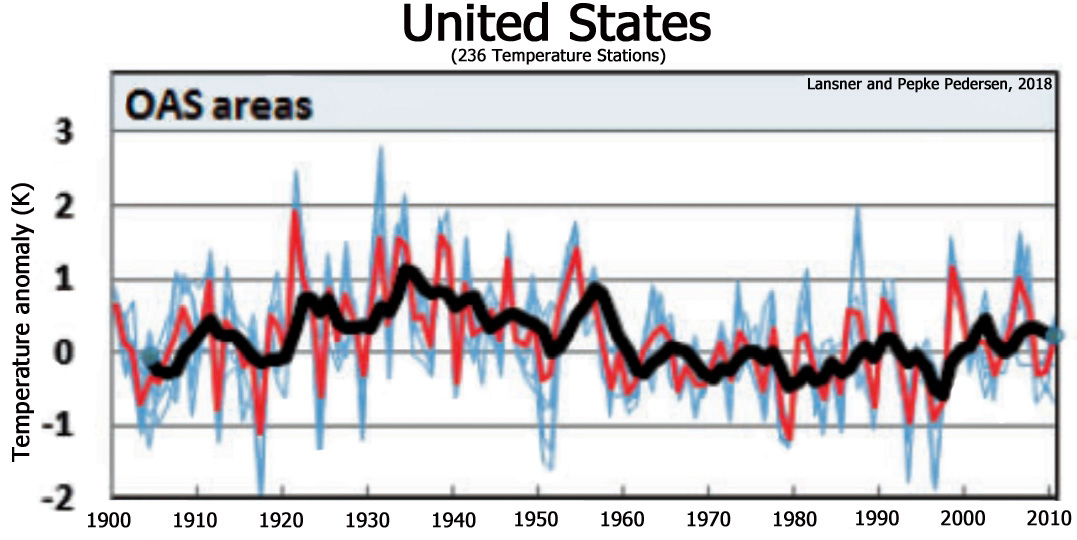
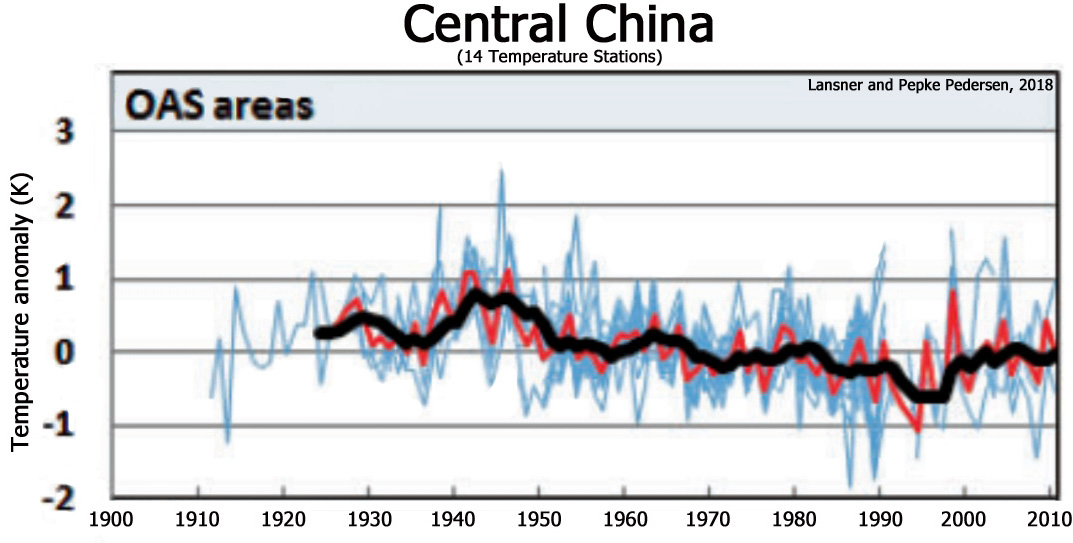
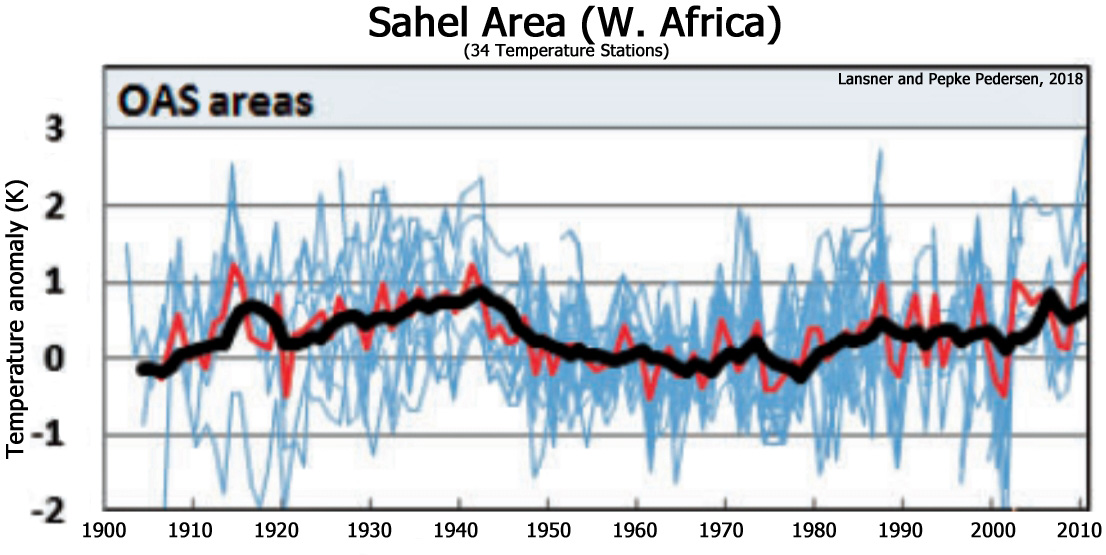
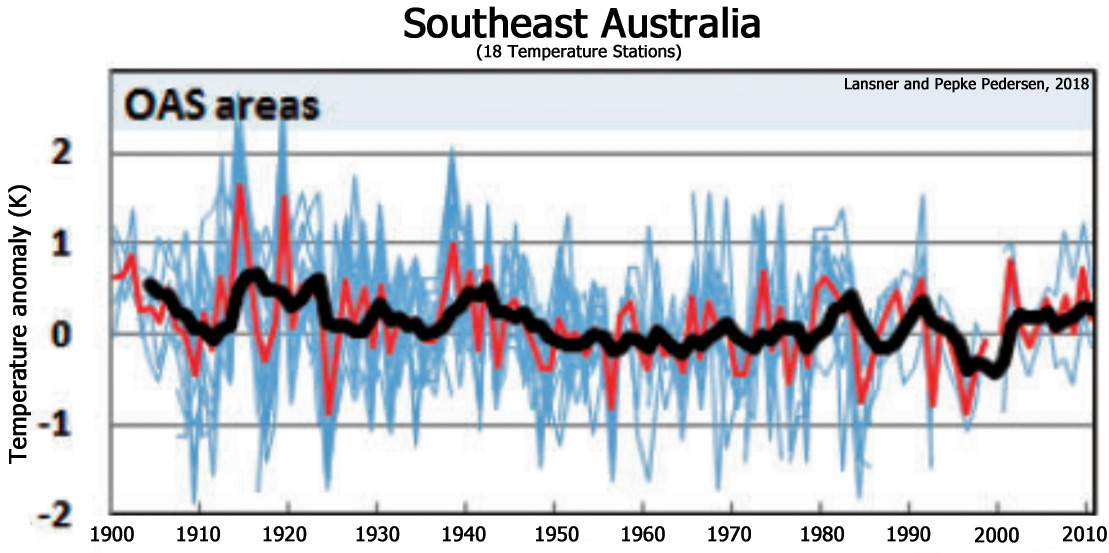
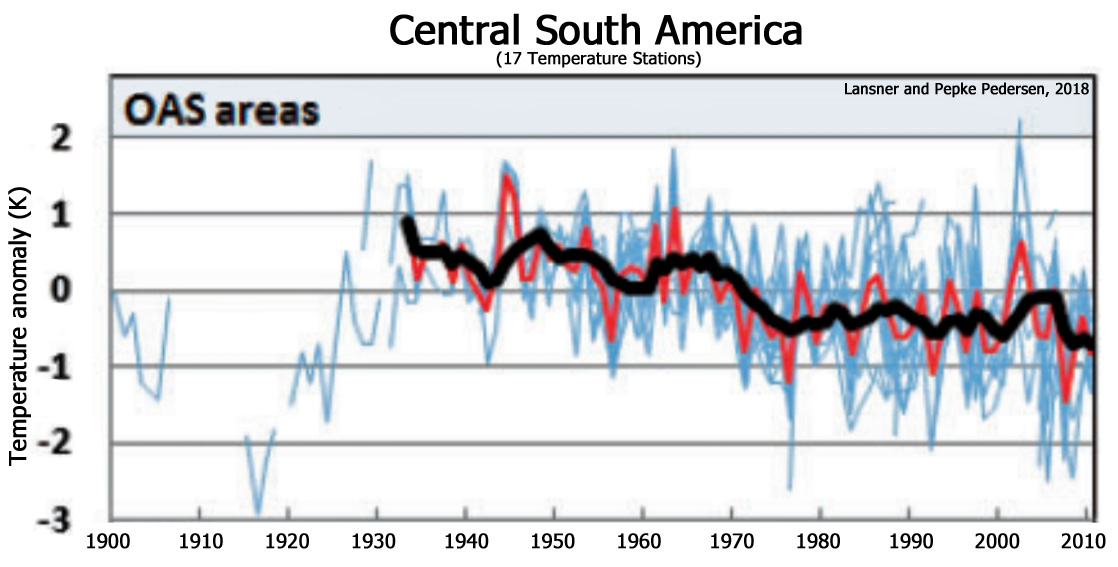
Lansner and Pepke Pederson, 2018
“We found that in any land area with variation in the topography, for the period 1900-2010 we can divide the meteorological stations into the more warm-trended ocean air-affected OAA-stations, and the more cold-trended ocean air-sheltered OAS-stations. The methods used in this work are meant to give a rough picture of the large differences in temperature trends between OAS and OAA stations. … When we isolated temperature trends 1900–2010 with as little ocean influence as possible – the OAS areas – we found a warm period 1920–1950 with temperatures similar to recent decades for all investigated areas worldwide. We have not found any area with numerous OAS/Valley stations available where the majority of temperature stations show a different result. In contrast, the OAA locations like islands, coasts, hills facing dominating ocean winds, etc., did not reflect the warm period 1920–1950 well. … Therefore, the lack of warming in the OAS temperature trends after 1950 should be considered when evaluating the climatic effects of changes in the Earth’s atmospheric trace amounts of greenhouse gasses as well as variations in solar conditions.”
“The global averages for all 10 OAS (blue curve) and OAA (red curve) shown together in Figure 19 to allow comparison. The most significant difference between global OAS and OAA temperature data is found during the period 1920–1950, where the OAS temperatures are generally 0.5–1 K warmer than OAA temperatures. … We recognize the remarkable temperature increase in temperature in the years after the 1918/1919 strong El Nino. After this warming, the OAS temperature data appear to have jumped by around 0.5 K to a new level, indicative of a shift to a new climatic regime. The OAA data fail to show this abrupt change. … The resemblance in temperature trends between global unadjusted OAA temperature data and the MAT data supports that the large-scale use of non-adjusted original data is justified for this type of analysis. … In locations best sheltered and protected against ocean air influence, the vast majority of thermometers worldwide trends show temperatures in recent decades rather similar to the 1920–1950 period. This indicates that the present-day atmosphere and heat balance over the Earth cannot warm areas – typically valleys – worldwide in good shelter from ocean trends notably more than the atmosphere could in the 1920–1950 period.”



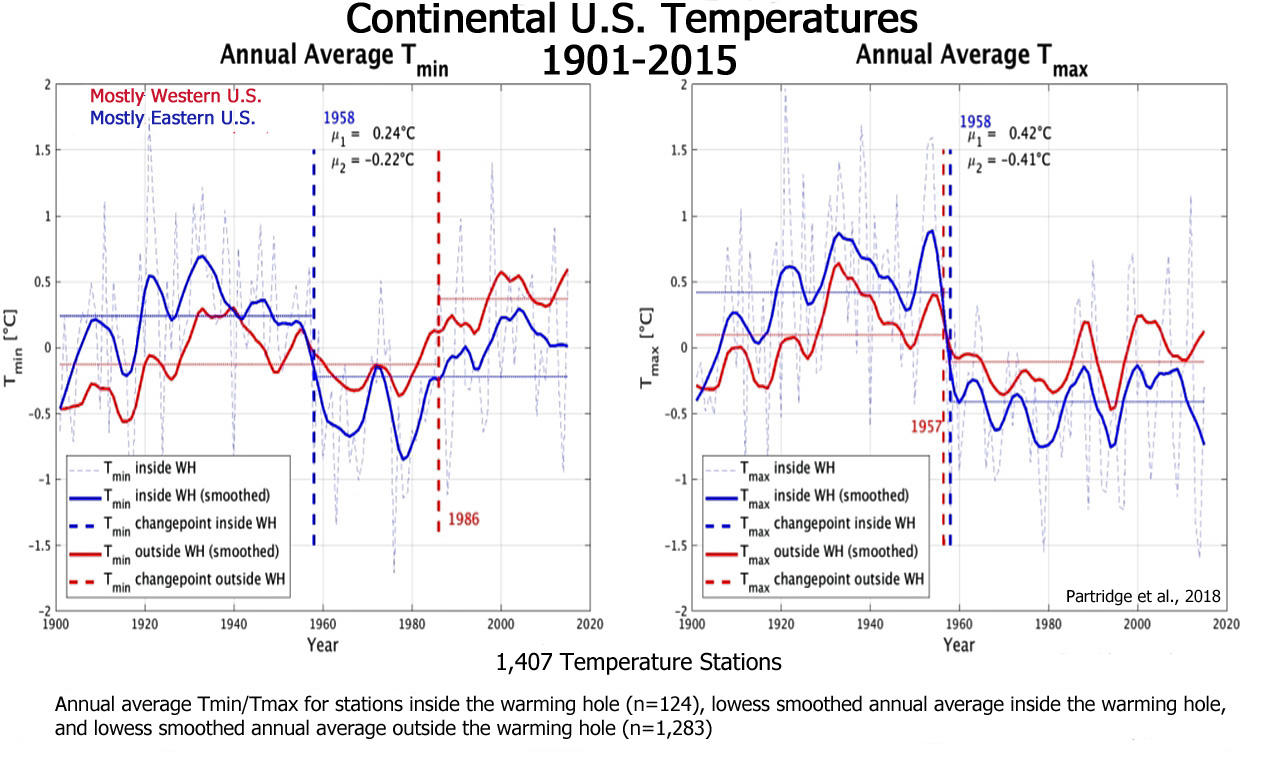
Partridge et al., 2018
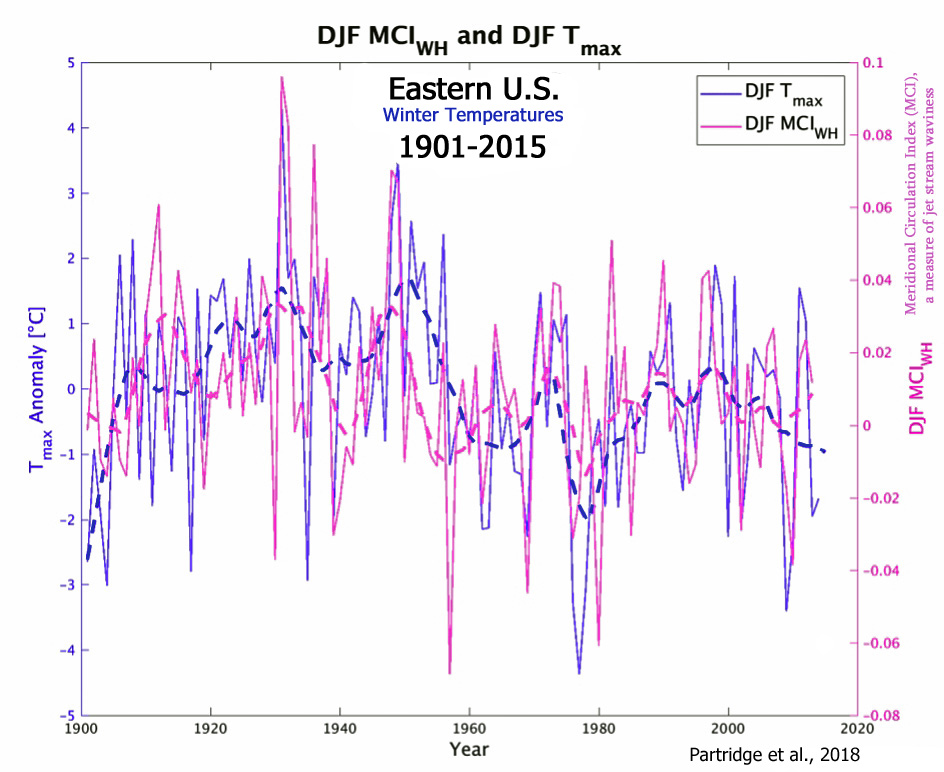
“We present a novel approach to characterize the spatiotemporal evolution of regional cooling across the eastern U.S. (commonly called the U.S. warming hole), by defining a spatially explicit boundary around the region of most persistent cooling. The warming hole emerges after a regime shift in 1958 where annual maximum (Tmax) and minimum (Tmin) temperatures decreased by 0.46°C and 0.83°C respectively. … [T]he seasonal modes also vary in causation. Winter temperatures in the warming hole are significantly correlated with the Meridional Circulation Index (MCI), North Atlantic Oscillation (NAO), and Pacific Decadal Oscillation (PDO). … We select only stations in the contiguous U.S. that have an 80% complete record from 1901-2015, resulting in 1407 temperature stations.”

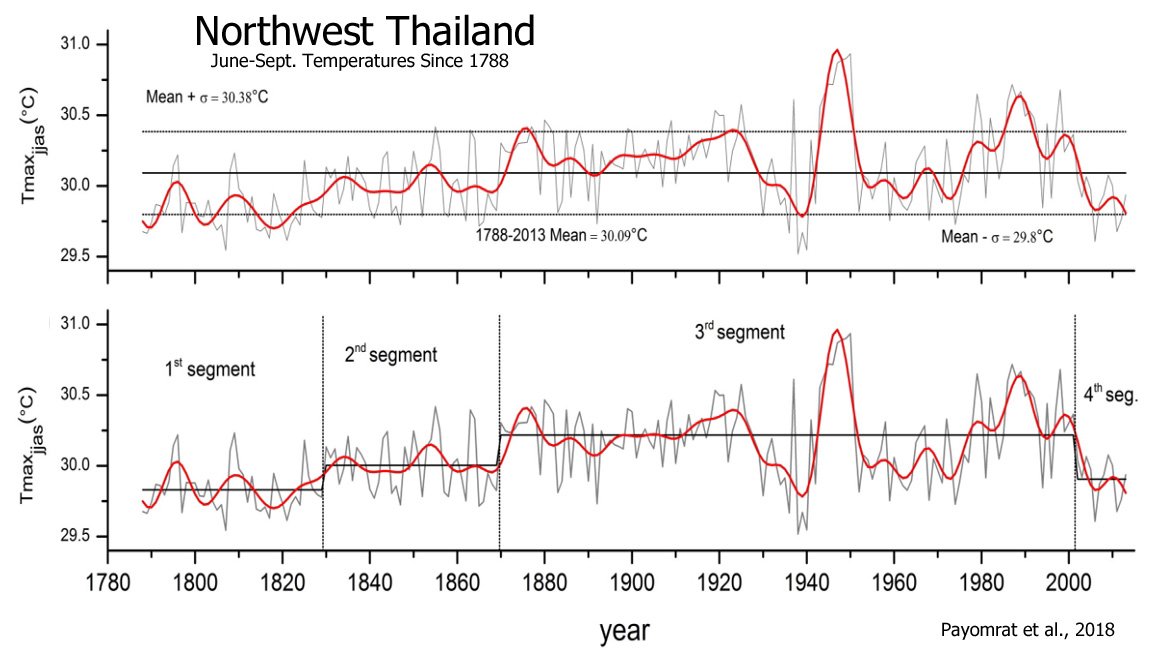
Payomrat et al., 2018
“During the third segment (1870–2001), the maximum temperature pattern seemed to be constant compared to the changing rate (+0.004 °C/decade). … The short fourth segment, which occurred from 2002 to 2013, showed a deceasing trend at a rate of -0.12 °C/decade.”
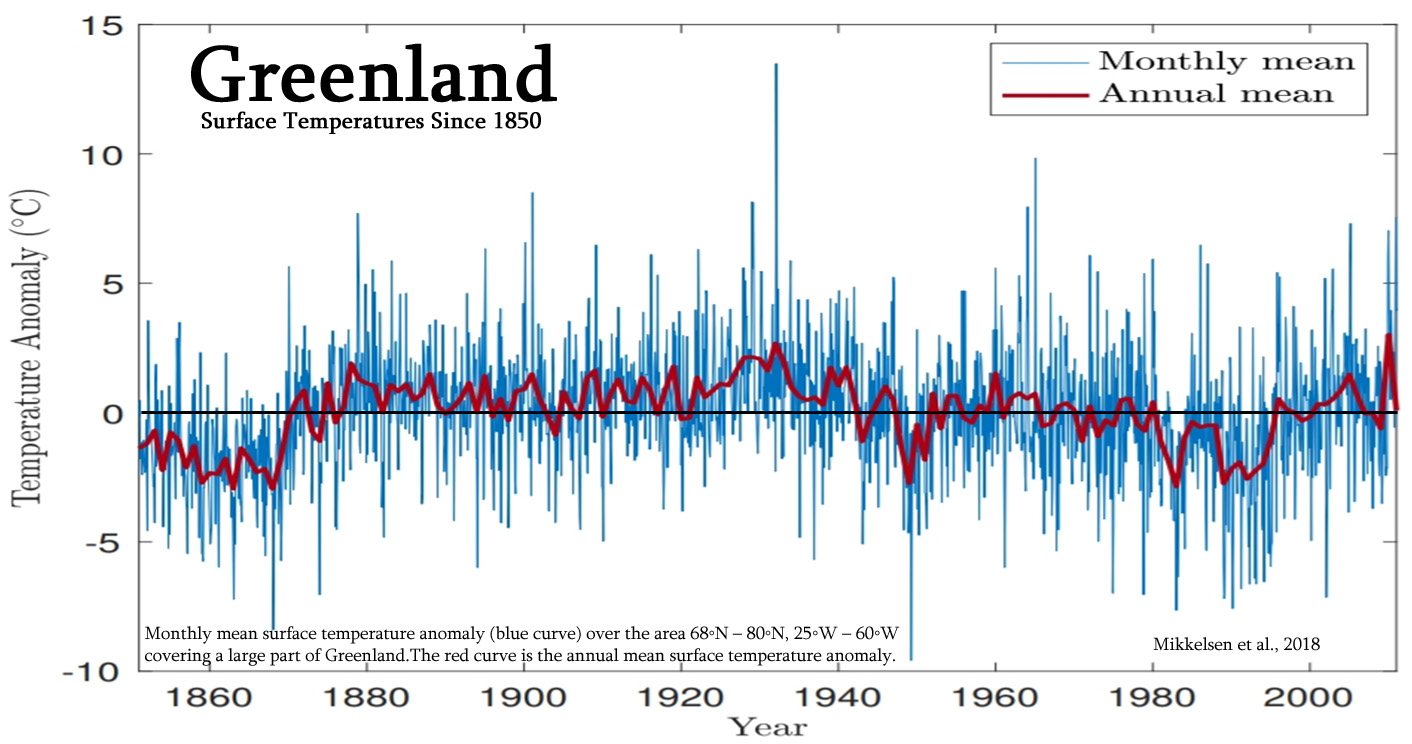
Mikkelsen et al., 2018
Westergaard-Nielsen et al., 2018
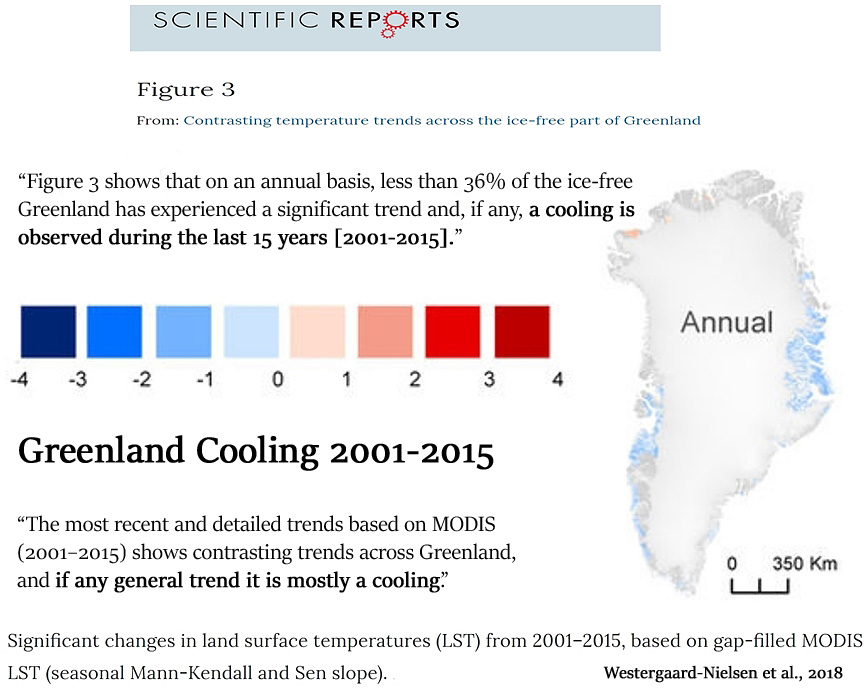
“Here we quantify trends in satellite-derived land surface temperatures and modelled air temperatures, validated against observations, across the entire ice-free Greenland. … Warming trends observed from 1986–2016 across the ice-free Greenland is mainly related to warming in the 1990’s. The most recent and detailed trends based on MODIS (2001–2015) shows contrasting trends across Greenland, and if any general trend it is mostly a cooling. The MODIS dataset provides a unique detailed picture of spatiotemporally distributed changes during the last 15 years. … Figure 3 shows that on an annual basis, less than 36% of the ice-free Greenland has experienced a significant trend and, if any, a cooling is observed during the last 15 years (<0.15 °C change per year).”
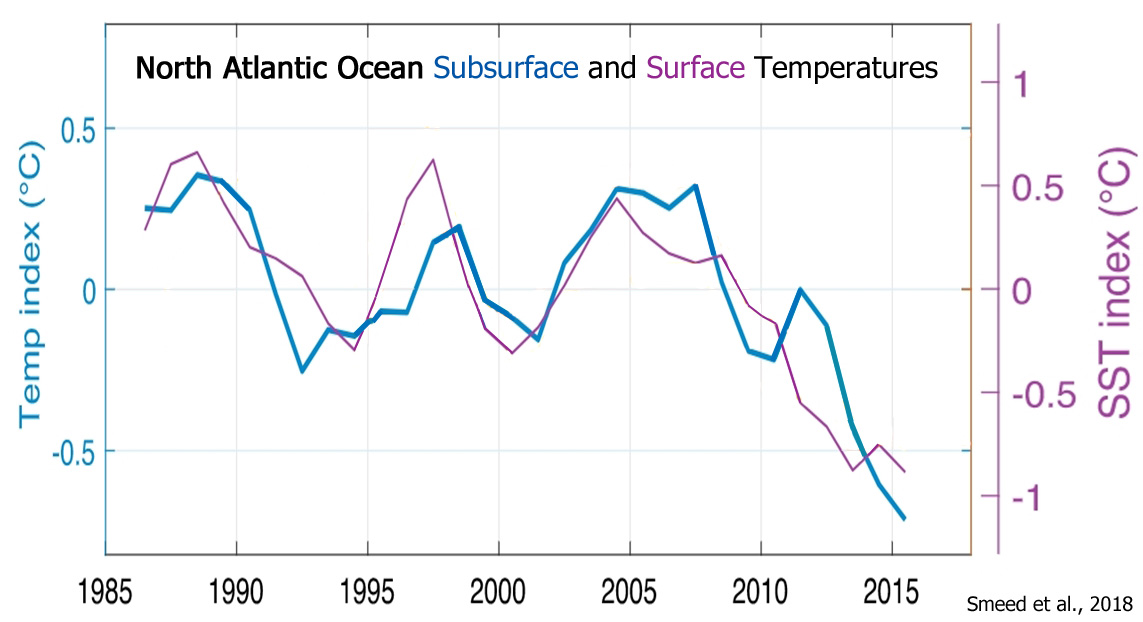
Smeed et al., 2018
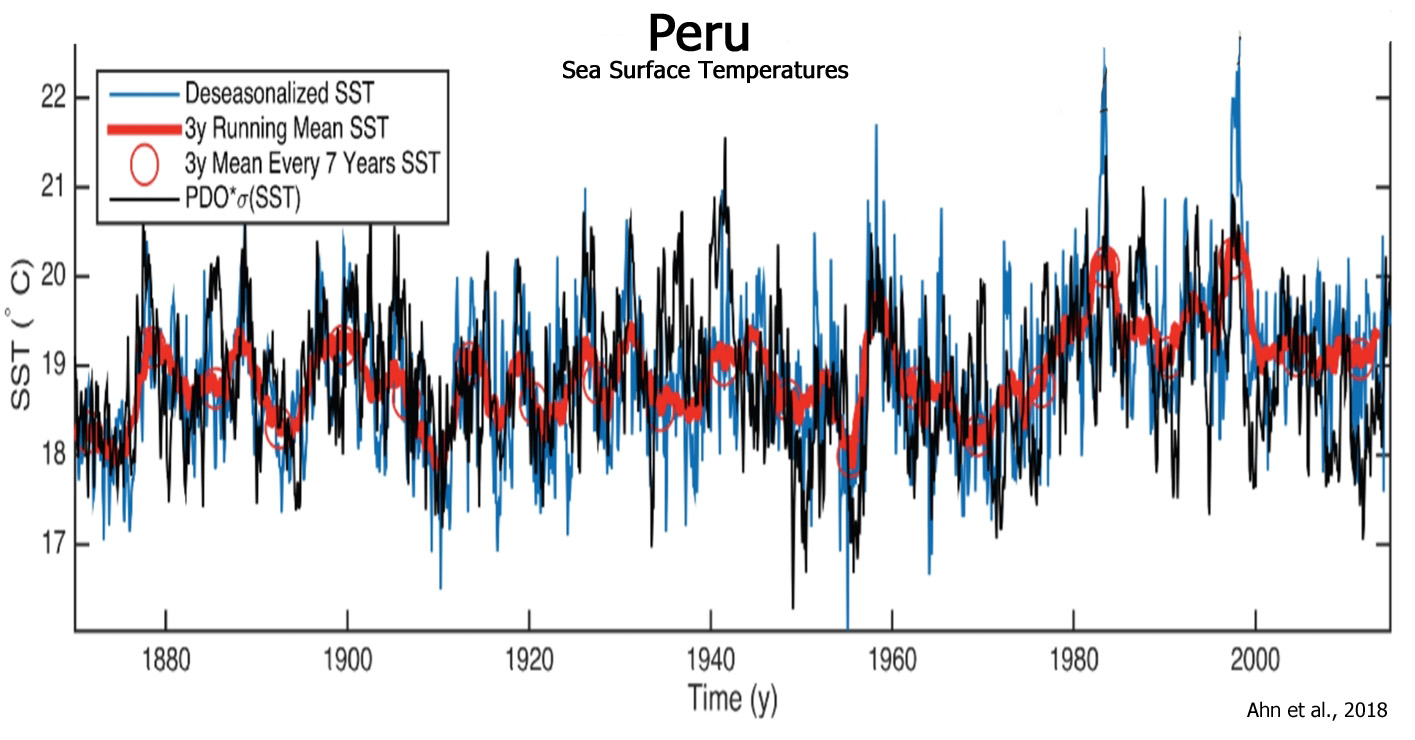
Ahn et al., 2018
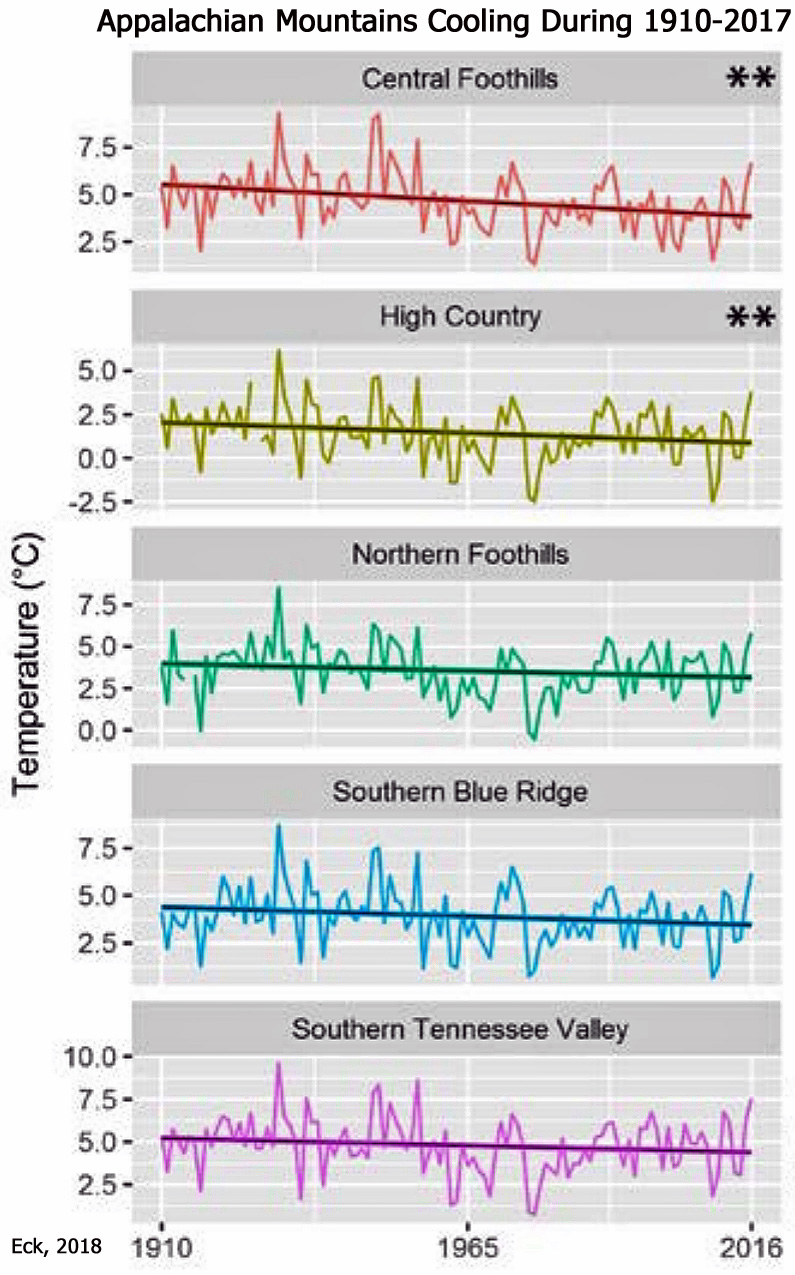
Eck, 2018
“[A] majority (12/14) of the regions within the SAM [Southern Appalachian Mountains] have experienced a long-term decline in mean winter temperatures since 1910. Even after removing the highly anomalous 2009-2010 winter season, which was more than two standard deviations away from the long-term mean, the cooling of mean winter temperatures is still evident. … Higher winter temperatures dominated the early 20th century in the SAM [Southern Appalachian Mountains] with nine of the ten warmest winter seasons on record in the region having occurred before 1960. The 1931-1932 winter season, the warmest on record, averaged 8.0°C for DJF [December-February], nearly 4.7°C higher than the 1987-2017 normal mean winter temperature of 3.3°C. … Despite the 2016-2017 winter season finishing with the highest mean temperatures (5.7ºC) observed in the SAM [Southern Appalachian Mountains] since 1956-1957, there have been several years of anomalous negative temperature anomalies, with the 2009-2010 (0.3ºC) and 2010-2011 (1.2ºC) winter seasons finishing as two of the coldest on record for all regions.”
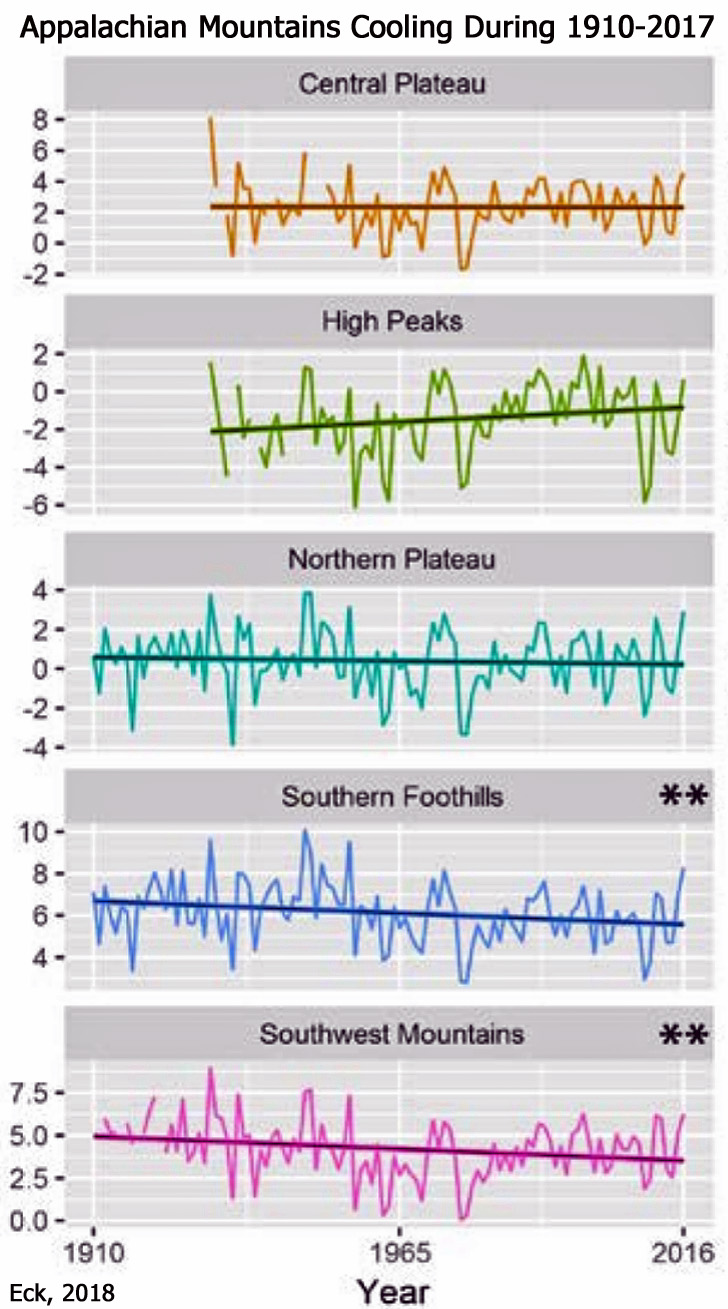

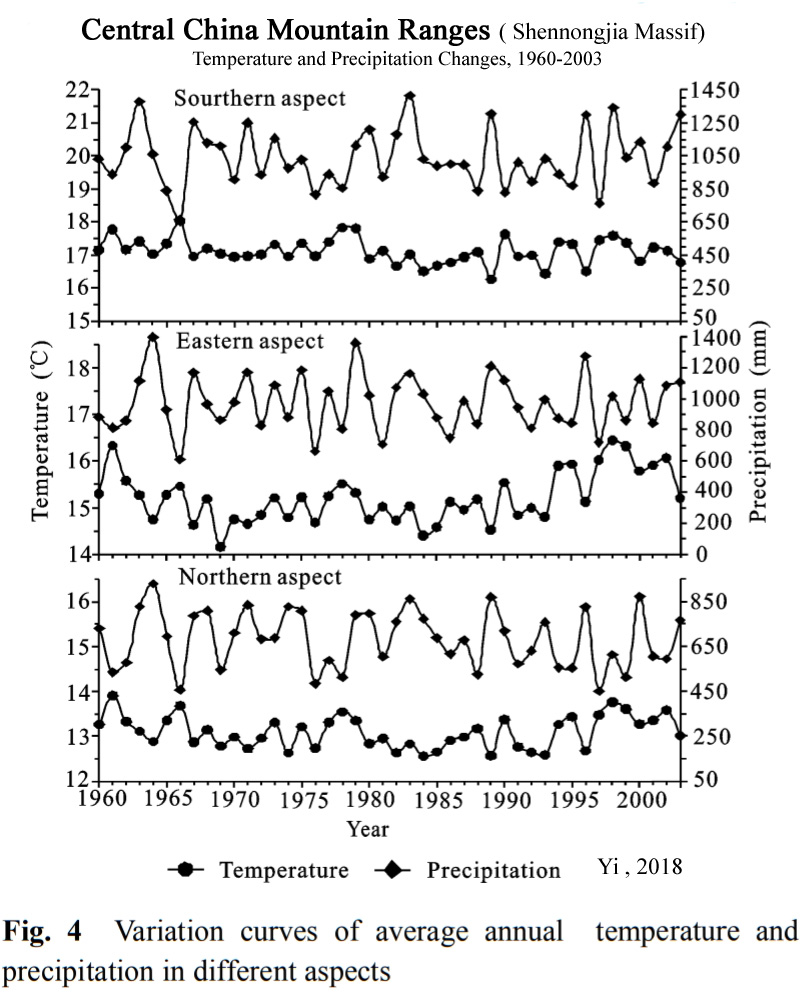
Yi, 2018
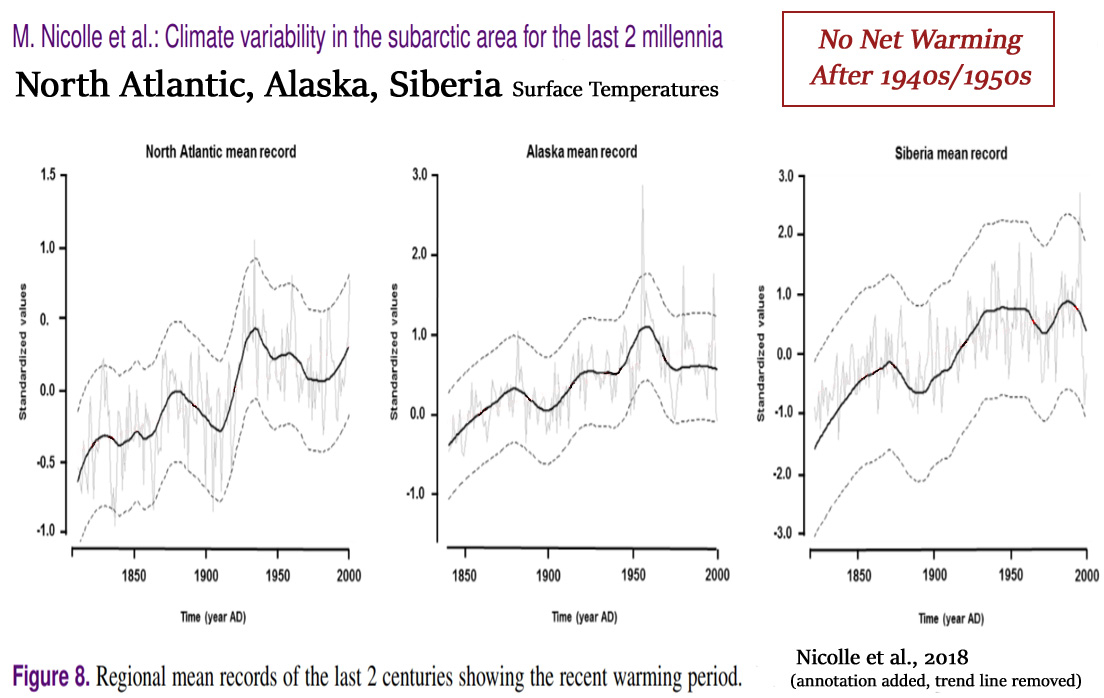
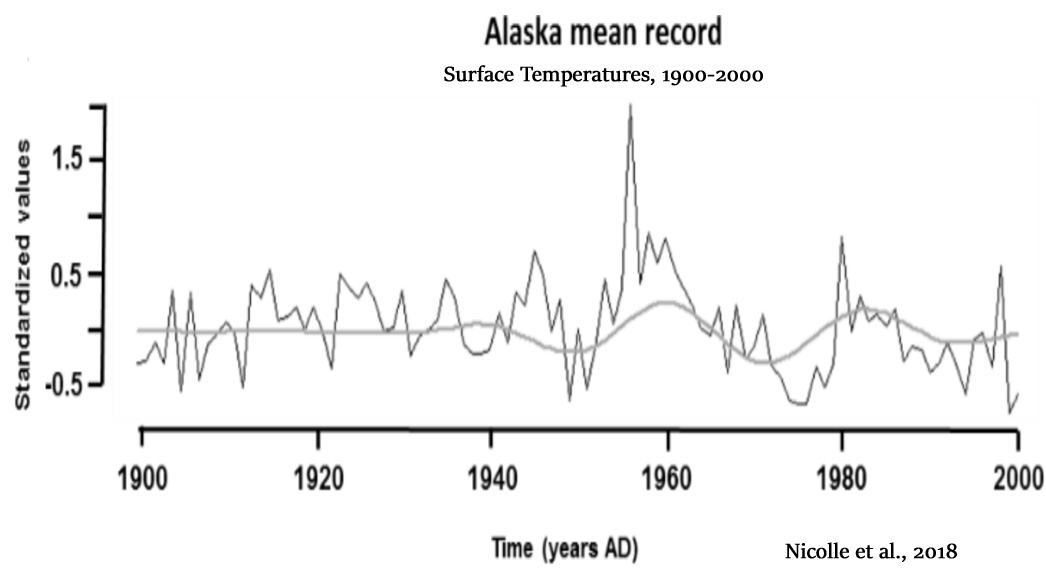
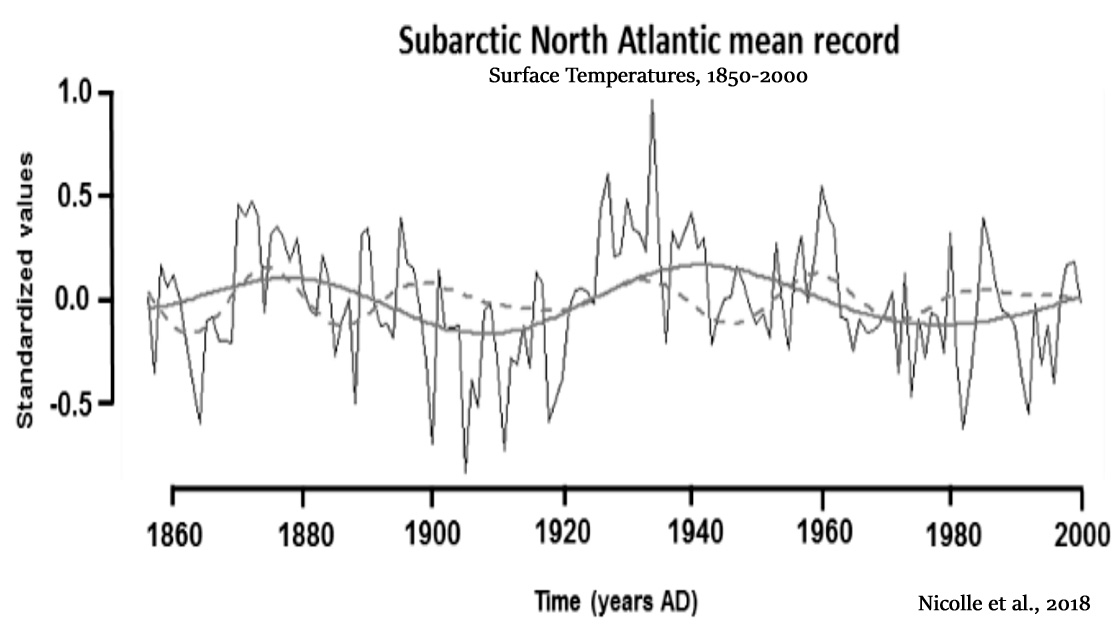
Nicolle et al., 2018
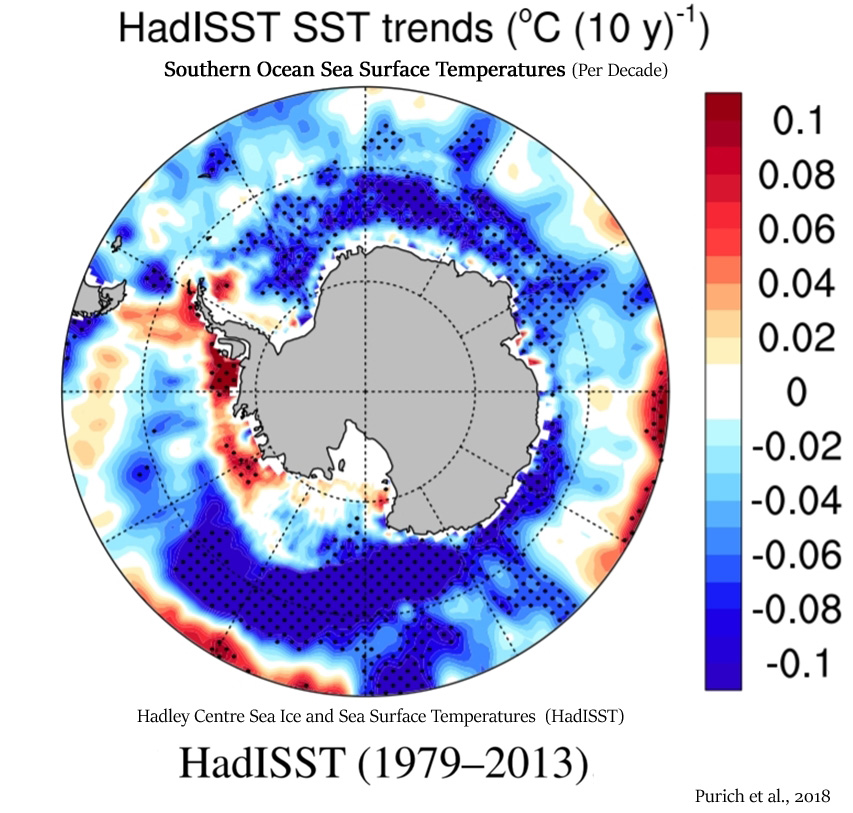
Purich et al., 2018
“Observed Southern Ocean changes over recent decades include a surface freshening (Durack and Wijffels 2010; Durack et al. 2012; de Lavergne et al. 2014), surface cooling (Fan et al. 2014; Marshall et al. 2014; Armour et al. 2016; Purich et al. 2016a) and circumpolar increase in Antarctic sea ice (Cavalieri and Parkinson 2008; Comiso and Nishio 2008; Parkinson and Cavalieri 2012). … Our results suggest that recent multi-decadal trends in large-scale surface salinity over the Southern Ocean have played a role in the observed surface cooling seen in this region. … The majority of CMIP5 models do not simulate a surface cooling and increase in sea ice, as seen in observations.”
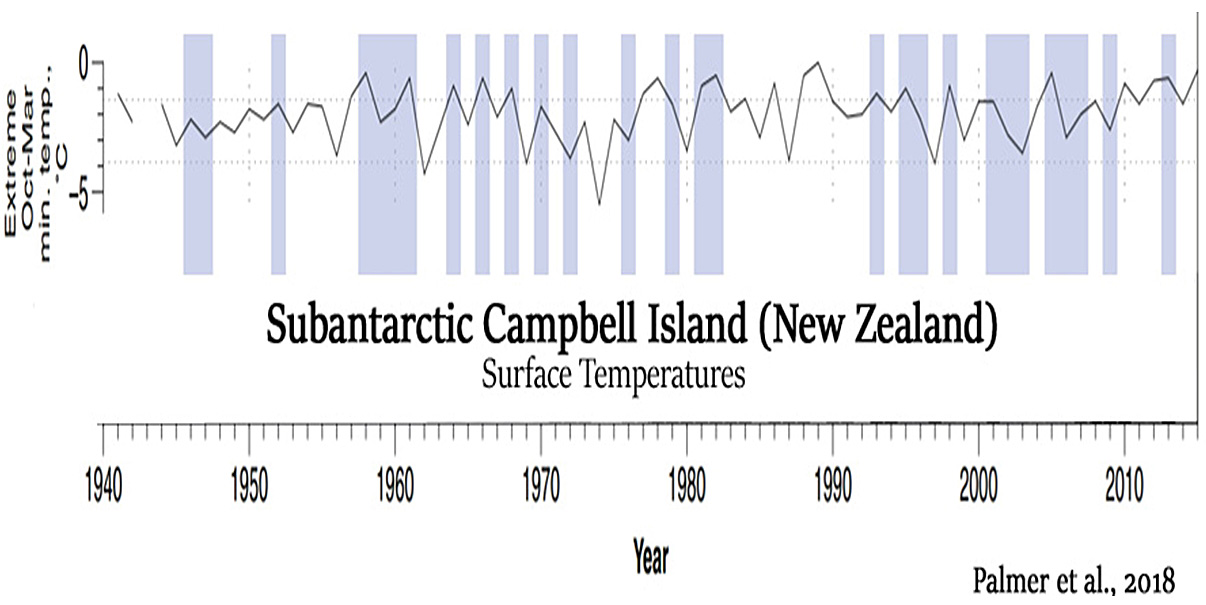
Palmer et al., 2018
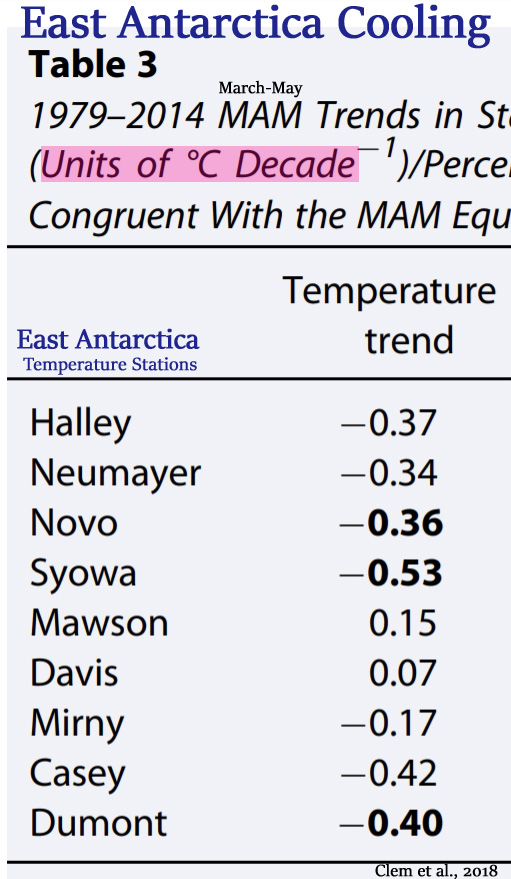
Clem et al., 2018
“This study finds recent (post-1979) surface cooling of East Antarctica during austral autumn to also be tied to tropical forcing, namely, an increase in La Niña events. … The South Atlantic anticyclone is associated with cold air advection, weakened northerlies, and increased sea ice concentrations across the western East Antarctic coast, which has increased the rate of cooling at Novolazarevskaya and Syowa stations after 1979. This enhanced cooling over western East Antarctica is tied more broadly to a zonally asymmetric temperature trend pattern across East Antarctica during autumn that is consistent with a tropically forced Rossby wave rather than a SAM pattern; the positive SAM pattern is associated with ubiquitous cooling across East Antarctica.”
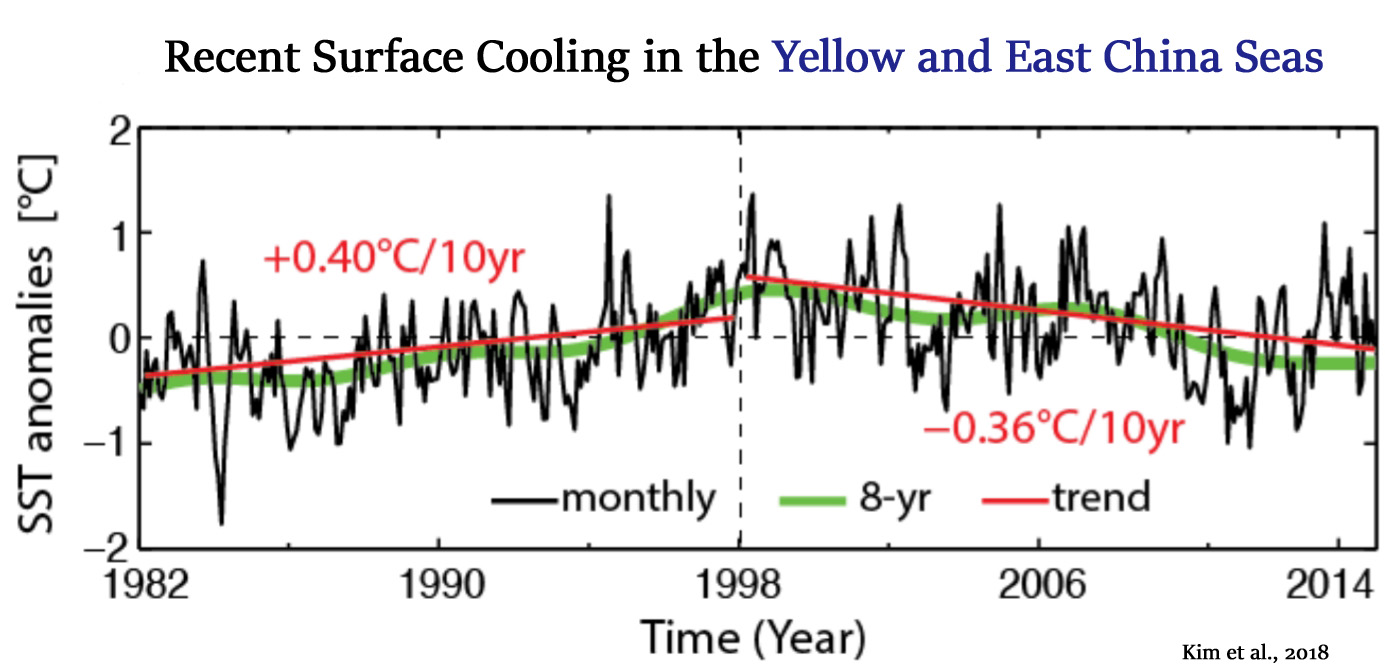
Kim et al., 2018
“Recent surface cooling in the Yellow and East China Seas and the associated North Pacific climate regime shift … The Yellow and East China Seas (YECS) are widely believed to have experienced robust, basin-scale warming over the last few decades. However, the warming reached a peak in the late 1990s, followed by a significant cooling trend. … The most striking evolution pattern is that a robust warming trend at a rate of +0.40°C per decade reached a peak in the late 1990s, and then it turned downward at a rate of −0.36°C per decade. The positive and then negative trends are estimated throughout the YECS for the periods 1982−1997.”
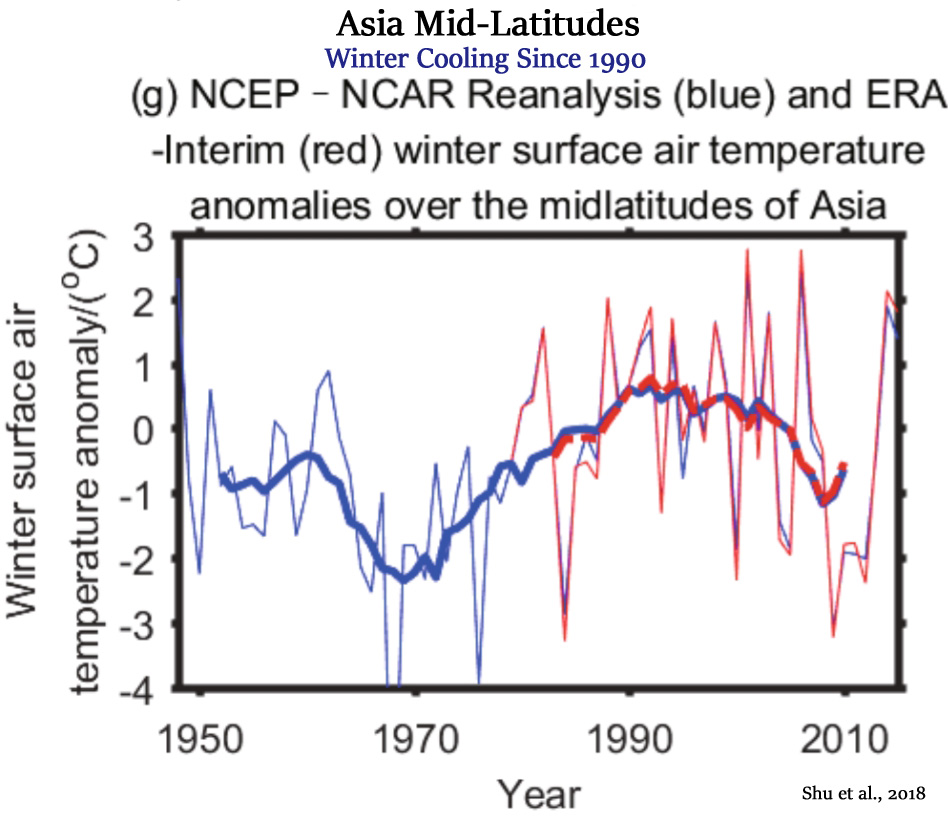
Shu et al., 2018
“The link between boreal winter cooling over the midlatitudes of Asia and the Barents Oscillation (BO) since the late 1980s is discussed in this study, based on five datasets. Results indicate that there is a large-scale boreal winter cooling during 1990–2015 over the Asian midlatitudes, and that it is a part of the decadal oscillations of long-term surface air temperature (SAT) anomalies.”
Mallory et al., 2018

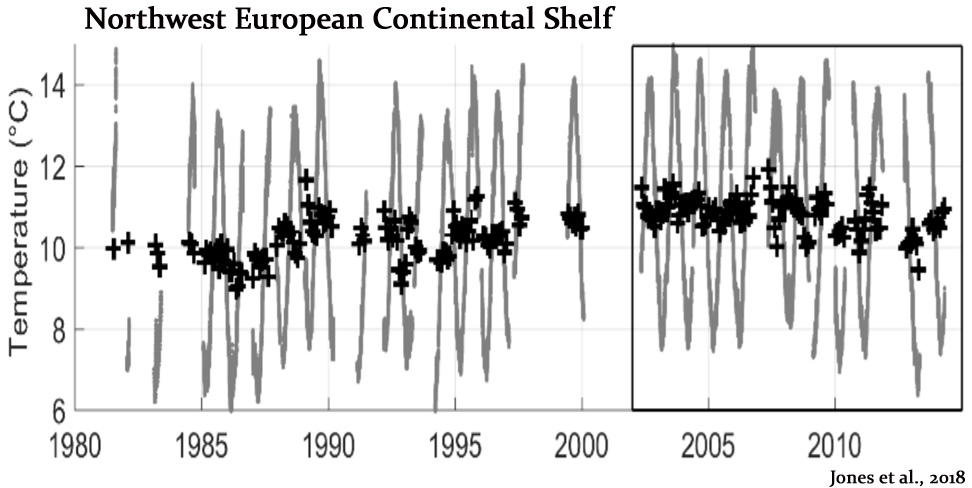
Jones et al., 2018



Climate “Science” on Trial; Temperature Records Don’t Support NASA GISS
One of the oddest aspects of climate “science” is that NASA, the organization that put a man on the moon, ignores its state of the art Satellite and balloon data, and instead relies upon archaic terrestrial ground measurements. Part of the NASA climate “science” community actually ignore the infinitely more accurate data from their satellites. The reason … Continue reading
https://co2islife.wordpress.com/2017/03/12/climate-science-on-trial-temperature-records-dont-support-nasa-giss/
Very evident that the small Modern Era Warm period is waning, this is not good news for life on this planet, including humans. Cold periods bring death, warm periods are very good for life, only those against life on earth would advocate any measures that cool the planet.
Proper name should be the Modern SLIGHTLY Warm Period
May it please last at least a few more decades. 🙂
Warmth, and added atmospheric CO2 are needed for continued world development.
The human and nature cost of a protracted cooling period would be horrific.
I like it AndyG55!
The MSWP has a nice ring to it.
The Modern SLIGHTLY Warm Period a time when mass delusion rules so much of humanity.
Why do the MSM ignore such papers?
Possibly because they do not support the narrative?
Great compilation, K 🙂
Interesting just how many of the 10,000 year graphs show that we really are pretty much at the COLDEST PERIOD during the Holocene.
We can be VERY THANKFUL for this SLIGHT temperature bump we are blessed to be living in, the Modern SLIGHTLY Warm Period.
And obviously, since the world is still here, and its been significantly warmer basically everywhere for most of the Holocene….
….WARMING IS NOT A PROBLEM,
but HIGHLY BENEFICIAL for ALL life on Earth.
Is SebH on holidays?
Where is he? out playing Hockey?
Don’t temp him/she/it.
DNFTT
Steve,
He’s off trying to recover his irrationality after realizing that he’s way out of his depth scientifically when offering his distractions, lies, and delusional fantasy nonsense.
Hopefully he’ll be gone for a long while.
Just my 2 shillings worth – a reminder that she be Michael Mann’s hockey stick has long been known to be junk science.
https://m.youtube.com/watch?v=cecmvYq_91A
Josh’s brilliant cartoon in response to Gergis et al (2012):
https://australianclimatemadness.files.wordpress.com/2012/06/josh_gergis_11.jpg
Hockey stick generation in a nutshell.
All our ski-field mountains in the South Island of New Zealand have just received a decent dump of CO₂ fallout (in Oldspeak we call it ‘snow’) which commenced bang-on the Autumn/Fall equinox on 21 March – Spring or Vernal equinox for northern hemi folk. We also received a half-metre (~2 ft) dump last month in the middle of our high summer… yet not a squeak was heard from the usual “It’s worse than we thought!” crowd of reporters, churnalists, climate communicators, experts, etc.
On the other hand, any breath of wind, any puff of cloud, any isobaric circle on a weather map, has been shouted from the rooftops as proof-positive that cyclones are becoming worse because (insert any latest inane brand name and/or excuse for CCC™). Except, they’re not:
http://tropical.atmos.colostate.edu/Realtime/index.php?loc=southernhemisphere
ACE – Accumulated Cyclone Energy – is still well BELOW the average/norm this year, just like last year… oops! Dang observed science, refuting climastrology’s prophets, again.
OT, Too much sea ice..
… a major problem this year around Newfoundland.
https://sunriseswansong.wordpress.com/2018/03/22/arctic-sea-ice-the-newfoundland-crunch/
Yes, its only wind-blown sea ice…
… but where did it come from, since according to Wadham et al, there is none in the Arctic. !! 😉
[…] – 200 Non-Hockey Stick Graphs Published Since 2017 Invalidate Claims Of Unprecedented, Global-Scale Wa… […]
Well done! Good to see more researchers pointing this out !
[…] days ago Kenneth presented an impressive flurry of scientific, peer-reviewed charts published over the past 15 months (46 alone in 2018). Much to […]
[…] Temperature reconstructions show the same is true in Southeast Australia, according to McGowan et al., 2018, Northern Alaska (Hanna et al., 2018), the Tibetan Plateau (Li et al., 2018), South Korea (Song et al., 2018), Antarctica (Mikis, 2018), to cite just a few among dozens of others. […]
[…] K. Richard, March 22, 2018 in […]
[…] days ago Kenneth presented an impressive flurry of scientific, peer-reviewed charts published over the past 15 months (46 alone in 2018). Much […]
[…] Temperature reconstructions show the same is true in Southeast Australia, according to McGowan et al., 2018, Northern Alaska (Hanna et al., 2018), the Tibetan Plateau (Li et al., 2018), South Korea (Song et al., 2018), Antarctica (Mikis, 2018), to cite just a few among dozens of others. […]
[…] Temperature reconstructions show the same is true in Southeast Australia, according to McGowan et al., 2018, Northern Alaska (Hanna et al., 2018), the Tibetan Plateau (Li et al., 2018), South Korea (Song et al., 2018), Antarctica (Mikis, 2018), to cite just a few among dozens of others. […]
[…] Temperature reconstructions show the same is true in Southeast Australia, according to McGowan et al., 2018, Northern Alaska (Hanna et al., 2018), the Tibetan Plateau (Li et al., 2018), South Korea (Song et al., 2018), Antarctica (Mikis, 2018), to cite just a few among dozens of others. […]
[…] https://notrickszone.com/2018/03/22/200-non-hockey-stick-graphs-published-since-2017-invalidate-claim… […]
[…] Temperature reconstructions show the same is true in Southeast Australia, according to McGowan et al., 2018, Northern Alaska (Hanna et al., 2018), the Tibetan Plateau (Li et al., 2018), South Korea (Song et al., 2018), Antarctica (Mikis, 2018), to cite just a few among dozens of others. […]
[…] Temperature reconstructions show the same is true in Southeast Australia, according to McGowan et al., 2018, Northern Alaska (Hanna et al., 2018), the Tibetan Plateau (Li et al., 2018), South Korea (Song et al., 2018), Antarctica (Mikis, 2018), to cite just a few among dozens of others. […]
[…] Temperature reconstructions show the same is true in Southeast Australia, according to McGowan et al., 2018, Northern Alaska (Hanna et al., 2018), the Tibetan Plateau (Li et al., 2018), South Korea (Song et al., 2018), Antarctica (Mikis, 2018), to cite just a few among dozens of others. […]
[…] Temperature reconstructions show the same is true in Southeast Australia, according to McGowan et al., 2018, Northern Alaska (Hanna et al., 2018), the Tibetan Plateau (Li et al., 2018), South Korea (Song et al., 2018), Antarctica (Mikis, 2018), to cite just a few among dozens of others. […]
[…] Temperature reconstructions show the same is true in Southeast Australia, according to McGowan et al., 2018, Northern Alaska (Hanna et al., 2018), the Tibetan Plateau (Li et al., 2018), South Korea (Song et al., 2018), Antarctica (Mikis, 2018), to cite just a few among dozens of others. […]
[…] days ago Kenneth presented an impressive flurry of scientific, peer-reviewed charts published over the past 15 months (46 alone in 2018). Much to […]
[…] Temperature reconstructions show the same is true in Southeast Australia, according to McGowan et al., 2018, Northern Alaska (Hanna et al., 2018), the Tibetan Plateau (Li et al., 2018), South Korea (Song et al., 2018), Antarctica (Mikis, 2018), to cite just a few among dozens of others. […]
[…] 3.Mer enn 40 vitenskapelige publikasjoner i 2018 (pr 22.mars), listet opp her. […]
[…] fact, even during 2017, there were 150 graphs from 122 scientific papers published in peer-reviewed journals indicating modern temperatures are not unprecedented, unusual, or […]