Arctic Sea Ice Extent Higher During 1954-2001
Than Almost Any Period In The Last 9,000 Years
During the Roman Warm Period ~2,000 years ago, sea levels were significantly higher than they are now. Modern coastlines are 2 miles down from where they were during the Roman invasion of Britain in 43 AD, strongly implying that surface air temperatures were much warmer ~2,000 years ago compared to today.
“An archaeological dig at a Kent fort has uncovered the coastline at the time of the Roman invasion of Britain in 43AD – two miles from today’s shore.”
During that same time period, the western Arctic Ocean was covered in sea ice (>50%) only about 5 or 6 months per year (McKay et al., 2008).
By comparison, the western Arctic is covered in sea ice (>50%) about 10.5 months per year during the modern era (1954-2001), suggesting a much cooler Arctic region today.
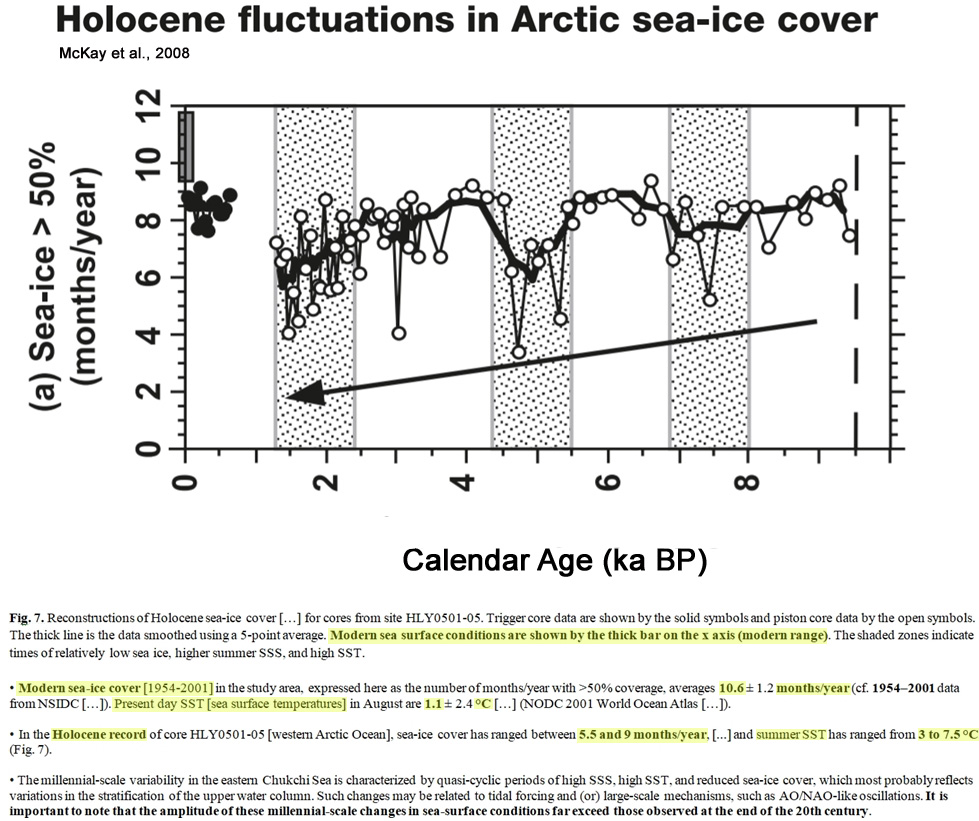
Graph Source: McKay et al., 2008
Arctic temperatures at the beginning of the first millennium were between 2° and 6°C warmer than they are now, as paleoclimate evidence suggests summer Arctic sea surface temperatures ranged between 3°C and 7.5°C about 2,000 years ago, whereas they average about 1.1°C today.
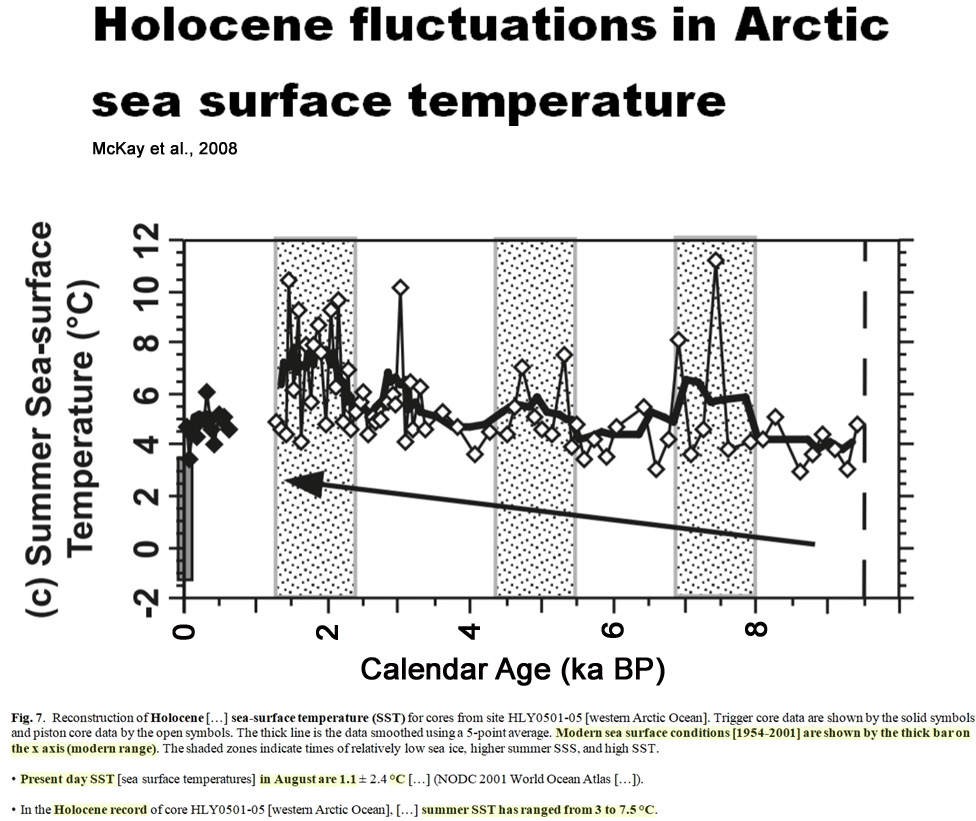
Graph Source: McKay et al., 2008
Other authors have found Arctic region temperatures oscillated profoundly between about 3°C cooler than today and 6°C warmer than today, with sea ice fluctuating between 2 months more sea ice coverage than today and 4 months less sea ice coverage than today.
“Our data show that from ∼6500 to 2600 yrs BP, there were large oscillations in [Canadian Arctic] summer SST from 2–4°C cooler than present to 6°C warmer and SIC [sea ice cover] ranged from 2 months more sea ice to 4 months more open water [than present]. The warming took ∼50–100 years and lasted ∼300 years before replacement by colder intervals lasting ∼200–500 years.”

Graph Source: Mudie et al., 2005
It is widely recognized that modern Arctic region sea ice concentrations are considerably more advanced today than they were a few thousand years ago, with most studied regions showing the increase in sea ice extent occurring “over the last centuries”.
“[W]hereas many core data show little difference between the 1953-2003 sea ice average and the late Holocene reconstruction, some cores are characterized by large differences (Fig. 4). In particular, the late Holocene data of the Chukchi Sea and the Nordic Seas off eastern Greenland, suggest much less sea ice than what was observed at the scale of the last decades. … At the Beaufort Sea sites, the variations are of limited amplitude and the estimates are close to “modern” observations, but all records show an increase of the sea ice cover over the last centuries. At the Chukchi site, the record shows large amplitude variations with a distinct trend for an increased sea ice cover towards modern values over the last centuries. … Particularly high export rates of sea ice through the East Greenland Current have been attributed to extreme AO/NAO synopses (e.g., Dickson et al., 2000; Vinje, 2001; Rigor et al., 2002). It is thus possible that the 1953-2003 mean sea ice extent along the east Greenland relates to an unusually strong positive NAO. … The early Holocene (9-6 ka) data suggest negative anomalies in the eastern Fram Strait (MSM712), the southern Labrador Sea (HU094), the Estuary of St. Lawrence (MD2220) and the northernmost Baffin Bay (HU008). These sites recording less sea ice and thus warmer conditions [than present] are all located in areas under the influence of North Atlantic waters.”
In the Beaufort Sea region of the Arctic, surface temperatures were still up to 3°C warmer than today during the late 1800s.
There was also less sea ice during this time (1887-1945), as the sea ice cover disappeared 1.1 month sooner than it does today.
“Sea surface temperature [Arctic Ocean] between ∼ AD 1885–1935 are warmer by up to 3°C with respect to the average modern temperature at the coring site.
“For the period ∼ AD 1887–1945, reconstructed sea ice cover values are on average 8.3 months per year which is 1.1 months per year lower than the modern values.”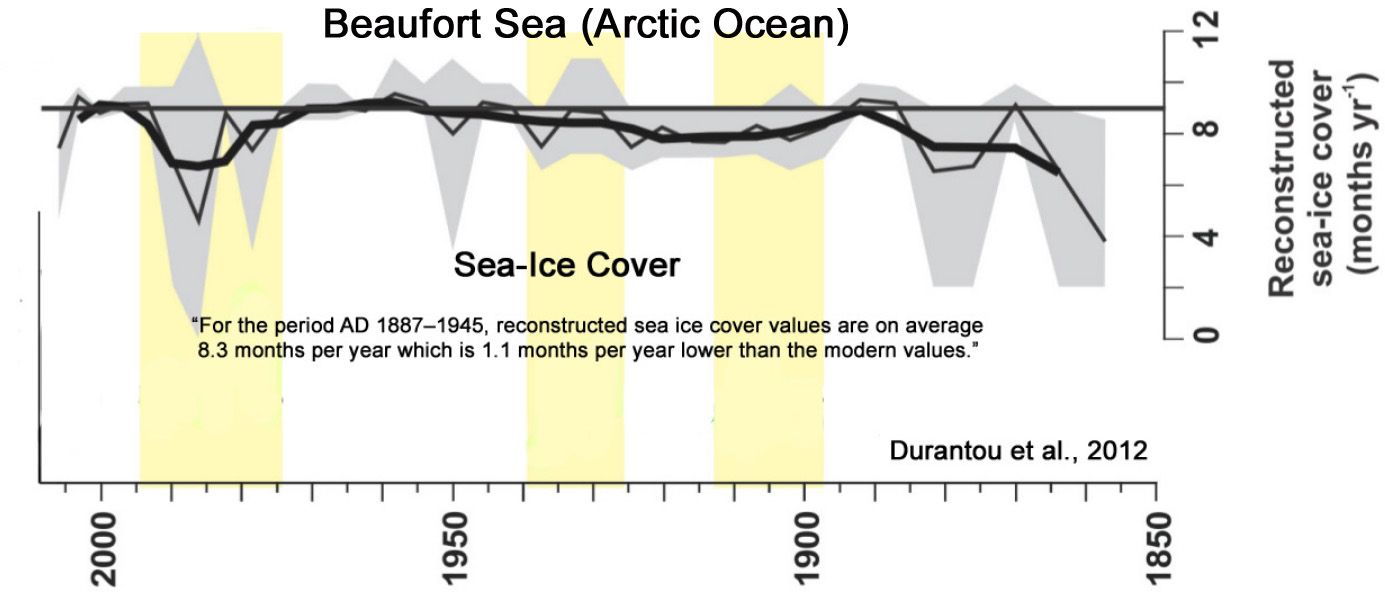
Graph Source: Durantou et al., 2012
In Southwest Greenland, the overall sea ice concentration has grown dramatically since the 1930s. The modern (2010) extent is no lower than it was during several decadal-scale periods in the 18th century (Kryk et al., 2017).
For the Eastern Fraim Strait, the Southeast Barents Sea, and North Iceland, there was considerably less sea ice coverage (as assessed in months-per-year) during the late 1600s to early 1700s than there has been during the last few decades.
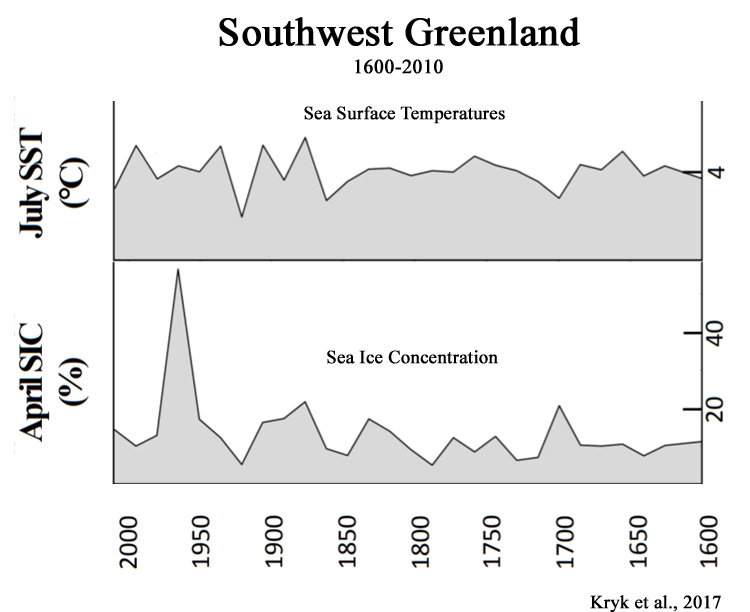
Graph Source: Kryk et al., 2017
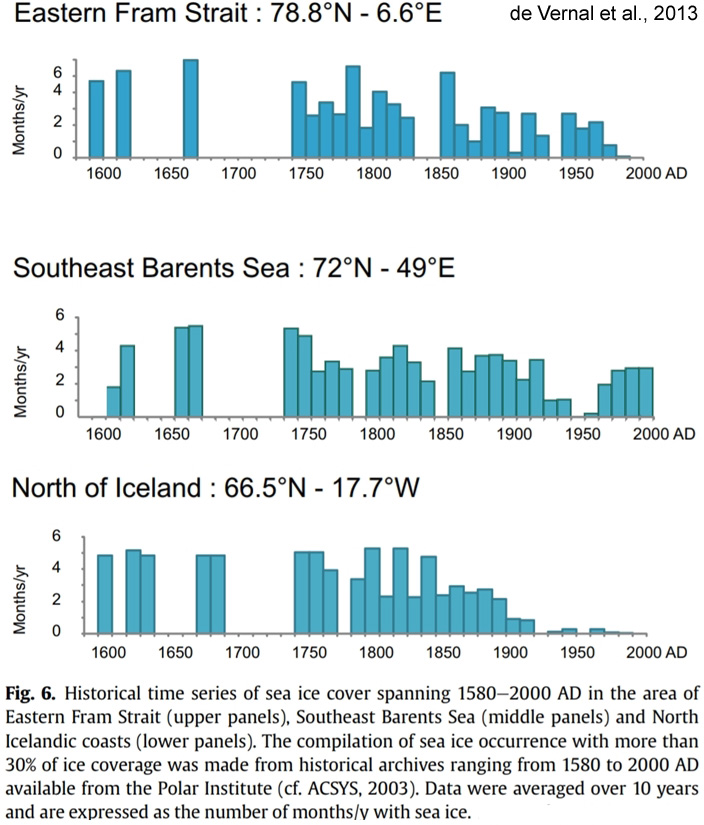
Graph Source: de Vernal et al., 2013
Recently published graphs of Holocene Arctic region sea ice extent also support the conclusion that modern era sea ice is much more extensive than it has been for almost all of the last several thousand years.
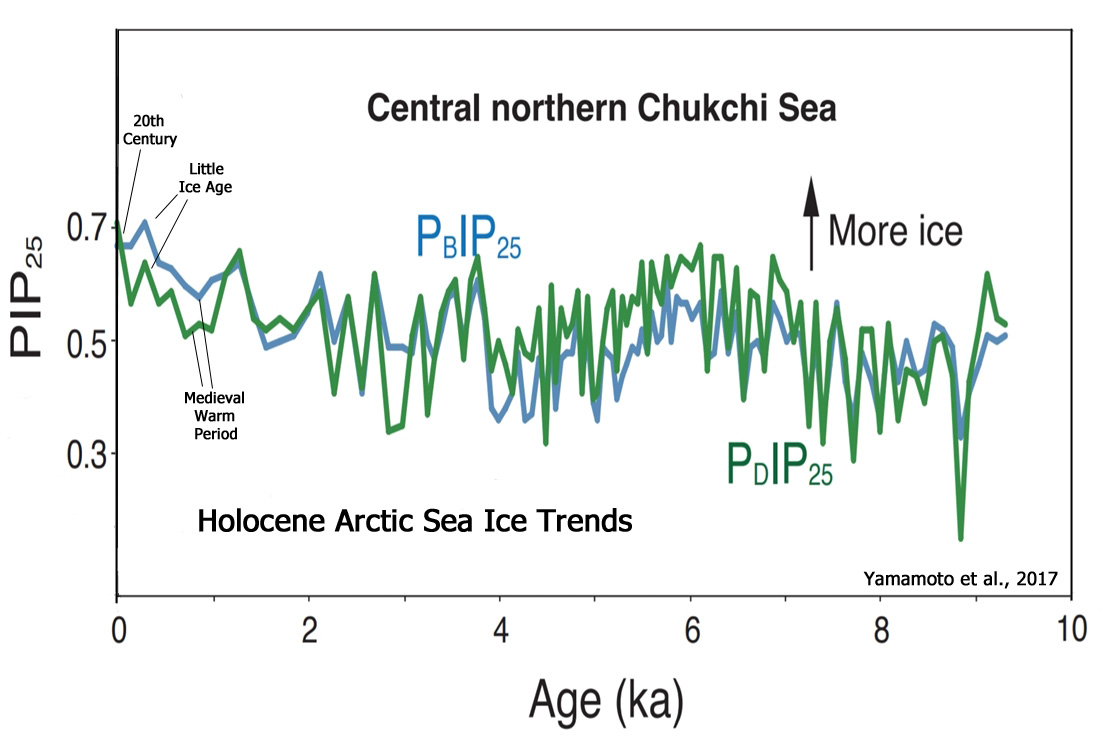
Graph Source: Yamamoto et al., 2017
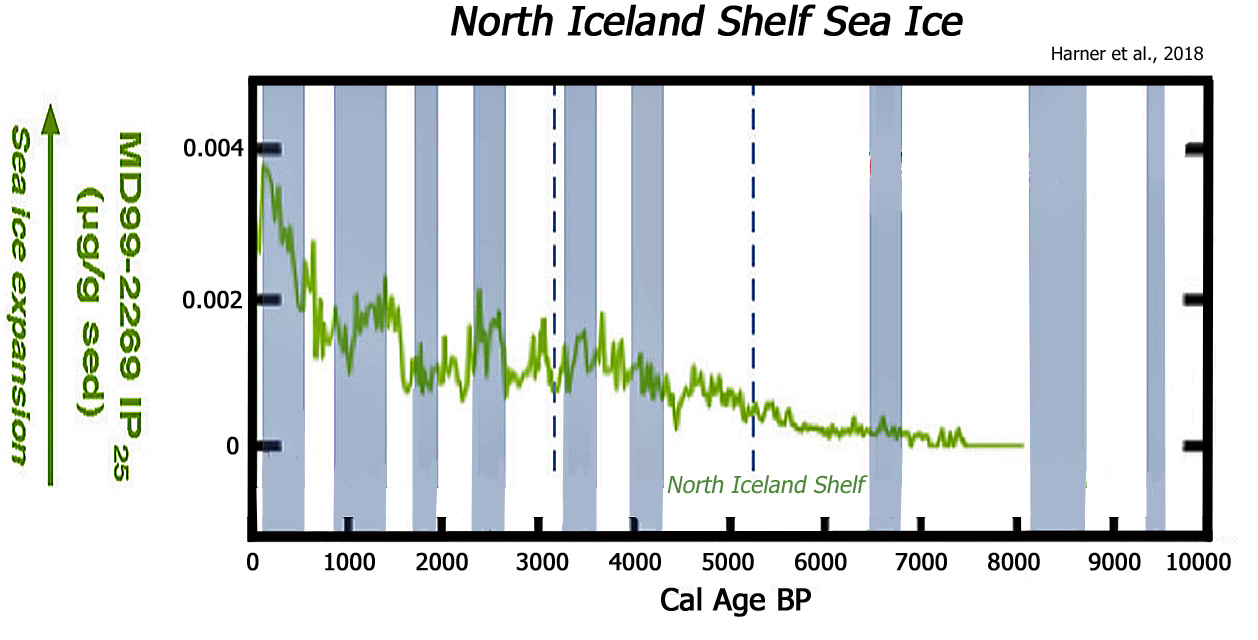
Graph Source: Harning et al., 2018
In sum, it is well established in the scientific literature that modern day sea ice values in the Arctic region are not unprecedented, unusual, or even remarkable relative to the last few thousand years.


[…] Arctic Temps 2°-6°C Warmer Than Today With 4.5 Fewer Months Of Sea Ice Coverage 2,000 Years Ago […]
“During the Roman Warm Period ~2,000 years ago, sea levels were significantly higher than they are now.
>>>Modern coastlines are 2 miles further inland compared to where they were during the Roman invasion of Britain in 43 AD, strongly implying that surface air temperatures were much warmer ~2,000 years ago compared to today.”<<<
Wait.. what?! how does that compute?
Well, this borders on lying. You probably have read the paper you lifted that graph from, haven’t you? So why claim that it would depict “the Arctic is covered in sea ice (>50%)”?
So … do you know what is pictured in this graph or did you misread the caption?
Another honest mistake? It doesn’t say sooner, it says the timespan was shorter. And when we look at the location of the core that was used … surprise, about the same as in the McKay paper.
They don’t really need to be. If the current decrease is largly our doing, it will continue for quite some time. As you surely know, Arctic sea ice extent was pretty stable in the 20th century and began to decrease from the late 1970s on: https://imgur.com/a/tfoSK3F (Connolly 2017)
So image another 40 years of decrease and another … will 2100 sea levels look like at the height of the Roman Empire? What took 2000 years to build up, gone in just over a century? And you call this “not unprecedented, unusual or remarkable”?
Well, I guess you’d need a “Day after Tomorrow” (movie) level climate change to become convinced that it really is happening. Correct? 😉
https://s19.postimg.cc/v8vll8mdf/old_ice.png
Old ice is pretty close to 50%, and that’s as low as it got.
Seen seb is bordering on DECEIT , yet again.
“If the current decrease is largly our doing,”
And seb drifts off into anti-science FANTASY land yet again
ZERO evidence the slight but beneficial drop in sea ice has anything to do with human anything
You are ABSENT OF EVIDENCE, as always, seb.
“Arctic sea ice extent IS pretty stable “ (corrected for you)
Arctic sea ice was about the same in the 940s as now.. so yep, apart from the extreme extent around the mid/late 1970s (coldest period in the Arctic since 1900) its been pretty stable, and is STILL in the TOP 10% of Holocene sea-ice extents.
“So IMAGINE another 40 years of decrease and another “
This is what seb spends his time doing…
….. FANTASY imagining from AGW La-La-Land.
Have you misunderstood was is meant by 50% in the post?
Must be something wrong with my eyes then … can’t see anything supporting this in the reconstruction of the paper Kenneth likes to cite so often:
https://imgur.com/a/tfoSK3F
The reconstruction from the Alekseev paper that is based upon Arctic temperatures — which were the same in the 1930s as the last decade — has Arctic sea ice looking like this:
https://notrickszone.com/wp-content/uploads/2018/04/Arctic-Sea-Ice-Extent-1900-2013-Alekseev-2015-Connolly-2017.jpg
Or notice that the red observation trend line for sea ice concentration (lower in the 1950s than it was after the 2000s) in Gagne et al, 2017:
https://notrickszone.com/wp-content/uploads/2017/02/Arctic-Sea-Ice-No-Net-Change-Since-1950-Gagne-2017.jpg
https://earthobservatory.nasa.gov/blogs/earthmatters/files/2017/03/Screen-Shot-2017-03-28-at-10.33.26-AM-720×452.png
“The red line reflects Arctic and Antarctic Research Institute (AARI) data, which is based on historical sea ice charts from several sources (aircraft, ship, and satellite observations).”
And there it is again. The cherry picked graph from the Connolly paper that they compared their result to. You obviously agree with what you see in there, but why do you ignore the rest of the Connolly paper? Not happy about what they did?
I not only didn’t ignore it, I featured it an the graphs in an article and included them in the “500 papers” list for 2017.
“According to this new dataset, the recent period of Arctic sea ice retreat since the 1970s followed a period of sea ice growth after the mid 1940s, which in turn followed a period of sea ice retreat after the 1910s. Our reconstructions agree with previous studies that have noted a general decrease in Arctic sea ice extent (for all four seasons) since the start of the satellite era (1979). However, the timing of the start of the satellite era is unfortunate in that it coincided with the end of several decades during which Arctic sea ice extent was generally increasing. This late-1970s reversal in sea ice trends was not captured by the hindcasts of the recent CMIP5 climate models used for the latest IPCC reports, which suggests that current climate models are still quite poor at modelling past sea ice trends. Nor is it described in previous Arctic sea ice reconstructions such as the Walsh dataset or the widely used HadISST sea ice dataset, although some recent studies have noted similar reversals, e.g. Pirón and Pasalodos (2016) and Alekseev et al. (2016).”
That’s the keyphrase you should have highlighted. Combined with the graphs that paper paints a completely different picture than you are trying to paint …
A super slow rise until the end of the 70s, then a rather fast decline. That’s what happened according to Connolly.
seb STILL hasn’t learnt anything about the AMO.
Bad boy.. go to the back of the class.
Ohh.. you are already there. !!. !!
“Must be something wrong with my eyes then ”
Try to keep more than one tiny thought in your head at a time, seb
https://s19.postimg.cc/a2p8qx7oz/Arctic-_Sea-_Ice-_Changes-_Chukchi-_Sea-_Yamamoto-2017.jpg
https://s19.postimg.cc/vgdnb299v/Arctic-_Sea-_Ice-_Holocene-_Stein-17.jpg
https://s19.postimg.cc/v6om69bj7/Arctic-_Sea-_Ice-_Extent-_North-of-_Iceland-3000-_Years-_Moffa-_S_nchez-.jpg
https://s19.postimg.cc/8zhof46gz/Arctic_Greenland-_Sha-17.png
Arctic sea ice is very much I the top 10% for the Holocene, no matter if you can ACCEPT THE FACTS, or not.
None of those constructions bare any resemblance to temperature
Are you now saying that Arctic sea is not driven by temperature?
Still having trouble keeping your [snip] in a coherent rational format, I see.
Please just read the paper. It’s not a temperature proxy reconstruction, it is using temperature to adjust another reconstruction. The graph Kenneth likes to post (Alekseev) is a temperature proxy reconstruction however.
Temperature and arctic sea ice are reverse-correlated, according to seb.
The Alekseev graph is reverse-correlated with real temperatures.
What is your problem accepting your very own meme ???
You weren’t LYING to yourself, were you, when you said temperature drives Arctic sea ice.
Or are you again suffering cognitive deceit.
And yet I don’t see any specification as to what “lie” is being told here.
The graph and text here indicate that the Arctic had 10.6 months (I generously rounded down to 10.5) with greater than 50% sea ice coverage, and 1.1 degrees C average summer temperatures during the 1950s to 2000s, whereas it had only 5 to 9 months of greater than 50% coverage during the Holocene, when SSTs averaged 3 to 7.5 degrees C, 2 to 6 degrees C warmer than present.
Present:
“Modern sea-ice cover in the study area, expressed here as the number of months/year with >50% coverage, averages 10.6 ± 1.2 months/year (cf. 1954–2001 data from NSIDC”
–
Present-day SST […] in August are 1.1°C ± 2.48°C(NODC 2001 World Ocean Atlas)
———-
2,000 years ago (and earlier):
“In the Holocene record of core [Western Arctic Ocean], sea-ice cover has ranged between 5.5 and 9 months/year, […] and summer SST has ranged from 3° to 7.5°C (Fig. 7).”
–
These values are similar those found in the Mudie et al (2005) paper:
“Our data show that from ∼6500 to 2600 yrs BP, there were large oscillations in [Canadian Arctic] summer SST from 2–4°C cooler than present to 6°C warmer and SIC [sea ice cover] ranged from 2 months more sea ice to 4 months more open water [than present].”
Kenneth, you of all pedantics with words … you don’t see what you did here? So I guess honest mistake while wearing the skeptics goggles.
Hint: “Modern sea-ice cover in the study area” and “In the Holocene record of core HLY0501-05 [Western Arctic Ocean]”
Those figures are the number of months the area where this core is located (North Alaska/Canada) experienced greater than 50% sea ice coverage. They don’t support “the western Arctic is covered in sea ice (>50%) about 10.5 months per year during the modern era (1954-2001)”. Not at all.
Um, I still don’t see a substantive difference between what they wrote and what I wrote:
They wrote: “Modern sea-ice cover in the study area, expressed here as the number of months/year with >50% coverage, averages 10.6 ± 1.2 months/year (cf. 1954–2001 data from NSIDC)”
I wrote: “the western Arctic is covered in sea ice (>50%) about 10.5 months per year during the modern era (1954-2001)”
Mine’s shorter. During the Holocene, the same area was covered in >50% sea ice only 5 to 9 months a year instead of 10.6 months during modern times.
[T]he late Holocene data of the Chukchi Sea and the Nordic Seas off eastern Greenland, suggest much less sea ice than what was observed at the scale of the last decades. … At the Beaufort Sea sites, the variations are of limited amplitude and the estimates are close to “modern” observations, but all records show an increase of the sea ice cover over the last centuries. At the Chukchi site, the record shows large amplitude variations with a distinct trend for an increased sea ice cover towards modern values over the last centuries“ – de Vernal et al., 2013
So, once again, you have failed to support your accusation of “lying”, an accusation which I can’t help but think was itself purposefully dishonest. As was your intent in trying to imply that I didn’t understand the graphs or the text beneath them.
No, you didn’t. When you edit your post (added “western”) you should also edit comments quoting the part if the goal was to hide this …
Yep, the same area (a very small one, . Not the Arctic as a whole as you originally wrote.
Well, you wrote that your graph would show sea ice extent of the Arctic back then. It still doesn’t do that. So do you understand what the graph shows and how limited the study area is? Also, have you read what McKay wrote in the part titled “Discussion”? He mentions that their findings are in direct contrast to what happened in the eastern Arctic. So your claim that because some point at the Arctic circle (north Iceland) has experienced certain temperature and sea ice variations, it must be true for the whole Arctic, is also false …
Or do you happen to disagree with the author on the inconvenient parts?
Do you understand the Connolly graphs? 😉
I never wrote that the area analyzed in McKay et al. (2008) was “the Arctic as a whole”. You’re engaging in intentional dishonesty yet again, SebastianH. When I refer to “Arctic sea ice” for an area of the Arctic that is part of a study, I’m doing nothing different than what McKay et al. (2008) did when they entitled their paper “Holocene fluctuations in Arctic sea-ice cover” — and then specified the region of the Arctic their study represents. Or, as another example I just looked up, when the authors of Jennings et al., (2002) write about “The data indicate that severe Arctic sea-ice events began in the Neoglacial interval”, they are making this claim based upon an accumulation of evidence for specific regions in the Arctic. They necessarily aren’t talking about “the Arctic as a whole”.
As everyone understands, there is no satellite data that covers “the whole of the Arctic” for Holocene Arctic sea ice reconstructions. I would have assumed that you, too, would understand that there is no such thing as Holocene sea ice data that covers the “whole of the Arctic”. But, apparently not. So I will spell this out for you: When I write about “Arctic sea ice” for the Holocene, I am not talking about “the Arctic as a whole”, but the particular region where the study data is derived. I should not have to specifically spell this out for people like you each and every time so as to avoid your disingenuous “gotcha” gamesmanship. It is not “lying” to omit the fact that we do not have satellite data that covers “the Arctic as a whole”. It’s understood. By everyone. Only people like you — who have nothing of substance to offer in the way of a rebuttal — decide to try to claim it’s a lie to not spell this out each and every time something is written about Holocene sea ice in the Arctic.
Unbelievable. There was never any “hiding”. After reading what you wrote, I thought/agreed it would indeed be better if I added the word “western” to indicate the area of the Arctic where the study was conducted. I agreed that I should probably be more specific. Not because I was “hiding” something, but because that would be more accurate.
I didn’t write that “my” graph shows sea ice extent for “the whole of the Arctic”. That’s your false claim.
That is not my claim. That’s you making up a claim and then fabricating that I wrote it. I have never written that Holocene Arctic sea ice reconstructions are representative of the “the whole of the Arctic”. Your dishonesty is loathsome.
3 places around the Arctic have very similar reconstructions.
The two main places for sea ice expansion are passed Iceland/Greenland and the Chukchi sea.
Only place missing is the Russian and Alaskan shorelines
Unless you think the Russian and Alaskan regions are going to maintain high sea ice while Iceland/Greenland seas and Chukchi Sea have MUCH LOWER sea ice (like most of the first 8000 years of the Holocene)
…. then the WHOLE Arctic is pretty much covered, and matches the pattern as seen in this graph.
https://s19.postimg.cc/vgdnb299v/Arctic-_Sea-_Ice-_Holocene-_Stein-17.jpg
Arctic sea ice is currently in the TOP 10% of Holocene extents, only marginally down from the Anomalously high extents of the LIA and mid/late 1970s.
In sum, it is well established in the scientific literature that modern day sea ice values in the Arctic region are not unprecedented, unusual, or even remarkable relative to the last few thousand years.
They really don’t need to be for what? To make us believe?
And if it isn’t largely our doing, and it follows a naturally oscillating pattern, then not only will the post-2007 pause continue but we can expect to see an increase in sea ice in the coming decades.
Is the current increase in Southern Hemisphere sea ice “largely our doing”? If not, what natural mechanism is responsible for the cooling and sea ice growth?
Not if the 1980s-present trend continues, where there is more land area ABOVE sea level across the coasts of the world today than there was in the 1980s. In other words, the coasts aren’t going to be submerged any more than they are now if current trends continue.
To be convinced that WHAT really is happening? That sea levels have risen a whopping 3.1 inches since 1958 (Frederiske et al., 2018)?
@Kenneth Richard
A day after tomorrow????l – lololol
Finally, some clarity, more so here than in his previous posts, what few I’ve read anyway, that for him climate fiction informs his thinking far more than climate fact.
Here, where it isn’t yet the day after tomorrow, but just the day after yesterday. AKA “reality,” and we see nothing out of the ordinary occurring. But, even we did, it would be way to early to blame it on humanity. I’ll leave that judgment to the scientists of a century or two after the next, and pray they are more objective than the current seemingly mostly inferior crop (at least those in charge, anyway).
K, you forgot the Greenland region
https://s19.postimg.cc/8zhof46gz/Arctic_Greenland-_Sha-17.png
So we have 3 very similar reconstructions from around the Arctic showing that Sea ice is only a small mount down from its most extreme extent in the whole Holocene.
These graphs match the temperatures from GISP quite well, further showing their correctness.
Glas you mention GISP. Do you know how modern temperature compare to the temperatures recorded in that dataset?
Then add to it the 1.6°C further warming proposed by Box et. al 2009 (another of Kenneth’s favorite papers): http://polarmet.osu.edu/PolarMet/PMGFulldocs/box_yang_jc_2009.pdf
Box et al., 2009: “The annual whole [Greenland] ice sheet 1919–32 warming trend is 33% greater in magnitude than the 1994–2007 warming.”
Why should we artificially add 1.6°C of warming to the Greenland ice sheet when Greenland has been cooling since 2001 or 2005…
https://notrickszone.com/wp-content/uploads/2018/02/Greenland-Cooling-2001-2015-Westergaard-Nielsen-2018.jpg
https://notrickszone.com/wp-content/uploads/2017/07/Holocene-Cooling-Greenland-Ice-Sheet-Temps-Decreasing-Since-2005-Kobashi-2017.jpg
…and there has been a pause in both Arctic temperatures….
https://notrickszone.com/wp-content/uploads/2018/04/Arctic-Temperatures-2000-2018-HadCRUT4-Climate4you.jpg
…and sea ice declines since the mid-2000s?
https://notrickszone.com/wp-content/uploads/2018/04/Arctic-Sea-Ice-Pause-2007-2017.jpg
Read chapter “Comparison between Greenland and the
Northern Hemisphere” in that paper …
I don’t get why you keep posting this graph with the claim that there was a pause, when it so clearly shows there isn’t a pause. The decline is matching the longterm trend line.
So you disagree with Swart et al., 2015, then?
https://notrickszone.com/wp-content/uploads/2018/04/Arctic-Sea-Ice-Pause-2007-2013-Swart-2015.jpg
They began their pause year in 2007. I just extended it another 4 years. After 2018, it’ll be 11 years with no net declining trend.
https://notrickszone.com/wp-content/uploads/2018/04/Arctic-Sea-Ice-Pause-2007-2017.jpg
Sorry seb, you are UNAWARE, as always
No trend in MASIE last 10 years
https://s19.postimg.cc/90mpuhc37/MASIE_Growth.png
No trend in DMI Volume last 10 years
https://s19.postimg.cc/84aexi5k3/DMI_Arctic_sea_Ice_Volume.png
Oh dear, seb actually thinks temperature of ice cores are directly comparable with other reconstructions.
So sad, so dumb, so seb. !!
Probably also thinks you can splice instrumental records on the end.
Mathematical ineptitude, writ large.
Famously the Romans were making wine in Britain during the RWP.
Today though I read this:
Worldwide Wine Output Collapses To 60-Year Low, Sparks Fears Of Major Shortage
“During the presentation, Aurand warned that global wine production collapsed in 2017, with a contraction of 8.6 percent compared with 2016 figures. In fact, global wine output dropped to its lowest levels since 1957, primarily due to poor weather conditions in the Eurozone which slashed production across the entire bloc.
For instance, French winemakers were hit with the worst frost in 25-years, during the 2017 growing season. Vinters reported “widespread damage in Bordeaux, Burgundy, and Champagne, with some losing their entire 2017 crop,” said Wine Spectator.”
***
So it looks like we may be seeing cooling setting in, and the wine industry in the more northerly parts of Europe may be heading for its own dark age.
During The 800s-1300s AD, Wine Grapes Were Grown At Latitudes Where Polar Bears Now Roam
That graph from Portugal really tells a story, doesn’t it.
Shows that in that region at least, the mid/late 1970s was the COLDEST/latest harvest since 1860 !!
Nice 1940s peak too 🙂
French grape graph also looks like it agrees, with only 1810 (or thereabouts) being a later harvest of Alsace grapes
“and the wine industry in the more northerly parts of Europe may be heading for its own dark age.”
May I suggest they buy Aussie wines instead 🙂
2017 was bad because of a late April frost in Central Europe. 2018 looks much different though. More sunshine days than last year and no frost yet. So might become a good wine year.
What a tasty wine that must have been …
They would have been cool climate wines.
Rieslings, Pinot, Sav Blanc sort of white wines, so yes, can be very tasty.
Some of the wines grown in Tassie are “ab fab” !!
You seem to be showing you UNAWARENESS of wines , now.
Your UNAWARE becoming a VERY long list !!!
Perhaps when you grow up you “might” become more aware.