Hailed as ‘the last piece of the puzzle’ in codifying our understanding of the mechanism(s) that cause climate changes, scientists are increasingly turning to Sun-modulated cosmic ray flux and cloud cover variations as the explanation for decadal- and centennial-scale global warming and cooling. In other words, climate changes are increasingly being attributed to natural variability, not anthropogenic activity.
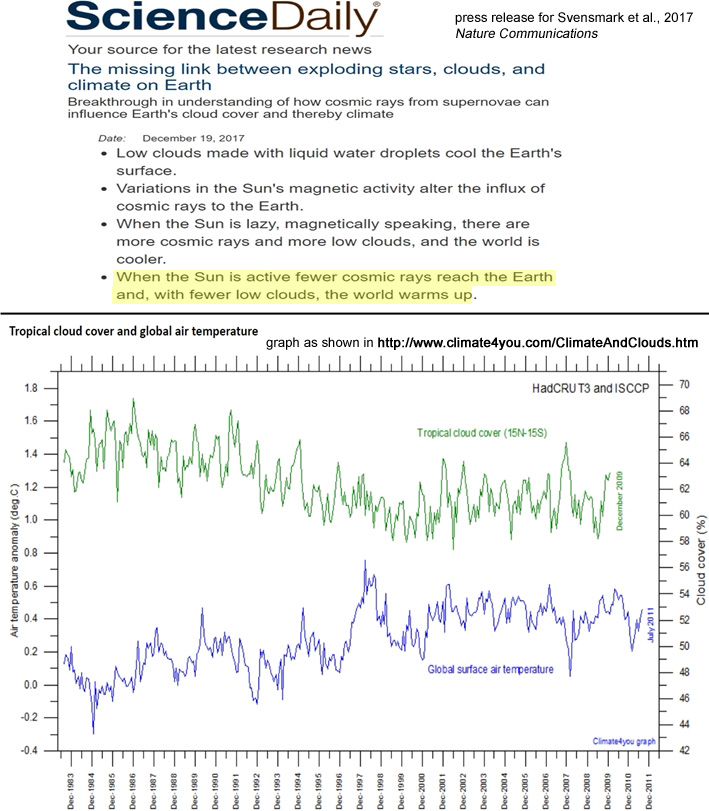
Image Source: Sciencedaily.com and Climate4you.com
Fewer sunspots leads to low solar activity and more low-level cloud cover that reflects rather than absorbs the incoming solar heat. The result is colder climates. Higher solar activity leads to fewer low clouds and warmer climates, consistent with what has occurred in recent decades. The Modern Grand Maximum of very high solar activity (1940-2015) recently ended.
Periods with few sunspots are associated with low solar activity and cold climate periods. Periods with many sunspots are associated with high solar activity and warm climate periods. … Deterministic models based on the stationary periods confirm the results through a close relation to known long solar minima since 1000 A.D. and suggest a modern maximum period from 1940 to 2015. The conclusion is that the activity level of the Modern Maximum (1940–2000) is a relatively rare event, with the previous similarly high levels of solar activity observed 4 and 8 millennia ago (Usoskin et al., 2003).
Cloud cover changes dominate in altering the amount of solar radiation absorbed by the Earth’s surface (Stanhill et al., 2014; Mateos et al., 2014).
With fewer clouds, more solar radiation can be absorbed by the oceans rather than reflected back to space; this, in turn, leads to warming.
Therefore, cloud cover changes and the concomitant alteration of surface solar heat absorption can explain the 1980s to 2000s warming via the increase in absorbed solar radiation (Pinker et al., 2005; Pallé et al., 2004; Herman et al., 2013; Wang et al., 2012; Calbó et al., 2016; Kauppinen et al, 2014; McLean, 2014).
There has recently been a scientific “breakthrough” in understanding the “missing link” between the Sun’s modulation of cosmic rays and thus cloud cover, supported by real-world observational evidence (3,100 hours of data sampling and controlled experimentation). More and more papers detailing the Sun-Climate connection are being published in scientific journals.
The following is an abbreviated list of scientific papers supporting the Sunspot Activity→Cosmic Ray Flux→Cloud Cover Changes→Climate Changes conceptualization published within the last year.
Sciencedaily press release for Svensmark et al., 2017
The missing link between exploding stars, clouds, and climate on Earth
Breakthrough in understanding of how cosmic rays from supernovae can influence Earth’s cloud cover and thereby climate
The new results reveal, both theoretically and experimentally, how interactions between ions and aerosols can accelerate the growth by adding material to the small aerosols and thereby help them survive to become cloud condensation nuclei. It gives a physical foundation to the large body of empirical evidence showing that Solar activity plays a role in variations in Earth’s climate. For example, the Medieval Warm Period around year 1000 AD and the cold period in the Little Ice Age 1300-1900 AD both fits with changes in Solar activity.
“‘Finally we have the last piece of the puzzle explaining how particles from space affect climate on Earth. It gives an understanding of how changes caused by Solar activity or by super nova activity can change climate.’ says Henrik Svensmark, from DTU Space at the Technical University of Denmark, lead author of the study.
Data was taken over a period of 2 years with total 3100 hours of data sampling. The results of the experiments agreed with the theoretical predictions.
• Low clouds made with liquid water droplets cool the Earth’s surface.
•Variations in the Sun’s magnetic activity alter the influx of cosmic rays to the Earth.
•When the Sun is lazy, magnetically speaking, there are more cosmic rays and more low clouds, and the world is cooler.
•When the Sun is active fewer cosmic rays reach the Earth and, with fewer low clouds, the world warms up.
The implications of the study suggests that the mechanism can have affected:
• The climate changes observed during the 20th century
• The coolings and warmings of around 2°C that have occurred repeatedly over the past 10,000 years, as the Sun’s activity and the cosmic ray influx have varied.
• The much larger variations of up to 10°C occuring as the Sun and Earth travel through the Galaxy visiting regions with varying numbers of exploding stars.
The spectral analysis of the sedimentological parameters reveals the significant periodicities (>95% significance) centering at ∼1067, ∼907, and ∼824 years. The long-term trends in the data suggest the possible fluctuation of Antarctic ice-sheet superimposed on global climatic fluctuations due to solar activity. … The curiosity of climate scientists arises on the mechanism of reaction of the climate system in response to the changes in solar forcing. There are two possible mechanisms proposed which work through the atmospheric processes. The first mechanism includes the action of the ozone layer by increasing more UV radiations with increased solar activity. It must have raised the temperature in the stratosphere which produces stronger winds in lower stratosphere and troposphere. These strong winds in the troposphere result in the relocation of pressure cells and storm tracks which ultimately disturbs the climate system (Schindell et al., 1999; Crosta et al., 2007). The second proposed mechanism considers the cosmic rays and cloud cover responsible for amplifying the climate forcing (Svensmark, 2000). High solar activity is believed to be responsible for less cooling of the lower atmosphere due to reduced cloud cover (Marsh and Svensmar, 2000). Conversely, low solar activity is believed to provide additional cooling of the lower atmosphere. These two feedback mechanisms responsible for the climatic forcing due to solar activity may work alone or in conjugation and are also superposed to other climate forcing as well as variability of internal cycling (Rind, 2002). Further, the periodic increase in solar activity results in increased temperature in the lower atmosphere which causes melting of ice-sheets in the Antarctic region. It may further provide the periodicity in freshwater discharge in the Schirmacher lakes and hence regulates the depositional environment of the studies lake.
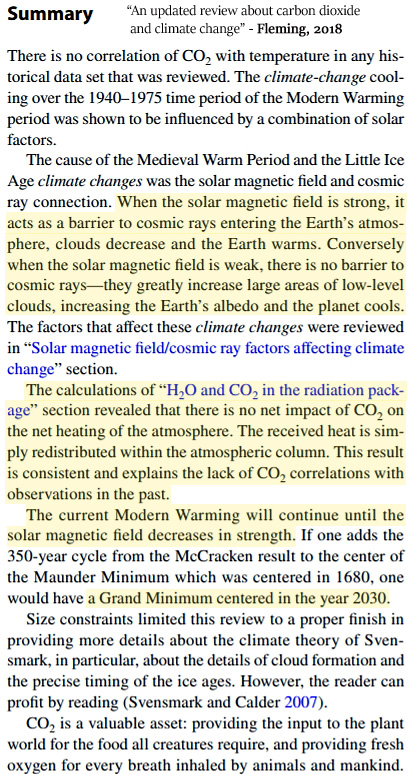
The results of this review point to the extreme value of CO2 to all life forms, but no role of CO2 in any significant change of the Earth’s climate. … There is no correlation of CO2 with temperature in any historical data set that was reviewed. The climate-change cooling over the 1940–1975 time period of the Modern Warming period was shown to be influenced by a combination of solar factors. The cause of the Medieval Warm Period and the Little Ice Age climate changes was the solar magnetic field and cosmic ray connection. When the solar magnetic field is strong, it acts as a barrier to cosmic rays entering the Earth’s atmosphere, clouds decrease and the Earth warms. Conversely when the solar magnetic field is weak, there is no barrier to cosmic rays—they greatly increase large areas of low-level clouds, increasing the Earth’s albedo and the planet cools.
Nevertheless, these results over this long period strongly suggest that the solar magnetic feld/cosmic ray interaction is the primary cause of major climate-change events over the past 9400 years of the interglacial period. The 35-year cool period within the current Modern Warming was an example where the Gleissberg cycle imposed only a modest impact on the existing strength of the magnetic feld that was in place. The current Modern Warming will continue until the strength of the Sun’s magnetic field declines.
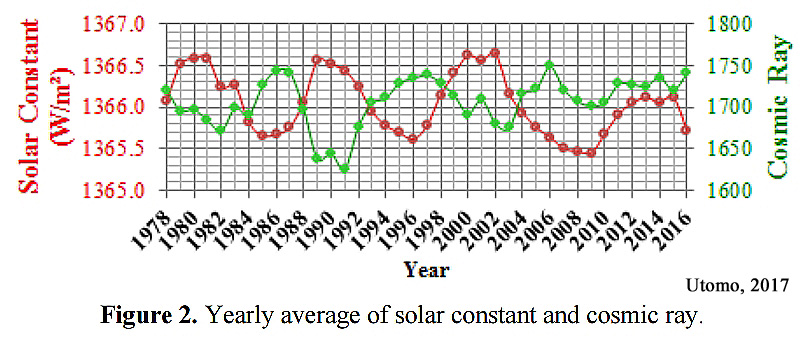
A similar result was also found for the relationship between solar activity and cosmic ray flux with a negative correlation, i.e. 0.69/year. When solar activities decrease, the clouds cover rate increase due-0.61/month and – to secondary ions produced by cosmic rays. The increase in the cloud cover rate causes the decrease in solar constant value and solar radiation on the earth’s surface. … The increase in the formation rate of cloud would affect the decrease in the intensity of solar radiation reaching the Earth’s surface. The relationship between cosmic rays and solar constant is an “opposite” relationship because of the negative correlation type (r < 0). The phenomenon of “opposite” is in a good agreement with the result by Svensmark (1997) who found a correlation between temperature and global cloud coverage with the cosmic rays… [T]he climate also depends on variations in the flux of solar energy received by the earth’s surface. Variation in the solar energy flux is caused by variations in solar activity cycle. Thus the climate is a manifestation of how solar radiation is absorbed, redistributed by the atmosphere, land and oceans, and ultimately radiated back into space. Every variation of solar energy received at the earth’s surface and reradiated by the earth into space will have a direct impact on climate change on Earth.
 Hence, the solar connection between Tm and ϕm can be summarized using a heuristic luni-solar model like that shown in Figure 6. Firstly, the model proposes that there must be some, as yet, unknown factor associated with the level of solar activity on the Sun (e.g. possibly the overall level GCR hitting the Earth) that is producing long-term systematic changes in the amount and/or type of regional cloud cover. Secondly, the model proposes that the resulting changes in regional cloud cover lead to variations in the temperature differences between the tropics and the poles which, in turn, result in changes to the peak strength of the zonal tropical winds. Thirdly, the model further proposes that it is the long-term changes in the amount and/or type of regional cloud cover, combined with the variations in the temperature differences between the tropics and the poles that lead to the long-term changes in the poleward energy and momentum flux. And finally, the model proposes that it is this flux which governs the rate at which the Earth warms and cools, and hence, determines the long-term changes in the world mean temperature.
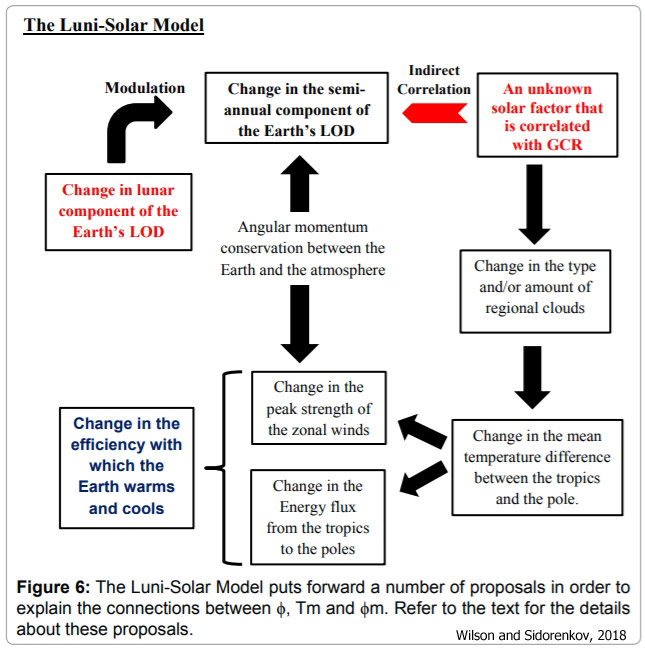


Cosmic Rays and the Impact on Climate – https://notrickszone.com/2013/11/17/cosmic-rays-and-impact-on-climate/#sthash.en1xuXVY.dpbs
Data Suggests that the Solar Wind Impacts Temperature – https://notrickszone.com/2014/05/22/data-suggest-that-solar-wind-impacts-global-temperature/#sthash.ZMnam7gT.dpbs
I couldn’t find good cloud data at the time I wrote these.
I am convinced that the Sun/Ocean set up are responsible for about 99% of warming and cooling events.
CO2 additions to the atmosphere is a negligible contributor. Part of its postulated warm forcing effect gets washed out by the COOLING effect of Water Vapor Convective power.
Then you will be in for a big surprise …
Please tell us how the Utomo 2017 figure showing cosmic ray levels can be correlated to cloud cover changes. And then explain how anyone can assume that a possible 5% influence on cloud cover change caused by GCR changes can suddenly be a “strong influence” while the CO2 effect is played down because it is only a smallish 10-20% of the whole greenhouse effect? Skeptics and their perception of reality are weird.
No, water vapor has no net cooling effect.
I am convinced that the Sun/Ocean set up are responsible for about 99% of warming and cooling events.
What will sunsettommy find himself surprised by?
Is your belief that GCRs have only a 5% influence on cloud cover changes “settled science”? If so, at what point did it reach that status?
What percent of influence do anthropogenic CO2 emissions have on cloud cover changes–since you believe humans cause cloud cover changes? Please cite the scientific evidence supporting this attribution percentage for human activity on cloud cover changes.
That it’s not the case in modern times.
It’s their result … what percentage of cloud cover changes do you think GCR influence?
CO2 has no influence on cloud cover change, temperature and aerosols have. It’s as if you are asking me what influence gasoline has on the speed of your vehicle …
“CO2 has no influence on cloud cover change”
Or any other aspect of climate.
temperature and aerosols have”
Some minor effect only, and you ZERO proof otherwise…
… but solar variability has major effects. Sorry you are INACAPABLE of comprehending the effect of cosmic rays.. but lack of comprehension is totally expected from you.
The drop in cloud cover is responsible for the slight but highly beneficial warming. Allows greater warming of the oceans, so contributes to OHC and El Nino events.
“No, water vapor has no net cooling effect.
WRONG as always, seb
DENIAL of basic measured physics was always your thing.
Just ignore the massive amounts of energy moved by evaporation.. remain UNAWARE.
Here we have MEASURED proof of the effect of the sun and cosmic ray variability on clouds.
And there YOU have ZERO proof of the effect of CO2 on anything.
Just ignore the science, seb.
Its all you can do.
Yeah, just ignore the little word “net” …
Just ignore that fact that H2O has no warming effect. Only a cooling effect.
Its net transfer of energy is that of COOLING, are you really DENYING that observable fact, seb ?? WOW. !!! Just WOW !!!
Your understanding of basic atmospheric physics has hit rock bottom !!
Remain IGNORANT and in total DENIAL of the fact that H2O is the main atmospheric coolant, seb..
It make you look extremely UNAWARE of reality.
But everyone knows REALITY means nothing to you.
Are you denying the H2O greenhouse effect?
Water vapor doesn’t make the surface cooler than it would be without its existence. Seriously, what is wrong with you?
Are you DENYING that the only reason H2O gets into a position to radiate its latent heat and slow down the lapse rate is BECAUSE it has done its cooling job.
Your grasp of atmospheric comprehension is highly tenuous, to say the least.
“Water vapor doesn’t make the surface cooler than it would be without its existence.”
WOW, are you still DENYING the cooling effect of evaporation… totally bizarre !!!
But you never have understood the effect of evaporation, have you.
You don’t think H2O has a cooling effect .. really ??????
What is WRONG with you !!!
Which FANTASY planet do you live on? !
SIGH !!!!
Again, what is wrong with you AndyG55? Are you just claiming the opposite of whatever I write? Some kind of bot AI?
Let’s test this:
I hereby claim that Earth is in an orbit around the Sun.
What a totally ANTI-SCIENCE reply.
Why do you remain totally ignorant about evaporation and latent heat.?
I’m guessing it must be by choice.
You are like a manic science-fiction novel, .
.. just make-it-up as you go along.
REALITY need never be considered in your little fantasy la-la land.. !!
What is wrong with you, seb, that you remain totally ignorant about the basics of atmospheric H2O heat and energy transfer??
It can ONLY be total and wilful avoidance of reality
“I hereby claim that Earth is in an orbit around the Sun.”
WOW, seb finally gets something correct !!
1 out of 100+ is not a good mark, though.
Poor little fella STILL doesn’t comprehend anything at all about the atmospheric and surface COOLING effect of H2O.
AndyG55, you cannot possibly believe that without water vapor the planet would be warmer than it is now, can you? Why? Because you purposely ignore the H2O greenhouse effect? It’s really weird to only look at evaporation and latent heat and the effect that clouds have and completely ignore the massive H2O GHE …
And you want to troll me with your “What a totally ANTI-SCIENCE reply.” phrase? *sigh*
seb you can’t possible believe that H2O DOES NOT have a net COOLING effect.
Do you live o a different planet, or something ???????
What GHE, are you talking about ??
The FICTICIOUS one you need to invent instead of opening your mind to the gravity-thermal gradient effect?
Or the slow down of CONVECTION by H2O specific heat ? (which still carries more energy than dry convection)
Or the emission of stored latent heat while it condenses ??
H2O is NOT a blanket, seb.
Only a gullible, weak-minded scientific ignoramous would still fall for that little fallacy.
How can you POSSIBLE DENY the massive energy transfer upwards by H2O.
Its weird that you focus on at mythical blanket effect instead of on the fact that H2O is the planets major surface coolant.
At least you have now stopped you manic ranting about your scientifically unsupportable CO2 warming nonsense.
Now you just have to learn a bit ore about how H2O functions.
You did know that atmospheric H2O has dropped over the last couple of decades, hence LESS of your mythical H2O GHE??
http://www.climate4you.com/images/TotalColumnWaterVapourDifferentAltitudesObservationsSince1983.gif
Faceplant time for seb.. yet again !!
Good to see more real scientists, coming forward to show that natural variability, driven by the Sun, is the major determinant of climate.
Unfortunately AGW, like the vampire it is, will continue to rise from the dead, whilst corrupt scientists and politicians, aided by a complaint and ignorant media, are still in place.
Sacking and prosecutions are needed.
It certainly was for a long time. But those numbers do not match up in recent times. How does the cosmic ray graph from the Utomo paper correlate to cloud cover changes?
Looks like a pretty good match here. As cloud cover decreases, temperatures rise. As cloud cover increases, temperatures fall.
https://notrickszone.com/wp-content/uploads/2018/05/Cosmic-Rays-Missing-Link-Between-Sun-and-Climate.jpg
On the other hand, there does not appear to be a long-term correlation between CO2 and ocean temperature…unless one presumes that temperatures fall as CO2 concentrations rise…
https://notrickszone.com/wp-content/uploads/2016/11/Holocene-CO2-and-Pacific-Ocean-Heat-Content-Rosenthal-2013.jpg
That graph shows the negative correlation between GCR and the solar constant. Please provide a graph that shows the correlation between CO2 emissions and decadal-scale changes in low cloud cover. Do you have one?
Yep, it does in cherry picked graphs. I found a link with a very different cherry pick: http://euanmearns.com/do-clouds-control-temperature-or-does-temperature-control-clouds/
Besides, I asked how GCR correlates with cloud cover change, not how temperature correlates!
You and your reconstructions …
I know what that graph shows. Please compare it to a cloud cover graph and tell us how GCR strongly influence cloud cover from that comparison … “waiting” (as you guys like to say).
Poor seb, you need to read deeper, and actually do some research into the links cited at the same time.
Or you could just remain in DENIAL !!
Straight from NASA
http://isccp.giss.nasa.gov/zD2CLOUDTYPES/B32glbp.anomdevs.jpg
and more…. Very close correlation between cosmic rays and low cloud cover.
http://www.sciencebits.com/sites/default/files/pictures/climate/crcFig3.jpg
If you ever wondered how good cloud data really is …
https://calderup.wordpress.com/2011/10/05/further-attempt-to-falsify-the-svensmark-hypothesis/
Drop in relative humidity, making it harder to form clouds.
Do try to keep up with the facts, seb. !!
[…] Fonte: No Tricks Zone […]
[…] Continue reading […]
So Svensmark was 21 years ahead of his time. I’m glad they’ve been able to further substantiate his theory.
Willis Eschenbach, a voice always worth listening to, seems to criticise him. I had the pleasure of having dinner with Svensmark, Lindzen and Nir Shaviv, pioneers of sober climate science that I greatly admire, and all of them hospitable gentlemen.
Eschenbach is close-minded on this topic, as he is a disciple of Leif Svalgaard. He’s made up his mind that solar activity and cosmic rays do not correlate with temperature changes, and thus he dismisses anything that doesn’t fit within his predetermined point of view.
Because it doesn’t correlate. Cosmic rays influence cloud cover to a very small degree if at all. I asked you before and I don’t know if you replied to the question, but how does the cosmic ray graph from the Utomo paper correlate to cloud cover?
So when they write…
“Data was taken over a period of 2 years with total 3100 hours of data sampling. The results of the experiments agreed with the theoretical predictions.”
…they were wrong? The data sampling does not support the theoretical predictions, allowing them to reach the conclusion that…
• Low clouds made with liquid water droplets cool the Earth’s surface.
•Variations in the Sun’s magnetic activity alter the influx of cosmic rays to the Earth.
•When the Sun is lazy, magnetically speaking, there are more cosmic rays and more low clouds, and the world is cooler.
•When the Sun is active fewer cosmic rays reach the Earth and, with fewer low clouds, the world warms up.
Since it is your belief that humans control temperatures with their CO2 emissions, and temperatures control cloud cover variations…
————————————————–
When I asked you What do you believe regulates the decadal-scale changes in cloud cover?, you wrote this:
————————————————–
Please provide a graph that shows this correlation between human CO2 emissions and cloud cover changes. Do you agree or disagree that decreases in low cloud cover cause warming, and increases in low cloud cover cause cooling? If you agree, in what what way did human CO2 emissions modulate the cloud cover in the last few decades?
Uh, that graph shows a correlation with TSI, or “the solar constant”. Perhaps you should look more closely at the graph, SebastianH. Read what the bottom says.
https://notrickszone.com/wp-content/uploads/2017/04/Solar-Constant-Cosmic-Rays-Correlation-Utomo-2017.jpg
Or just read the first 3 sentences:
“A similar result was also found for the relationship between solar activity and cosmic ray flux with a negative correlation, i.e. 0.69/year. When solar activities decrease, the clouds cover rate increase due-0.61/month and – to secondary ions produced by cosmic rays. The increase in the cloud cover rate causes the decrease in solar constant value and solar radiation on the earth’s surface.”
Kenneth, what exactly are their predictions and their results? That cosmic rays completely control cloud cover change or that they do to a certain percentage? What is that percentage, Kenneth?
Do you know that correlations are for showing a linear relationship or is that new to you? Is the CO2 to temperature relation linear, Kenneth? Is the temperature to cloud cover change and vice versa linear?
Only the simple minded search for easy linear correlations where non exist and then declare that there is no connection because they can’t find one …
I agree. CO2 emissions don’t modulate the cloud cover. How often do I need to repeat this? Temperature and aerosols! You can look up the scientific literature how temperature might influence cloud cover and the other way around:
http://euanmearns.com/do-clouds-control-temperature-or-does-temperature-control-clouds/ (warning, it’s “blog science”, same as your lists here)
Kenneth, by quoting others you are claiming that GCR are having a “strong” influence on cloud cover. The Utomo graph shows how cosmic rays go up and down. See any correlation with cloud cover and that graph?
CO2 doesn’t modulate or change anything
There is NO EVIDENCE of this fantasy.
Plenty of evidence that solar forcings affect clouds, the atmosphere and everything to do with climate.
Sorry you are INCAPABLE of following and comprehending links within the Utomo paper.
I find Willis both fascinating and frustrating. Frustrating for the reasons Kenneth has mentioned above.
I think (happy to be corrected here) its because Willis uses R2 to evaluate these cyclic models to compare with measured results and because of a low R2 determines them as invalid. The problem is r2 should not be used in non linear regression.
We know climate is a very complex beast and can be impacted by a number of things Aerosols, volcanoes both underwater and above, tilt of the earth, other cosmic events etc. however if you can get the major components sun and oceans to get very close to an approximation in a cyclic model, chances are the offset either way is a function of these other variables in unknown quantities.
understanding the impact of these other variables on the sun and the earth may improve the overlay of the cyclic models on observations. However it maybe nigh on impossible to collect all of the relevant data to align the models exactly.
We do know that they are a far better proxy for what is happening than CO2.
scott 22, Thank you for your enlightening reply. You write: “I find Willis both fascinating and frustrating.” I’ve had the same experience; I like to read the things Willis publishes, many of which are fascinating, others are simply too technical for me to appreciate them; but in a personal exchange with him I found him happy to call me a gentleman, because I had conceded an error (apologising for misrepresenting one of his propositions), but he turned out rather pig-headed and, by my standards, not exactly gentlemanly himself when I kept pointing out inadequacies in his arguments. A bit of a disappointment. So, yes, I could imagine that concerning other issues too he might close his mind at a point. By the way, this opens up a fascinating topic: the need for a measure of dogmatism in science. What I’m suggesting is that to develop a theory it may be necessary for its proponents to display a certain tenacity and put up resistance against attempts at refutation. I suppose, it is a bit like in politics, where quite obviously you will never succeed if you present yourself as being full of doubts and uncertainty with respect to your main messages (which attitude may be in order on a more analytical level). It goes without saying that dogmatism should be granted only a very limited role in science and politics; but for the reason given, a good scientist may prove to be rather an authoritarian character (at times). He may also develop a habit of impatience when he is surrounded by the ignorant most of the time or cultivates an entourage of admirers who shield him from the experience of warranted criticism. And then there is the fact that it is the same part of your brain that defends your identity irrespective of whether it is intellectually challenged or physically attacked, say by a tiger. This is why in threads like the present one a tone of consummate gentleness prevails.
Due to technical problems, I have posted this comment twice. Please remove this reply and the one addressing “scott 22” while keeping the second one addressing “Kenneth and scott 22”. Apologies for the nuisance.
Kenneth and scott 22, Thank you for your replies. Scott 22 you write: “I find Willis both fascinating and frustrating.” I’ve had the same experience, I like to read the things Willis publishes, many of which are fascinating, others are simply too technical for me to appreciate them; but in a personal exchange with him I found him happy to call me a gentleman, because I had conceded an error (apologising for misrepresenting one of his propositions), but he turned out rather pig-headed and, by my standards, not exactly gentlemanly himself when I kept pointing out inadequacies in his arguments. A bit of a disappointment. So, yes, I could imagine that concerning other issues too he might close his mind at a point. By the way, this opens up a fascinating topic: the need for a measure of dogmatism in science. What I’m suggesting is that to develop a theory it may be necessary for its proponents to display a certain tenacity and put up resistance against attempts at refutation. It goes without saying that dogmatism should be granted only a very limited role in science; but for the reason given, a good scientist may prove to be rather an authoritarian character (at times). He may also develop a habit of impatience when he is surrounded by the ignorant most of the time or cultivates an entourage of admirers who shield him from the experience of warranted criticism. And then there is the fact that it is the same part of your brain that defends your identity irrespective of whether it is intellectually challenged or physically attacked, say by a tiger. This is why in threads like the present one a tone of consummate gentleness prevails.
Scott, can you give me a word of explanation re R2? Or a link? Is it part of a reanalysis of Lorenz’ Energy Cycle?
Thanks.
I haven’t had a chance to read this all yet, but what I’ve seen of it looks pretty interesting.
https://okulaer.wordpress.com/2018/03/24/the-data-sun-not-man-is-what-caused-and-causes-global-warming/
The warming caused by the additional carbon dioxide in the atmosphere is supposed to result in an increase in water vapour. More water vapour should cause more clouds.
According to the “greenhouse gas “ hypothesis, if there is more water vapour and clouds in the atmosphere there will be more back radiation (down-welling) and therefore higher surface temperatures.
Yet the above research suggests the opposite effect, ie less clouds, higher surface temperatures.
Svensmark corrects certain falsities here from 03.2018 : https://www.youtube.com/watch?v=iFlNS2PX4yI
from 47:50 . Models v. Physics. Looks very much like even CERN used invalid models for aerosol growth, even after using the LHC beam for nucleation.
Aerosol growth from 1.5nm nucleates to >50nm aerosols is the key. The model used is shown to be shaky.
[…] Scientists Have Found The ‘Missing Link’ From Sunspot Activity To Cosmic Rays-Clouds To Climate … […]
Henric Svenmark was saying this more than a decade ago, and CERN.validated his claim about the influence of sun modulated cosmic rays.
Ross: “The warming caused by the additional carbon dioxide in the atmosphere is supposed to result in an increase in water vapour.”
Precisely. But CO2 does NOT cause increased water vapour. If you go to this link https://notrickszone.com/2018/05/17/6-new-papers-climate-models-are-literally-worth-zero-even-water-vapor-feedback-does-not-exist/#sthash.JuiuVxZ5.dpbs and scroll down to the Olilla summary you’ll find it a study demonstrating that the increased temperature since 1979 and recently increased CO2 have not been accompanied by increased water vapor.
Without that error, you can revert to the commonsense experience that when a cloud passes between you and the sun you and the earth feel cooler.
How is TSI measured? How was it known in 1700? How consistent is the data? I’m a meteorologist and don’t know much about the astronomy stuff.
Mary, I found your question interesting, so researched just a bit. You might find this interesting, from U of CO.
http://lasp.colorado.edu/home/sorce/data/tsi-data/
Regards,
Penelope
Thanks !
[…] Continue reading […]
Kenneth You might recall my 2017 paper
http://climatesense-norpag.blogspot.com/2017/02/the-coming-cooling-usefully-accurate_17.html
which also strongly supports the “Sun-modulated cosmic ray flux and cloud cover variations as the explanation for decadal- and centennial-scale global warming and cooling”
See also my more recent Blogpost http://climatesense-norpag.blogspot.com/2018/01/global-sst-data-confirms-cooling-is-on.html
Best Regards Norman Page
Yes, and I should have included it. There are many more.
Going directly against the grain here… CR theory is bunk.
TSI-insolation modulates warming and cooling, not CRs, nor CO2.
Oulu CRs are almost at the highest levels since 1964, yet today we have fewer clouds while cooling. There’s less precipitation fueling growing drought from less tropical evaporation, ie fewer clouds, not more clouds as CR theory calls for, because TSI is low.
http://cosmicrays.oulu.fi/webform/monitor.gif
https://dsx.weather.com/util/image/map/pacglobsat_1280x720.jpg
In over 20 years, Svensmark nor his followers have made a useful climate prediction using CRs, short-term or long-term. Where are the CR theory predictions? Where are his ENSO and SST predictions?
Contrast that failure with my work on TSI, where I took less than 2 years to develop a theory, construct models, make successful predictions and multiple practical real-world tests, and determine how the sun actually caused the climate to change since the little ice age.
Svensmark and supporters misunderstand reality. Clouds are driven by absorbed solar energy evaporation. It’s the atmospheric water vapor created by this evaporation that is essential for clouds.
Looking at the first figure at the top of the post by Dr. Ole Humlum, we can easily see that cloud cover was highest during the highest solar cycles of the period, and diminishing as solar activity reduced over time to the present. This observation directly contradicts the text below the figure [1],
“[1]Fewer sunspots leads to low solar activity and more low-level cloud cover that reflects rather than absorbs the incoming solar heat. The result is colder climates. Higher solar activity leads to fewer low clouds and warmer climates, consistent with what has occurred in recent decades. [2]The Modern Grand Maximum of very high solar activity (1940-2015) recently ended.”
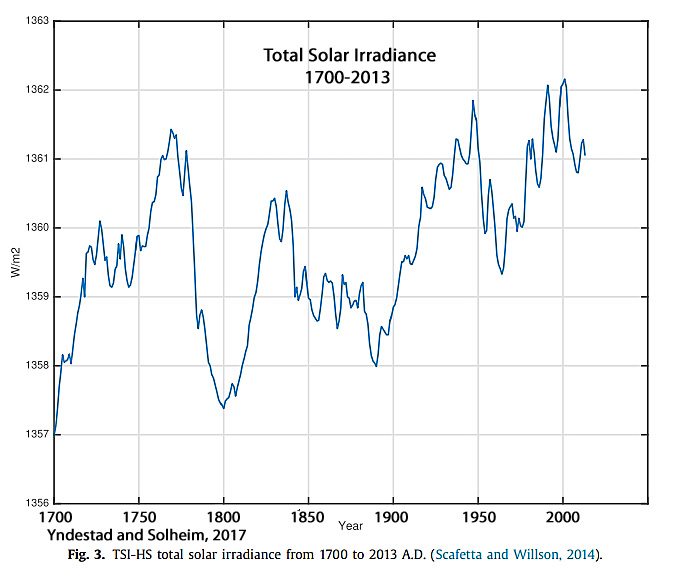
[2]The modern maximum was no less grand than the high solar activity of the 1700s. The correct modern maximum period is 1935-2004.
Yndestad and Solheim, 2017 not only miscalculated the MMax, they used a wrong TSI reconstruction.
While many abstracts and papers cited here generally support solar forcing, some papers and theories are better than others. I’m finding that all skeptics who don’t have an intimate understanding of TSI warming/cooling, which is just about everyone, can be as prone to falling for the bogus CR theory as warmists are for the equally bogus CO2 theory.
Pretty sure the ‘greenhouse theory’ has collapsed …
Greenhouse collapses under weight of snow
“Pounds of snow on top of one of their greenhouses caused it to collapse Wednesday morning.
“Sometimes things happen that are out of your control.” – said owner Mike Hamilton.
Luckily nothing was inside besides tables.”
> And CO2.
http://www.tristatehomepage.com/news/local-news/greenhouse-collapses-under-weight-of-snow/924689017