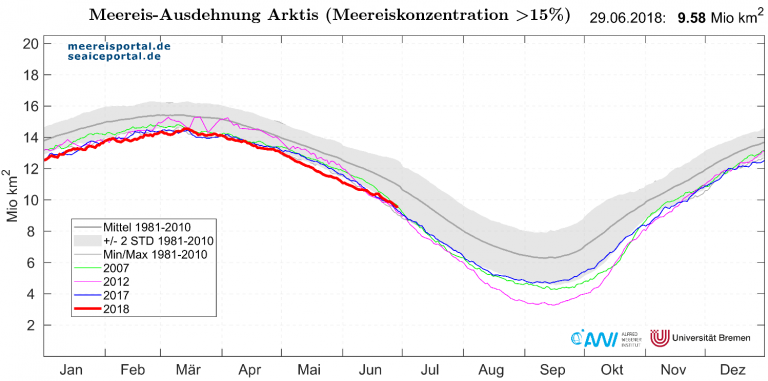
The following Arctic sea ice area chart from the Bremerhaven-based Alfred-Wegener Institute shows a current sea ice area that is about 1 million square kilometers below the mean.
Chart: Alfred Wegener Institute, University of Bremen.
But don’t let the lower than normal sea ice area fool you into thinking the ice is disappearing, and that the alarmist climate scientists are right. They aren’t.
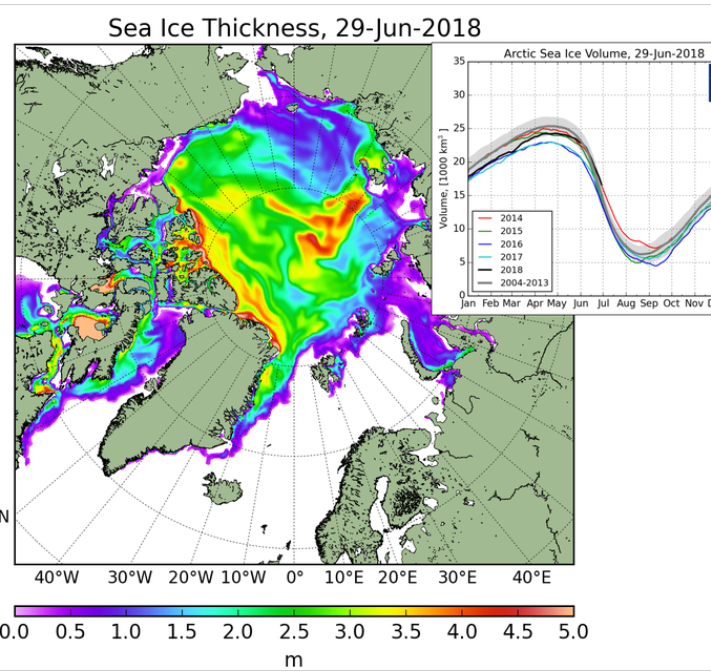
In turns out that the ice is far thicker than it’s been over the past years, and so total ice volume, which is what really counts, is rebounding impressively, according the most recent data.
Arctic ice volume 3rd highest in 16 years
Japanese skeptic blogger Kirye at posted at Twitter: “The current #Arctic sea ice volume has been the 3rd highest in 16 years since June 24, 2018, according to the DMI.”
The chart from the Danish Meteorological Institute (DMI) shows that the Arctic ice volume on June 29 was dead normal:
Source: DMI.
Moreover, Arctic sea ice thickness is well above what was observed 10 years earlier, in 2008.
June ice volume reaches highest level in 13 years
Charting the Arctic ice volume for June 26, we see that it has reached its highest level in 13 years:
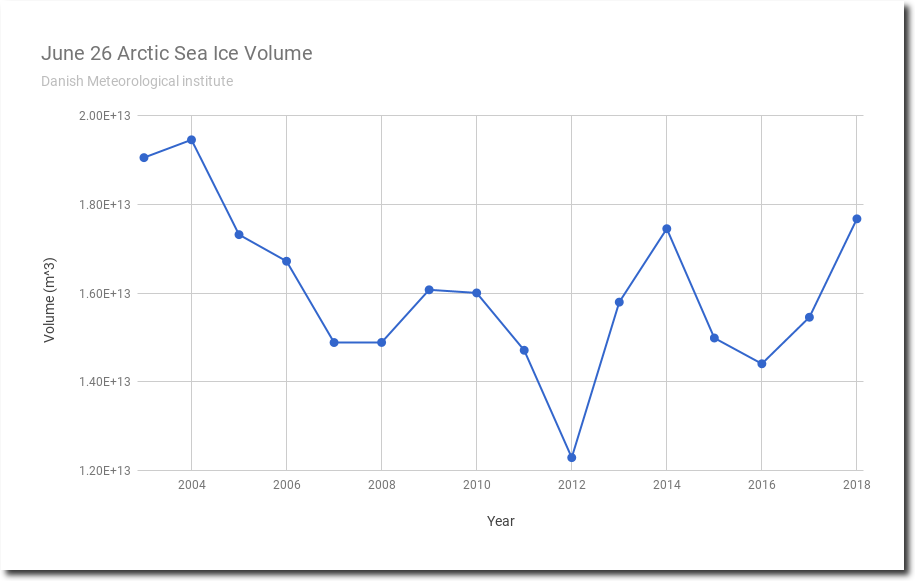
Chart taken from Real Climate Science, Tony Heller.
Clearly Arctic sea ice has stabilized over the past 10 years and it is nowhere near disappearing, as a number of hysterical scientists were predicting just 10 or 12 years ago.
So now expect global warming alarmists to ignore the Arctic and to focus on weather anecdotes to keep their climate catastrophe scam going.
Greenland ice mass balance skyrockets
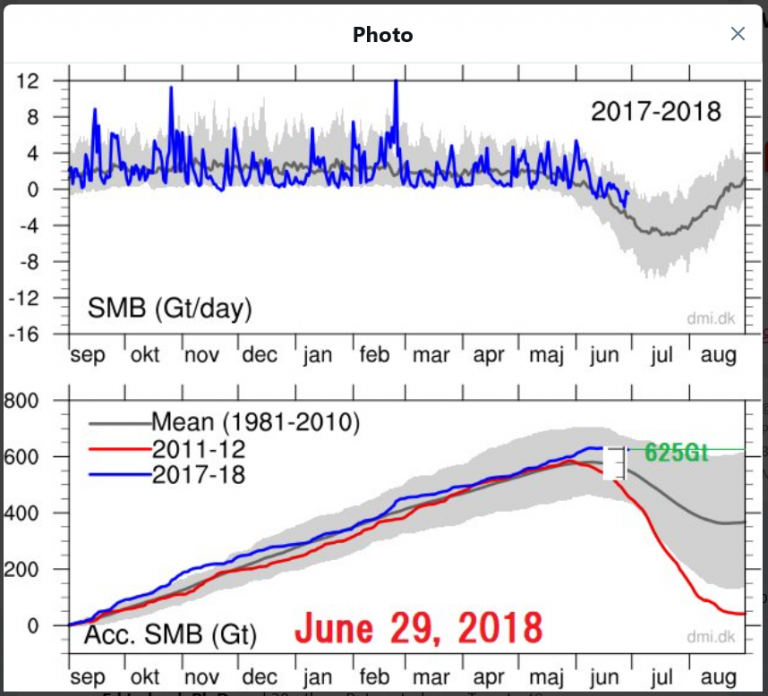
Also Greenland ice mass balance remains far above normal, some 75 billion metric tonnes above the mean.
Chart source: DMI, via Kirye at Twitter.
No climate canary in a coalmine detectable here.
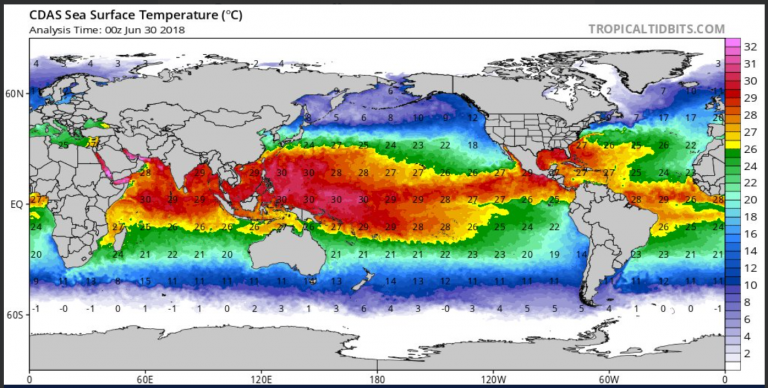
This year is also seeing the James Bay and Hudson Bay still almost completely covered with ice on June 30, as the following CDAS chart shows:
Global sea surface temperatures. Source: Tropical Tidbits.
North Atlantic sea surface temps well below normal
So what could be behind the slow ice melt in northeastern Canada, growing Arctic ice volume, and Greenland ice mass?
One major factor is likely the much colder than normal north Atlantic sea surface temperature that’s keeping the region refrigerated.
The following chart shows the anomaly from the mean:
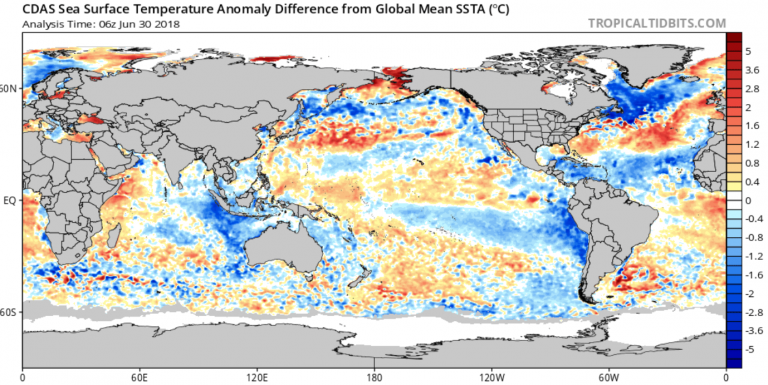 Source: Tropical Tidbits.
The North Atlantic is well below normal temperature.
Cold tropical Atlantic to suppress hurricanes?
Also the tropical Atlantic, from the west coast of Africa to the Caribbean, is colder than normal. According to hurricane expert Philip Klotzbach at Twitter, the temperature pattern over the Atlantic is opposite of what was observed during the summer of hurricane intense 2017.
Klotzbach suspects the current cold across the tropical Atlantic could act to suppress hurricane formation. That would be good news.


Is this a trend reversal?
Only God knows.
“Is this a trend reversal?”
Been basically steady for 10-12 years
I’m reckoning that in a couple of days, the DMI Arctic sea ice volume will be above the +1sd mark (2003-2017)
If the slow melt continues, there will be significant increase on “old ice” for next years count.
For the sake of the people living up there, let’s all hope it doesn’t climb all the way back up to the extreme, LIA-type levels of the late 1970s over the next couple of decades.
The AMO is turning, so increases in Arctic sea ice are to expected.
J. Hansen was wrong the Arctic is still there.
All the hysteria about the Arctic has been wrong! As we come out of the LIA the Arctic should naturally shrink, anything else is worrisome.
As this news reports says
https://thebarentsobserver.com/en/2018/06/midsummer-tankers-get-ice-trapped-near-russian-arctic-port
And that’s because Mr Hansen this is this year’s ice extent http://polarportal.dk/fileadmin/polarportal/sea/CICE_map_thick_LA_EN_20180629.png
Why would it not be there?
Ok seb, my proofreading skills are poor, for Arctic read Arctic ice.
So it should read —
J. Hansen was wrong the Arctic ice is still there.
All the hysteria about the Arctic ice has been wrong! As we come out of the LIA the Arctic should naturally shrink, anything else is worrisome.
Happy now SebastianH?
It wasn’t about your wording, tomOmason. Hansen didn’t predict that the Arctic ice would not be there today. Why do you think that he did? And even if he would have predicted something like that, why is that important to argue against? None of us sane people see failed predictions from the pseudoskeptic camp as invalidating everything skeptics say.
Why is it shrinking only recently then?
http://www.seos-project.eu/modules/timeseries/timeseries-c05-p06.html
roflmao
poor seb has just shown that Arctic sea ice is NOT related to Arctic temperature. Therefore cannot be linked to fictitious global warming.
poor seb faceplants again, but is so used to it he doesn’t even realise it.
A more accurate historical sea ice graph would be like this.
https://s19.postimg.cc/hcmhnqak3/Arctic-_Sea-_Ice-_Alekseev-2016-as-shown-in-_Connolly-2017.jpg
Note how well it follows Arctic temperatures.
https://s19.postimg.cc/vws4z68s3/arctic_temp.png
Spike55, is it you AndyG55? That would explain a lot …
What have i “shown”?
“What have i “shown”?”
Nothing EVER, at least not intentionally.
You remain EMPTY as always.
So hilarious you can’t see the problem the data you are espousing
But then…… you always were wilfully BLIND to reality
https://s19.postimg.cc/s1h6rbdo3/sne.jpg
I see, so you finally acknowledge that ice volume/mass is what counts in Greenland/Antarctica? Accepting that both are losing volume/mass now or aren’t you ready for that step yet? 😉
What a big surprise. At this date, all the graph lines are very near each other. What prompts you to make the bold claim that everything is normal now? What matter are the extreme positions …
You can not possibly state that anything has stabilized by looking at the June 29 volume.
What matters is where it ends up at the end of August and whether that number is bigger than the ice runoff. That hasn’t been the case for quite some time (on average).
So less radiation, evaporation, conduction, etc in that region. Means the heat content increases if solar input didn’t decrease in that region by the same amount. You know that, probably … right?
“if solar input didn’t decrease “
But it has,
… so your meaningless anti-science comment is even MORE than meaningless empty garbage.
I see, solar input decreased? When did it start? Why does it still keep getting warmer on global average?
There has been a net reduction in cloud cover on a net global scale since the 1980s per satellite observation, allowing more solar radiation to be absorbed by the Earth’s surface (i.e., oceans).
And all the models about the variables that make up the current climate change aren’t accounting for that, right? One more myth you uphold …
The IPCC usually considers clouds to be a positive “feedback” (i.e., more clouds mean more warming). Or they just say that the effect of clouds on climate is “largely unknown” and “not confirmed” and we don’t even know the sign (positive or negative).
—
https://www.ipcc.ch/ipccreports/tar/wg1/274.htm
The subtle balance between cloud impact on the solar short-wave (SW) and terrestrial long-wave (LW) radiation may be altered by a change in any of those parameters. In response to any climate perturbation the response of cloudiness thereby introduces feedbacks whose sign and amplitude are largely unknown. While the SAR noted some convergence in the cloud radiative feedback simulated by different models between two successive intercomparisons (Cess et al., 1990, 1995, 1996), this convergence was not confirmed by a separate consideration of the SW and LW components.
Schemes predicting cloudiness as a function of relative humidity generally show an upward displacement of the higher troposphere cloud cover in response to a greenhouse warming, resulting in a positive feedback (Manabe and Wetherald, 1987). While this effect still appears in more sophisticated models, and even cloud resolving models (Wu and Moncrieff, 1999; Tompkins and Emanuel, 2000), the introduction of cloud water content as a prognostic variable, by decoupling cloud and water vapour, has added new features (Senior and Mitchell, 1993; Lee et al., 1997). As noted in the SAR, a negative feedback corresponding to an increase in cloud cover, and hence cloud albedo, at the transition between ice and liquid clouds occurs in some models, but is crucially dependent on the definition of the phase transition within models. The sign of the cloud cover feedback is still a matter of uncertainty and generally depends on other related cloud properties (Yao and Del Genio, 1999; Meleshko et al., 2000).
Why does an average temperature rise or fall?
WHO CARES?!
https://chiefio.wordpress.com/2011/07/01/intrinsic-extrinsic-intensive-extensive/
By itself, an average temperature is a scientifically (and statistically) meaningless concept. What’s really important is knowing the heat content. But, since they can’t calculate that, as is obvious from their earth energy budget nonsense…
https://objectivistindividualist.blogspot.com/2018/06/a-summary-of-some-of-physics-errors-of.html?m=1
…they pretend that an average temperature has meaning. It does not.
It’s been a while since I’ve ranted about that, and felt the need to vent. 🙃
They do?
http://www.ipcc.ch/pdf/assessment-report/ar5/wg1/WG1AR5_Chapter07_FINAL.pdf (a more current report than the one from 2001)
I agree … the heat content of the oceans is increasing. Surface temperatures on land indicate that heat content also increases there …
Yes, SebastianH, as the IPCC link you provided states, cloud feedbacks are not “put into” models because “there is as yet no broadly accepted way to infer global cloud feedbacks from observations of long-term cloud trends or shorter-time scale variability”. Instead, it is simply assumed (via modeling) that clouds enhance warming or have little effect on climate. How convenient…and unscientific.
—
KR: The IPCC usually considers clouds to be a positive “feedback” (i.e., more clouds mean more warming).
IPCC AR5: “Based on all available evidence, it seems likely that the net cloud–climate feedback amplifies global warming [positive]. If so, the strength of this amplification remains uncertain.”
IPCC AR5: “Nevertheless, all the models used for the current assessment (and the preceding two IPCC assessments) produce net cloud feedbacks that either enhance anthropogenic greenhouse warming or have little overall effect.”
—
KR: Or they just say that the effect of clouds on climate is “largely unknown” and “not confirmed”
IPCC AR5: “There is as yet no broadly accepted way to infer global cloud feedbacks from observations of long-term cloud trends or shorter-time scale variability.”
“Feedbacks are not ‘put into’ the models, but emerge from the functioning of the clouds in the simulated atmosphere and their effects on the flows and transformations of energy in the climate system.”
“the heat content of the oceans is increasing.”
https://s19.postimg.cc/w9lqm2nc3/OHC_in_perspective_2.jpg
ZERO-evidence the increasing OHC is ANYTHING BUT NATURAL (from its lowest period in probably 10,000 years)
If you have any empirical evidence that humans are the cause of the very slight rise in OHC..
.. then PRODUCE THE EVIDENCE.
“When did it start? Why does it still keep getting warmer on global average?”
You really are playing catch-up in EVERYTHING, aren’t you, petal.
Is it getting warmer on average? Nope.
In the satellite era, the atmosphere has only warmed via El Ninos, which are a release of energy from the oceans.
Ocean energy can only come from solar radiation. Oceans are starting to cool. They are a huge sink for solar energy.
This current solar cycle was less strong than any of the previous 4-5 cycles
Why am I even trying to educate you with the very basics, when it is totally obvious that your AGW mind block makes you totally unwilling and totally incapable of learning??
„At this date, all the graph lines are very near each other.“
They only seem to be, because they are falling sharply. On the y axis the distance is as huge as before. 2018 is at the upper line of the tolerance band. This makes a huge difference to the ice extent, where 2018 is just on the lower line of the tolerance band.
That could mean that SST is still pretty warm but the hidden elephant below is cooling. If so we could see more cooling in the NH and bad times for warmunistas ahead. But I‘m pretty sure that they will blame the cooling to CO2 as well.
“Accepting that both are losing volume/mass now or aren’t you ready for that step yet?”
WRONG again
Only the Western Antarctic, which overlies active volcanic region is losing mass. East Antarctic is GAINING
NOTHING TO DO WITH ANYTHING HUMAN CAUSED
https://s19.postimg.cc/oagd79rbn/antarctic-melting-2018.gif
Greenland Ice mass is pretty close to the HIGHEST it has been in 8000+ years.
https://s19.postimg.cc/ceo16fi7n/Greenland-Ice-Sheet-Briner.jpg
Piomess is highly inaccurate over volcanic regions
Greenland has been GAINING mass the last couple of years
Temperatures are COOLING over the long term
https://s19.postimg.cc/o74crkzs3/Greenland_Kobashi_2017.png
And the short term
https://s19.postimg.cc/n13s0t8zn/Greenland-_Cooling-2001-2015-_Westergaard-_Nielsen-2018.jpg
There is NO SIGN of any human cause of the either.
You keep trying to convince yourself of this … have fun in the pseudoskeptic fantasy land.
You have yet to show ONE SINGLE PIECE of scientific evidence to the contrary, little mind.
You are reduced to mindless attention-seeking trolling with pathetically EMPTY comments.
Absolutely spot-on Spike55,
No identifiable effects from rising atmospheric CO2 level, just the same NATURAL variability there’s always been. Unless that is, any cAGW advocates who prowl these posts has compelling evidence to the contrary to offer.
But they haven’t evidence, anymore than they can show how CO2 heats the oceans, or 30,000 animal are going extinct due to the effects of cAGW (aka ‘climate change™’, or any other of their ridiculous inverted anti-skeptic theories they very occasionally offer. All they have is climate models, nothing else.
Quote:”Greenland has been GAINING mass the last couple of years”
Funny, how do you come to this conclusion.
DMI scientitst are reporting the contrary.
Just a hint: to argue here ou must be able to differentiate between Ice sheet SMB am MB.
Quote from Spike55: “Greenland has been GAINING mass the last couple of years”
How do you get the impression of Greenland ice sheet mass gain?
Funny: the experts from DMI say the contrary (except for the 2016-17 season where mass gain was apporx. 40 to 50 Gt ice).
And you are quoting Briner (2016) where I want to add this quote from him:
“Recently, [Greenland ice sheet] melt [area] has increased to 35%, a melt
percentage not routinely experienced since 8 ka”
Quote from Spike55:
“Greenland Ice mass is pretty close to the HIGHEST it has been in 8000+ years.”
The graph you are quoting contrdicts your “close to the HIGHEST it has been in 8000+ years.”
Thank you soooo much for giving us a link to support your claim. //s//
Well, I will grant you one thing, the “scientists” at DMI appear to be “experts” at something, but it seems more like obfuscation than scientific clarity.
See here…
https://notrickszone.com/2017/04/28/danish-meteorological-institute-moves-to-obscure-recent-record-greenland-ice-growth/
…and here…
https://notalotofpeopleknowthat.wordpress.com/2015/09/19/dmi-show-greenland-was-warmer-in-1930s/
Sadly there is a global phenomenon occurring, but it seems more like a lapse in scientific integrity than anything else, and that is far more dangerous than the mild fluctuations in temperature anomalies they claim to be worried about.
https://m.youtube.com/watch?v=kwIixU1JyDU
P.S. – I wonder how the DMI “experts” explain this.
https://notalotofpeopleknowthat.wordpress.com/2018/07/02/global-warming-smackdown-tankers-trapped-in-midsummer-arctic-sea-ice/
I can only imagine…
Maybe : “Global warming makes water harder.”
And there it is again … the “we are being lied to” conspiracy theory. Yonason, you do not disappoint.
@Yonason 5
You know the difference of Ice sheet SMB and Ice sheet MB?
Spike55 obviously not since he reads from here (?)
https://www.dmi.dk/en/groenland/maalinger/greenland-ice-sheet-surface-mass-budget/
and concludes that “Greenland has been GAINING mass the last couple of years”.
You will see that this statement is blatantly wrong when you go to the DMI page, read it (the pic AND the text) try to understand what it is showing. All what I state can be derived from this web-side. In case there are questions from your side.
Concerning your bashing of DMI:
You were quoting
“…and here…
https://notalotofpeopleknowthat.wordpress.com/2015/09/19/dmi-show-greenland-was-warmer-in-1930s/”
Why do you not quote DMI stating:
“In combined temperature series from southwest Greenland from the period 1784-2005, the 1930’s and 1940’s were the warmest decades”
In case you miss a link: try google
Greenland ice mass since 1900.
https://s19.postimg.cc/9i1vx9lv7/Greenland_ice_mass2.png
Scary, hey
Greenland cooling
https://s19.postimg.cc/n13s0t8zn/Greenland-Cooling-2001-2015-Westergaard-Nielsen-2018.jpg
https://s19.postimg.cc/3zakdupdv/greenland_temp.png
https://s19.postimg.cc/o74crkzs3/Greenland_Kobashi_2017.png
Terrifying….
http://nsidc.org/greenland-today/files/1999/04/GrnlndMAR_SMB_Fig6.png
We ought to, like, DO something…
Your link points to the (net) Smb Not the MB. Thanks for answering MY opening question here:
https://notrickszone.com/2018/06/30/summer-arctic-ice-remains-stubborn-as-volume-grows-and-north-atlantic-cools/comment-page-1/#comment-1267583 The DMI Page on Greenland Smb explains this well. Give IT a try: https://www.dmi.dk/en/groenland/maalinger/greenland-ice-sheet-surface-mass-budget/
No it is mit scary.
Scary is when people say something which is wrong (“Greenland is GAINING mass the läßt coupe of years”) and are unable to See the werde in error.
Even when the correct information is provided. So sad
“Means the heat content increases”
ROFLMAO
and again with that ridiculous “its colder so must be more energy” claim
Totally unbacked by anything resembling rational thought or logic and certainly not resembling any know science
Poor seb, Clutching at lead straws. !.
Totally ridiculous … you seem to have no clue how these things work, right?
Do you think it is the other way around? Warm surface means heat content increases below? Do you believe during an El Nino (warm surface temperatures) the heat content of the oceans increases? Really?
YAWN.
seb still thinks things retain more energy when they are cooling
DUMB fantasy fizzicz
lead straws, seb
Hmm, spike55 … I asked you if you think it is the other way around. You seem to believe this is the case or at least that is what I gather from your reply. So in your world a cold ocean surface means that the heat content of the water below is decreasing.
And you have the audacity to write “dumb fantasy fizzicz”? 😉 Just wow 😉
I guess the dumb really don’t know just how dumb they are. Dunning Kruger effect gets proven again.
“cold ocean surface means that the heat content of the water below is decreasing.”
Where do you think the cold is coming from, DK?
Colder means more energy. roflmao. !!
Ok seb
FANTASY FIZZUCS yet again
Baseless arrogance and massive DK effect are seb’s way of life.
Hey seb-clown..
its COLD because its ALREADY LOST ITS ENERGY.
Comprehendi !!!
Or is that too complicated for you.?
One last reply.
You do know that the large body of water we call the ocean doesn’t consist of isothermal columns of water, right? All it takes is a little overturning from cooler water from below and the surface decreases its temperature while the heat content didn’t change. With a now cooler surface less energy is lost to the atmosphere/space and with equal solar input, the heat content obviously increases.
Why is this so hard to grasp for you and why do you try so hard to “faceplant” (as you like to write) on these simple physics topics?
Do you need empirical evidence for this too? Then read up what happens during El Ninos and La Ninas to both surface temperature and heat content.
One last reply.
Yes, it seems it was too complicated for you
Cold = more energy.. yep.. we got it, seb. 😉
Just keep doubling down on your STUPIDITY.
That’s the way
btw.. there ISN’T equal solar energy, Solar energy has dropped significantly
Oh, and its great to see you realise that it is the SUN that warms the oceans, and not CO2
Yet another tiny accidental faltering step towards reality.
Over-turning down to 800m, hey seb..
http://www.climate4you.com/images/OceanTemp0-800mDepthAt59Nand30-0W.gif
CAUTION – DATA ADJUSTMENTS AHEAD
https://notalotofpeopleknowthat.wordpress.com/2014/09/01/temperature-adjustments-in-greenland/
Nothing to see here. Move along.
Cold at the other emd of the planet
Interesting report about (record?) -144°F temperatures in Antarctica:
Ultralow Surface Temperatures in East Antarctica From Satellite Thermal Infrared Mapping: The Cold https://agupubs.onlinelibrary.wiley.com/doi/full/10.1029/2018GL078133
Must be human CO2 caused that ! 🙂
Thicker ice means slower melt and more resistance of the pack to being broken up by wind and wave action. Also air temperatures in the Arctic have been running colder than the mean. Add it all up and one would suspect that the graphs will show extent and area are at or even possibly above the mean by the time minimum is reached.
Not that it means much really other than once again some alarmists, including this time James Hanson, will be proven wrong. But as a metric for “climate change” in the short term Arctic ice metrics are nearly worthless. We’re talking about a metric who’s values are determined to a great deal by wind and wave action after all.
Given that we KNOW that Arctic sea ice is driven mostly by the CYCLIC AMO,
.. it should be very obvious what is happening.
https://s19.postimg.cc/aqk086c03/DMI_trend.png
Exactly Spike55, 2020 should be interesting eh?
All of these quasi-cyclic events will horribly dent the ‘CO2 causes warming’ alarmism by then, and provide UN climate modelers with positive evidence that their ‘basic science’ of estimations and assumption (guess work) are just wrong.
Also Andy there are reports of noctilucent clouds (NLCs) rippling across Europe from Scandinavia to the south of France and across to Northern Ireland. NASA’s AIM spacecraft has observed an increase in noctilucent clouds (NLCs) above the Arctic Circle.
https://www.sott.net/article/389535-Strange-but-beautiful-skies-Noctilucent-tornado-cloud-auroras-double-and-twin-rainbow-plus-a-midnight-rainbow
Now that couldn’t possibly affect the temperatures over the Arctic or even North Atlantic SST, could they?
It should also be pointed out that NSIDC has current NH sea ice extent above 2006, 2010, 2011, 2012, 2014, 2016 and 2017 (also above the 12 year average)
While MASIE has extent above 2007, 2010, 2011, 2012, 2016, 2017 and the 12 year average
Looking at the regions in the Arctic from MASIE (from 2006), a couple are low, but, as of June 29….
Baffin Bay is above EVERY year
Hudson Bay is above EVERY year
Canadian Archipelago is above every year except 2012, 2013
Kara Sea is above every year except 2012, 2013
Beaufort Sea is above every year except 2006, 2013
There is one HECK OF A LOT of sea ice up there. !!
Reports of the death of the polar canary are premature.
http://euanmearns.com/the-arctic-sea-ice-canary-refuses-to-die/
Indeed Yonason,
Perhaps the most telling is the conclusion —
Which is a clear argument against James Hansen especially statements like this from him —
What sane person would ever believe climate is in humanity’s control? Especially the ice sheets or glaciers?
And where is the evidence for any ‘tipping point’ in climate? Historical evidence does not show any — it does show quasi-cyclic variation with occasional rapid changes, it does show reactions to random events, it does show continual change. It does not have evidence of ‘tipping points’, that phrase is just BS from an unashamed alarmist call James Hansen.
@tom0mason
Yes. Precisely!