By Kenneth Richard on 23. July 2018
Newly published science reveals scientists grossly underestimated the timescales for land uplift in compensating for Western Antarctica ice mass loss, leading them to conclude “the ice sheet may stabilize against catastrophic collapse” (Barletta et al., 2018). Furthermore, even if the most vulnerable ice shelves in the Antarctic Peninsula did collapse completely, the total ice melt contribution to sea level would be negligible – less than 1 centimeter by 2100 (Schannwell et al., 2018).
In recent decades, Antarctic climate trends have not been favoring alarmist perspectives predicated on the assumption that anthropogenic CO2 emissions are catastrophically melting glaciers and contributing heavily to sea level rise.
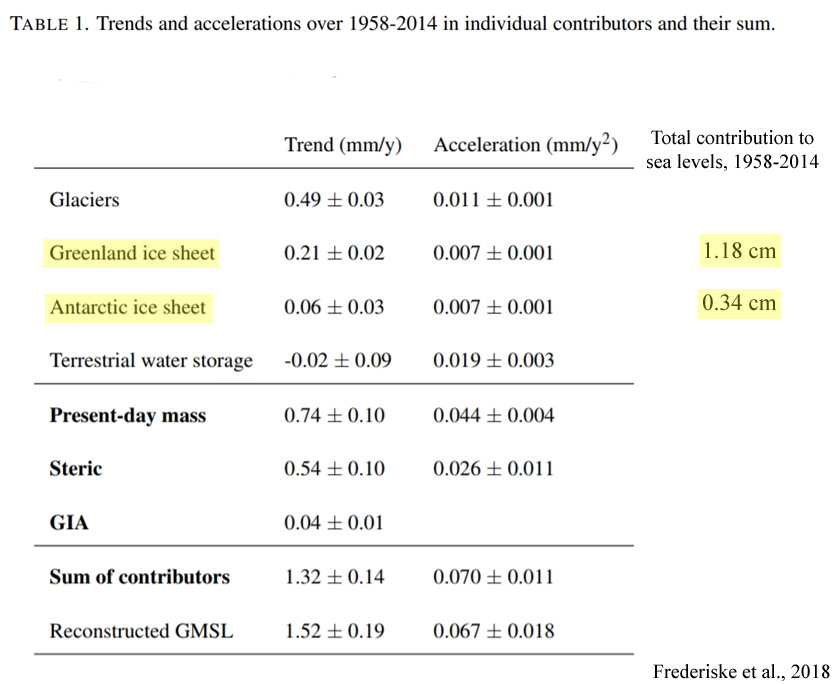
For example, the ice melt contribution to global sea levels for Antarctica as a whole was about one-third of a centimeter during the 56 years from 1958-2014 (Frederiske et al., 2018).
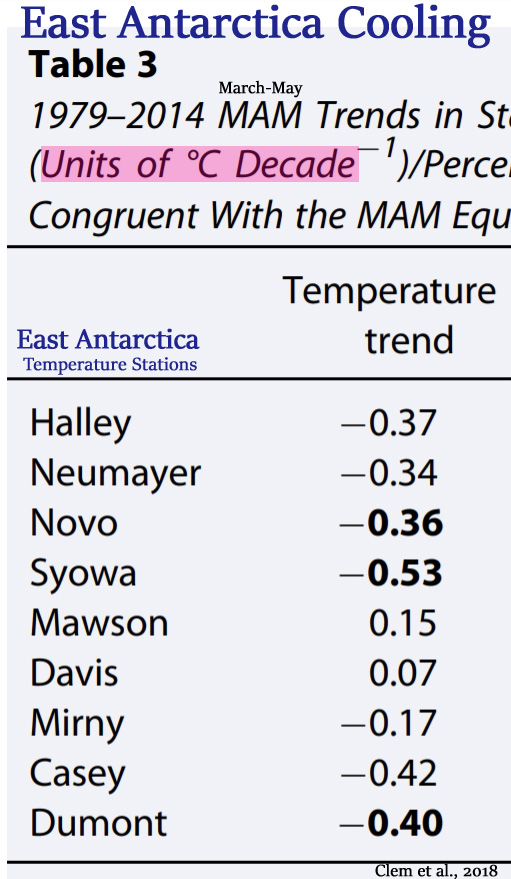
“Over the past 60 years, the climate of East Antarctica cooled while portions of West Antarctica were among the most rapidly warming regions on the planet. The East Antarctic cooling is attributed to a positive trend in the Southern Annular Mode (SAM) and a strengthening of the westerlies, while West Antarctic warming is tied to zonally asymmetric circulation changes forced by the tropics. This study finds recent (post-1979) surface cooling of East Antarctica during austral autumn to also be tied to tropical forcing, namely, an increase in La Niña events. … This enhanced cooling over western East Antarctica is tied more broadly to a zonally asymmetric temperature trend pattern across East Antarctica during autumn that is consistent with a tropically forced Rossby wave rather than a SAM pattern; the positive SAM pattern is associated with ubiquitous cooling across East Antarctica.” (Clem et al., 2018)
“We investigate the mass balance of East Antarctica for 2003–2013 using a Bayesian statistical framework. … We apportion mass trends to SMB and ice dynamics for the EAIS, based on two different assumptions, different remote sensing data and two RCMs. In the first experiment, the model apportions about a third of the mass trend to ice dynamics, +17 Gt/yr, and two thirds, +40 Gt yr−1 to SMB, resulting in a total mass trend for the EAIS [East Antarctic Ice Sheet] of +57 ± 20 Gt yr−1″ (Martín-Español et al., 2017)
The Antarctic Peninsula has been rapidly cooling since 1999 (Turner et al., 2016) at a rate of -0.47°C per decade (Oliva et al., 2017), leading to 10 times smaller ice losses in 2003-2014 than 1995-2003 (Seehaus et al., 2015).
“[A] recent analysis (Turner et al., 2016) has shown that the regionally stacked temperature record for the last three decades has shifted from a warming trend of 0.32 °C/decade during 1979–1997 to a cooling trend of − 0.47 °C/decade during 1999–2014. … This recent cooling has already impacted the cryosphere in the northern AP [Antarctic Peninsula], including slow-down of glacier recession, a shift to surface mass gains of the peripheral glacier and layer of permafrost in northern AP islands.” (Oliva et al., 2017)
“Ice mass loss (2003–2014) was approximately one order of magnitude smaller than between 1995–2003. … The northern Antarctic Peninsula is one of the fastest changing regions on Earth. The disintegration of the Larsen-A Ice Shelf in 1995 caused tributary glaciers to adjust by speeding up, surface lowering, and overall increased ice-mass discharge. … The contribution to sea level rise was estimated to be 18.8±1.8 Gt, corresponding to a 0.052±0.005 mm sea level equivalent [half a centimeter] for the period 1995–2014.” (Seehaus et al., 2015)
Two New Papers Effectively Nix Catastrophic Ice Sheet Collapse Alarmism
Barletta et al. (2018) discover that the West Antarctic bedrock’s rebound response to ice mass losses takes decades, or less than a century. It was previously thought this process would occur “on a time scale of 10,000 years”. This has led them to conclude that “the ice sheet may stabilize against catastrophic collapse”.
Observed rapid bedrock uplift in Amundsen Sea
Embayment promotes ice-sheet stability
“The marine portion of the West Antarctic Ice Sheet (WAIS) in the Amundsen Sea Embayment (ASE) accounts for one-fourth of the cryospheric contribution to global sea-level rise and is vulnerable to catastrophic collapse. The bedrock response to ice mass loss, glacial isostatic adjustment (GIA), was thought to occur on a time scale of 10,000 years. We used new GPS measurements, which show a rapid (41 millimeters per year) uplift of the ASE, to estimate the viscosity of the mantle underneath. We found a much lower viscosity (4 × 10¹⁸ pascal-second) than global average, and this shortens the GIA response time scale to decades up to a century. Our finding requires an upward revision of ice mass loss from gravity data of 10% and increases the potential stability of the WAIS against catastrophic collapse. … This means that as ice is lost, the crust rebounds much faster than previously expected. Although estimates of total ice loss have to be revised upward, the surprising finding indicates that the ice sheet may stabilize against catastrophic collapse.”
In another new paper, Schannwell et al. (2018) report that even the total collapse of gigantic Antarctic Peninsula ice shelves (Larsen C and George VI) will contribute less than 1 cm to sea levels by 2100, effectively cancelling proclamations that ice shelf collapse would have catastrophic consequences.
Dynamic response of Antarctic Peninsula Ice Sheet
to potential collapse of Larsen C and George VI ice shelves
“Ice shelf break-up and disintegration events over the past 5 decades have led to speed-up, thinning, and retreat of upstream tributary glaciers and increases to rates of global sea-level rise. The southward progression of these episodes indicates a climatic cause and in turn suggests that the larger Larsen C and George VI ice shelves may undergo a similar collapse in the future. However, the extent to which removal of the Larsen C and George VI ice shelves will affect upstream tributary glaciers and add to global sea levels is unknown. Here we apply numerical ice-sheet models of varying complexity to show that the centennial sea-level commitment of Larsen C embayment glaciers following immediate shelf collapse is low (< 2.5 mm to 2100, < 4.2 mm to 2300). Despite its large size, Larsen C does not provide strong buttressing forces to upstream basins and its collapse does not result in large additional discharge from its tributary glaciers in any of our model scenarios. In contrast, the response of inland glaciers to a collapse of the George VI Ice Shelf may add up to 8mm to global sea levels by 2100 and 22mm by 2300 [0.8 cm to 2.2 cm] due in part to the mechanism of marine ice sheet instability. Our results demonstrate the varying and relative importance to sea level of the large Antarctic Peninsula ice shelves considered to present a risk of collapse.“
Posted in Misc. |


I wonder how our resident troll will spin this?
DNFTT
😉
Who cares, he is only here as lite comedy relief.
All he has is headless-chook spin.
Probably he will say that we have all accepted these studies and Kenneth’s appraisal of them without skepticism — for he believes he ‘knows’ how we all think and reason.
Probably he will disparage the scientists mentioned in the studies, and when all else fails he will offer a rude snide remark about the people making comments here.
If we’re truly lucky he may offer one of his deranged analogies. 😉
Failing all that he will just go completely off topic and blather about the Arctic, or European weather, or windfarms, or electric vehicle, or anything off topic.
Really it will just be the usual daft, totally unconvincing remarks he always offers.
Still he does make me laugh — a lot! 🙂
Something like that. Is Kenneth cherry picking? By quoting the “Frederiske et al., 2018” paper, does he accept that sea level rise is accelerating now? Or is it just the “good parts” (for skeptics denying that anything extraordinary) is happening) that might be true?
And how does this work?
When we all know that Antarctica lost more than 2000 Gt in this timespan? Or is this just talking about the effect of a single glacier? Then why the emphasis?
Things like that don’t make you skeptical of what Kenneth writes? You just cheer in and call the opposition being trolls. Great strategy … only shows how non-skeptical you guys are. You literally believe anything if it confirms your bias. Just wow!
Yet another ZERO EVIDENCE post from the headless chook.
So funny.
Isn’t Shepherd the guy from the Ship OF FOOLS, or was that some other goose?
The CABAL of AGW high priests have spoken,..
seb MUST believe, MUST bend over and lick their boots..
GRACE over massive volcanic region.. seb doesn’t understand. incapable of basic comprehension.
Modelled garbage.
Input-output…. GIGO, you mean. !
Baseless unproven assumptions about the cause if its even real.
Certainly NOTHING to do with human caused warming, because it just IS NOT HAPPENING.
Glaciers in West Antarctic only..
funny about that..
no VOLCANIC activity there, is there , seb
Seems these guys REMAIN IGNORANT about all that VOLCANIC activity.
Just like seb likes to REMAIN IGNORANT.
Have you found ANY EVIDENCE for human CO2 causing warming anywhere yet, seb?????
Or still just the headless chook evasions.
“By quoting the “Frederiske et al., 2018” paper,”
Gees seb, great to see you accepting that the sea level rise is LESS THAN 1.6mm/year with a barely perceptible acceleration.
(even though tide gauges show deceleration)
I hope you find that 1.6mm/year really, really SCARY…
.
.
.
BOO !!!
Let’s apply basic math, spikey. Let’s see if you can follow …
From that paper:
An average increase of 1.5 mm per year over 56 years? That’s 84 mm in total, right? An acceleration of 0.07 mm / per year^2 means the latests yearly sea live rise needs to be 3.92 mm bigger than the first one. But starting at zero sea level rise in 1958 and 3.92 mm in 2014 results in the sea level rising by 107.8 mm up until 2014, so the sea level needs to start in a shrinking phase.
With a sea level decrease of about 0.5 mm in the first year and an acceleration of 0.07 mm per year^2 from 1958 to 2014 we get an average of 1.5 mm per year increase and a final rate of around 3.5 mm per year in 2014. Which is roughly what we currently observe.
Any questions?
P.S.: You can extrapolate this into the future and get a sea level rise of 250 mm until 2050 (at a then current rate of 6 mm per year). For the year 2100 it’s 635 mm and 9.5 mm per year. Which looks a lot like the IPCC predictions.
Uh, yes, there was a positive acceleration because the year chosen to begin the study was 1958, when sea levels rise rates had slowed to a crawl relative to the 1920s to 1940s. If we, on the other hand, compare the first half of the 20th century to the 2nd half, there was a deceleration in the global tide gauge data.
http://onlinelibrary.wiley.com/doi/10.1029/2006GL028492/abstract
“The rate of sea level change was found to be larger in the early part of last century (2.03 ± 0.35 mm/yr 1904–1953), in comparison with the latter part (1.45 ± 0.34 mm/yr 1954–2003).”
See: https://notrickszone.com/wp-content/uploads/2017/05/Sea-Level-Rise-Rates-1700-2003-Jevrejeva-2008.jpg
http://www.tsijournals.com/articles/discussion-of-tide-gauge-location-and-the-measurement-of-global-sea-level-rise.pdf
“The latest PSMSL Table of Relative Mean Sea Level Secular Trends update 14-Feb-2014 (www.psmsl.org) proposes the relative rates of rise computed for 2133 tide gauges of variable record length (maximum 183 [years], minimum 21 [years], average 56.5 years) with the more recent, shortest readings collected mostly in areas of subsidence and a strongly non uniform geographical coverage. The average relative rate of rise of the 2133 tide gauges is 1.04±0.45 mm/year“
http://www.sealevel.info/avgslr.html
“The rate of measured sea-level rise (SLR) varies from -17.59 mm/yr at Skagway, Alaska, to +9.39 mm/yr at Kushiro, Japan. 197 of 225 stations (87.6%) have recorded less than 3.3 mm/yr sea-level rise. At 47 of 225 stations (20.9%) sea level is falling, rather than rising. Just 28 of 225 stations (12.4%) have recorded more than 3.3 mm/yr sea-level rise. The average SLR at those 225 gauges is +0.90 mm/yr. The median is +1.41 mm/yr”
That would assume that the oscillation in sea level rise rates and magnitude only rises, rather than rises and falls like it’s been doing as it follows natural processes. Do you understand that acceleration and deceleration are relative terms, SebastianH? Relative to a starting point? Do you understand that because the long-term (i.e., 90+ years) tide gauge data show the trajectory of the accelerations and decelerations, calculating the future rates and magnitude of rise based on a very short-term record can and does yield spurious results? No, apparently this is not something you either understand or want to understand.
Sea level rise of less than 1.6mm/year
Get over it, seb.
And only a complete mathematical imbecile extrapolates noisy, somewhat cyclic data into the future.
Is that YOU, seb. !
Huh? You posted this graph of past sea level rise:
https://notrickszone.com/wp-content/uploads/2017/05/Sea-Level-Rise-Rates-1700-2003-Jevrejeva-2008.jpg
Please draw in a line where you think 1958 is located! Either this graph is wrong or you claim is wrong. Which is it?
And here I thought global sea level data back until 1958 is probably not the most perfect dataset … and then you come up with data going back a few decades further. Great! What did Frederiske not in the paper? “Since 1993, both reconstructed sea level and the sum of contributors show good agreement with altimetry estimates.”. Before that, they aren’t … guess how big the error of those reconstructions is!
Anyway, maybe this presentation lets you understand:
https://ncgeo.nl/downloads/pdf201711/Geophysical%20Thomas%20Frederikse.pdf
So you are repeating that graph that clearly not shows that “sea levels rise rates had slowed to a crawl”, this time with an incorrect 2017 value. Great 😉 Current rise rates are around 3 mm/year.
Also consult this graph … the acceleration has been going on for a long time now. Doesn’t look like you graph, does it?
https://i1.wp.com/climateadaptation.hawaii.gov/wp-content/uploads/2015/11/Brief-1-Figure-4.png
Maybe consult this presentation (slide 4) again to see just how different the reconstructions are:
https://ncgeo.nl/downloads/pdf201711/Geophysical%20Thomas%20Frederikse.pdf
1) you are replying to a comment that just demonstrated that
2) i am not sure you understand how acceleration works … you know, because an average acceleration over a long period of time (56 years) is ultimately exponential rise of the sea level … and we know how good you are with exponentials.
3) Coming back to the previous quote I copied up there (“That would assume …”), do you understand that it doesn’t matter that the rate oscillates when the average has been that it increased by 0.07 mm each year over the entire period? It is not decelerating when the acceleration becomes smaller, that is not how acceleration works.
Ehm …
Uh, yes, there was a positive acceleration because the year chosen to begin the study was 1958, when sea levels rise rates had slowed to a crawl relative to the 1920s to 1940s.
https://notrickszone.com/wp-content/uploads/2018/07/Global-Sea-Level-Rise-Rates-Since-1700-Jevrejeva-2008-Frederiske-2018.jpg
Neither the Frederiske paper nor the Jevrejeva paper are my claim. I’m just posting the findings from their papers.
Jevrejeva et al., 2008: “The fastest sea level rise, estimated from the time variable trend with decadal variability removed, during the past 300 years was observed between 1920– 1950 with maximum of 2.5 mm/yr.”
The tide gauges indicate sea levels are rising at about 1.0 to 1.8 mm/yr. The sum of contributors noted in the Frederiske paper indicate they’re rising at a 1.3 mm/yr clip, which is similar to the averages/medians for tide gauges.
https://i2.wp.com/realclimatescience.com/wp-content/uploads/2015/11/2015-11-06-20-24-12.png
“NOAA has 240 tide gauges globally, and 86% of them show less sea level rise than the claimed average of 3.2 mm/year. The average of all of the NOAA tide gauges is 1.14 mm/year, just over one third of the NOAA climate claims.”
Wunsch et al., 2007
http://journals.ametsoc.org/doi/abs/10.1175/2007JCLI1840.1
“Estimates made here produce a global mean of about 1.6 mm yr−1 [for 1993-2004]“
—
Kakroodi et al., 2015
http://www.sciencedirect.com/science/article/pii/S0025322715000031
“The average rate of sea-level change in the oceans obtained from tide gauge over the last 50 yrs is + 1.8 ± 0.3 mm yr− 1”
—
Parker and Ollier, 2017
https://link.springer.com/article/10.1007/s41748-017-0019-5
“[L]ocal sea-level forecasts should be based on proven local sea-level data. Their naïve averaging of all the tide gauges included in the PSMSL surveys showed ‘‘relative’’ trends of about + 1.04 mm/year (570 tide gauges of any length). By only considering the 100 tide gauges with more than 80 years of recording, the average trend was only + 0.25 mm/year [2.5 centimeters per century].”
—
McAneney et al., 2017
http://onlinelibrary.wiley.com/doi/10.1002/joc.4989/full
“Global averaged sea-level rise is estimated at about 1.7 ± 0.2 mm year−1 (Rhein et al. 2013), however, this global average rise ignores any local land movements. Church et al. (2006) and J. A. Church (2016; personal communication) suggest a long-term average rate of relative (ocean relative to land) sea-level rise of ∼1.3 mm year.”
—
Zerbini et al., 2017
http://www.sciencedirect.com/science/article/pii/S0012825216302689
“Our regional results, however, are in close agreement with the global mean rate, + 1.2 mm/year, published by Hay et al. (2015) which is currently being discussed by the oceanographic community”
—
Thompson et al., 2016
http://onlinelibrary.wiley.com/doi/10.1002/2016GL070552/abstract
“Ocean dynamics, land motion, and changes in Earth’s gravitational and rotational fields cause local sea level change to deviate from the rate of global mean sea level rise. Here, we use observations and simulations of spatial structure in sea level change to estimate the likelihood that these processes cause sea level trends in the longest and highest-quality tide gauge records to be systematically biased relative to the true global mean rate. The analyzed records have an average 20th century rate of approximately 1.6 mm/yr, but based on the locations of these gauges, we show the simple average underestimates the 20th century global mean rate by 0.1 ± 0.2 mm/yr. Given the distribution of potential sampling biases, we find < 1% probability that observed trends from the longest and highest-quality TG [tide gauge] records are consistent with global mean rates less than 1.4 mm/yr.”
—
Svendsen et al., 2016
http://onlinelibrary.wiley.com/doi/10.1002/2016JC011685/abstract
Stable reconstruction of Arctic sea level for the 1950–2010 period
“From our reconstruction, we found that the Arctic mean sea level trend is around 1.5 mm +/- 0.3 mm/y for the period 1950 to 2010, between 68ºN and 82ºN. This value is in good agreement with the global mean trend of 1.8 +/- 0.3 mm/y over the same period as found by Church and White (2004).”
It’s decelerating when we compare a period of faster sea level rise in the past to a period with lower sea level rise in more recent years. For example:
http://www.sciencedirect.com/science/article/pii/S0921818113002397
“It is found that the GMSL [Global Mean Sea Level] rises with the rate of 3.2 ± 0.4 mm/yr during 1993–2003 and started decelerating since 2004 to a rate of 1.8 ± 0.9 mm/yr in 2012.”
Fist graph.
Slowed since mid 1900’s, then increased, thanks for showing us a TOTALLY NATURAL LONG TERM CYCLE, seb, even back to 1700..
NO SIGN of any deviation due to CO2
Third graph, tacks corrupted satellite altimetry onto REAL tide gauges.
Only a mathematical imbecile would think that meant anything.
Slide 4.. shows how much UNCERTAINTY there is.. but still, apart from the corrupted satellite data, LESS THAN 2mm/year.. PANIC TIME !!
Note when the step was in slide 12, seb, around 1998-2000
Step change in 4 of 6 graphs.. so not CO2 or any other human cause, wouldn’t you agree, seb
Or would you just “imagine”, and make up more CRAP about human causes even though you have ZERO EVIDENCE..
You KNOW you
“Slowed to a crawl?”
So it is not your claim when you write something like “the year chosen to begin the study was 1958, when sea levels rise rates had slowed to a crawl relative to the 1920s to 1940s.” … it sure sounds like a claim. Or is this “not my claim” thing just an excuse for posting non-facts and letting them appear as facts?
https://i1.wp.com/climateadaptation.hawaii.gov/wp-content/uploads/2015/11/Brief-1-Figure-4.png
https://ncgeo.nl/downloads/pdf201711/Geophysical%20Thomas%20Frederikse.pdf
Needs repetition apparently. The rise accelerated during those times … quoting the average will not make the current rate become smaller, Kenneth.
The math is pretty simple and a continued acceleration like what we observed in the last 60 years, will lead to a sea level rise of more than 60 cm until 2100.
The entire sentence is “slowed to a crawl relative to the 1920s to 1940s“. During the 1920s to 1940s, sea level rise rates had peaked at over 3 mm/yr. By 1958, they had slowed considerably relative to the 1920s to 1940s and by the 1960s and 1970s — the earliest decades of the Frederiske “accelaration” record — they were under 1 mm/yr per (Jevrejeva et al., 2008). Yes, I view ~1 mm/yr as “slowed to a crawl”. That’s 1/100th of a meter per century. The entire 1958-2014 record was barely above that (1.4 mm/yr) because the early decades of the record (the starting point for Frederiske et al.) ranged between <1 mm/yr to about 1.2 or 1.3 mm/yr. Any time your starting point is low and your end point is high, you'll get an acceleration record.
The “not my claim” is in reference to the global sea level rise rates, which were not determined by me but by Frederiske et al. (2018) and Jevrejeva et al. (2008). Those are their records/data. My reference to the 1958-1980 starting years as having “slowed to a crawl” relative to the 1920s to 1940s — “the fastest rate of sea level rise…in the last 300 years” with decadal variability removed (Jevrejeva et al., 2008) — was my characterization of the relative difference between the 1920s to 1940s and the earliest part of the Frederiske “acceleration” record. Your attempts to twist things by removing the “relative to the 1920s to 1940s” from what I wrote and portraying data determined by Frederiske et al. and Jevrejeva et al. as my claims and my “non-facts” is another example of your disingenuous and intellectually dishonest behavior on these comment boards.
Sorry, but just because you have a graph (that curiously has no citation with it) that shows something different than what is being written in peer-reviewed scientific papers about modern sea level rise (1 mm/yr to 1.8 mm/yr) doesn’t mean I reject the latter and just go with what you have. I don’t just go with Marcott et al. (2013) and Mann et al. (1998/99) because you believe those graphical representations are the “true” record either.
Amazing the coincidence of melt and volcanoes, isn’t it, seb
https://s3.amazonaws.com/jo.nova/graph/map/antarctica/grounding_line_map-plus-volcanoes-psd-ani.gif
Or do you think volcanoes are cold ???
So do you think the volcanic activity increases recently? If not, how do the glaciers melt now and did not a long time ago?
You really should tell the scientists about this coincidence they have overlooked. Also those working on interpreting GRACE data should immediately be notified how volcanic activity changes everything. I am sure they have no idea right now … /sarcasm off
Uh, they melted (and advanced) a long time ago too. Glaciers that exist today didn’t exist a few thousand years ago. It was warmer in Antarctica during the Medieval Warm Period and throughout the last 10,000 years.
Huh? So you think scientists aren’t aware of high geothermal heat flux causes basal melting of the polar ice sheets (Greenland too)? Could it perhaps be new information for you? Wow.
Rogozhina et al., 2016
“Ice-penetrating radar and ice core drilling have shown that large parts of the north-central Greenland ice sheet are melting from below. It has been argued that basal ice melt is due to the anomalously high geothermal flux that has also influenced the development of the longest ice stream in Greenland. Here we estimate the geothermal flux beneath the Greenland ice sheet and identify a 1,200-km-long and 400-km-wide geothermal anomaly beneath the thick ice cover. We suggest that this anomaly explains the observed melting of the ice sheet’s base, which drives the vigorous subglacial hydrology and controls the position of the head of the enigmatic 750-km-long northeastern Greenland ice stream.”
—
Petrunin et al., 2013
“Here we use a coupled ice–lithosphere model driven by climate and show that the oldest and thickest part of the Greenland Ice Sheet is strongly influenced by heat flow from the deep Earth. … Complex interactions between geothermal heat flow and glaciation-induced thermal perturbations in the upper crust over glacial cycles lead to strong regional variations in basal ice conditions, with areas of rapid basal melting adjoining areas of extremely cold basal ice.”
—
Fahnestock et al., 2001
High Geothermal Heat Flow, Basal Melt, and the Origin of Rapid Ice Flow in Central Greenland … “Age-depth relations from internal layering reveal a large region of rapid basal melting in Greenland. Melt is localized at the onset of rapid ice flow in the large ice stream that drains north off the summit dome and other areas in the northeast quadrant of the ice sheet. Locally, high melt rates indicate geothermal fluxes 15 to 30 times continental background. The southern limit of melt coincides with magnetic anomalies and topography that suggest a volcanic origin.”
—
Fisher et al., 2015
“We report the first direct measurement of geothermal heat flux into the base of the West Antarctic Ice Sheet (WAIS), below Subglacial Lake Whillans, determined from the thermal gradient and the thermal conductivity of sediment under the lake. The heat flux at this site is 285 ± 80 mW/m2, significantly higher than the continental and regional averages estimated for this site using regional geophysical and glaciological models. Independent temperature measurements in the ice indicate an upward heat flux through the WAIS of 105 ± 13 mW/m2. The difference between these heat flux values could contribute to basal melting and/or be advected from Subglacial Lake Whillans by flowing water. The high geothermal heat flux may help to explain why ice streams and subglacial lakes are so abundant and dynamic in this region.”
—
Maule et al., 2005
“The geothermal heat flux is an important factor in the dynamics of ice sheets; it affects the occurrence of subglacial lakes, the onset of ice streams, and mass losses from the ice sheet base. Because direct heat flux measurements in ice-covered regions are difficult to obtain, we developed a method that uses satellite magnetic data to estimate the heat flux underneath the Antarctic ice sheet. We found that the heat flux underneath the [Antarctic] ice sheet varies from 40 to 185 megawatts per square meter and that areas of high heat flux coincide with known current volcanism and some areas known to have ice streams.”
—
Schroeder et al., 2014
“Heterogeneous geothermal flux and subglacial volcanism have the potential to modulate ice sheet behavior and stability by providing a large, variable supply of meltwater to the subglacial water system, lubricating and accelerating the overlying ice. … Thwaites Glacier is one of the largest, most rapidly changing glaciers on Earth, and its landward sloping bed reaches into the deep interior of the WAIS [West Antarctic Ice Sheet], making it a leading component in scenarios for rapid deglaciation. … [H]eterogeneous geothermal flux beneath Thwaites Glacier is likely a significant factor in local, regional, and continental-scale ice sheet stability.”
—
Corr and Vaughan, 2008
“A recent volcanic eruption beneath the West Antarctic ice sheet … “Indirect evidence suggests that volcanic activity occurring beneath the West Antarctic ice sheet influences ice flow and sheet stability. … Ongoing volcanic heat production may have implications for contemporary ice dynamics in this glacial system.”
—
Vogel and Tulaczyk, 2006
“Subglacial volcanism in West Antarctica may play a crucial role in the dynamics and stability of the West Antarctic Ice Sheet (WAIS). Evidence supporting the existence of an individual subglacial volcanic center (Mt. Casertz) in the upper catchments of Whillans and Kamb Ice Stream (WIS and KIS), comes from a comparison of ice sheet modeling results with measured ice velocities. Lubrication [melting ice] of an area, which otherwise should be frozen to its bed, is best explained by basal melt water generated in the vicinity of Mt. Casertz.”
—
Blankenship et al., 1993
“Here we present aerogeophysical evidence for active volcanism and associated elevated heat flow beneath the West Antarctic Ice Sheet near the critical region where ice streaming begins. If this heat flow is indeed controlling ice-stream formation, then penetration of ocean waters inland of the thin hot crust of the active portion of the West Antarctic rift system could lead to the disappearance of ice streams, and possibly trigger a collapse of the inland ice reservoir.”
—
Damiani et al., 2014
“One major contributor to fast glacial flow is the presence of subglacial water, the production of which is a result of both glaciological shear heating and geothermal heat flux. A zone of thinner crust is also identified near the area’s subaerial volcanoes lending support to a recent interpretation predicting that this part of Marie Byrd Land is a major volcanic dome, likely within the West Antarctic Rift System itself. [W]e prefer the hypothesis that Marie Byrd Land volcanoes are thermally-supported by warmer upper mantle. The presence of such inferred warm upper mantle also suggests regionally elevated geothermal heat flux in this sector of the West Antarctic Rift System and consequently the potential for enhanced meltwater production beneath parts of Thwaites Glacier itself.”
Ocean temperatures have increased by 0.1C since 1955
Even seb can’t be DUMB ENOUGH to think this would cause ice at -20ºC to melt
IFF these glaciers are loosing mass,
.. it is NOT because of any atmospheric warming of 0.8ºC
.. it is NOT because of any global ocean warming of 0.1ºC
.. it is NOT because of a small increase in beneficial atmospheric CO2
It is highly localised, and JUST over large pockets of volcanic activity.
And yes, there has been increased volcanic activity over the past decade or so.. Didn’t you read the post from a couple of weeks ago ???
“I am sure they have no idea right now”
I’m sure they CHOOOSE TO IGNORE the reality of the volcanic activity…
it would ruin the “fairy-tale” they feed to GULLIBLE twerps like you, seb.
So? Are you trying to do the it-was-warm-before routine again? When will you finally understand that the reasons for something happening in the past are not necessarily the same reasons it is happening today?
Really?! I even marked that passage with a clear sarcasm sign. How does your mind work? Do you start reading a sentence and when you feel the need to reply you just reply without reading it to the end?
This is crazy …
So was geothermal heat flux below the ice sheets melting the ice in the past, or is that only happening today? If not the past, what caused the glaciers and ice sheets to melt from below in previous millennia if it’s high geothermal heat flux today? Or do you deny that geothermal heat flux is melting glaciers and ice sheets today despite all the evidence demonstrating that this is the case?
So when you wrote this…
…that question was supposed to be understood as sarcasm? I understand that you were, in the next paragraph, trying to pretend that you/scientists had never heard about geothermal heat flux and ice sheets, but in the past you’ve argued that because the forcing is measured in mW m-2, that’s not enough to melt glaciers. Have you now changed your mind and agree that Greenland and Antarctica are melting due significantly to high geothermal heat flux, or do you still deny this? Or are you saying this is sarcasm?
How did the ice accumulate if the geothermal heatflux is melting it today? Was there a period of low volcanic activity?
And again he loses context … so typical. Read again, what paragraph of yours I replied to with this and what paragraph of mine you quoted back then.
Just so you know, the last sentences were on purpose. Ignored what you wrote next like you do it regularly. How does that taste?
I’ll reply with a quote from one of your quotes up in the article: “[The] West Antarctic warming is tied to zonally asymmetric circulation changes forced by the tropics.”
Do you think a change in the mW/m² range has a significant effect?
There are naturally-occurring decadal- and centennial-scale oscillations in solar activity, volcanic activity, and cloud cover that modulate regional temperatures. Antarctica was warmer during the Medieval Warm Period and the Little Ice Age than now, as shown here: https://notrickszone.com/wp-content/uploads/2018/03/Holocene-Cooling-Antarctica-PAGES-2K.jpg
I have no idea what you’re even talking about/referring to here with regard to context/sarcasm/”the last sentences were on purpose”. But it’s not worth my time to try to decipher this gem of an exchange.
I cited about 10-12 papers that indicate scientists think geothermal heat fluxes do indeed have a significant effect on ice sheet/glacier discharge. Do you think they agree with you that they don’t? Are they wrong?
In contrast, the effects of CO2 forcing for Antartica average a “rather small” 0.5 to 1 W m-2 per year according to Schmithusen et al. (2015). And the forcing values are “comparatively weak” for the Arctic:
https://notrickszone.com/wp-content/uploads/2018/04/Smithusen-2015-CO2-Forcing-Weak-At-Poles.jpg
Do you find these “rather small” forcing values to be sufficient enough to melt ice sheets from below?
@Kenneth Richard 25. July 2018 at 5:30 PM
You respond to the troll’s question about how the ice could have formed with all that volcanic activity.
Well, by analogy, how could homes have been built and lived for years in the area in Hawaii where there is now volcanic activity.
http://www.fox26houston.com/news/hawaii-volcano-destroys-dozens-of-homes-forces-evacuations
And the mindless, evidence-free BLATHER from seb, the headless chook, continues.
Plenty of evidence that the West Antarctic melt is from volcanoes and similar geothermal activity
ZERO evidence its caused by anything to do with humans.
Ocean warming of 0.1ºC does not melt ice which is well below zero, and aim at one specific locality.
Timeline:
1) You quoted me and replied with “Huh? So you think scientists aren’t aware of high geothermal heat flux […]”
2) I replied “Really?! I even marked that passage with a clear sarcasm sign.” while quoting what you wrote in 1)
3) You ask me if that means a different paragraph was supposed to be understood as sarcasm (e.g. losing context).
You are serious with this question, right?
“[The] West Antarctic warming is tied to zonally asymmetric circulation changes forced by the tropics.”
Doesn’t mean anything to you, does it? The various ways heat gets transported poleward just don’t exist in your model of the world when it comes to arguing against the greenhouse effect. No, you just repeat this “GHE is weak at the poles” stuff and hope nobody notices …
““GHE is weak at the poles” “
GHE is weak to NON-EXISTANT everywhere, seb
There is ZERO evidence of warming from the GHE.
It has NEVER been measured on this planet or anywhere else.
But you KNOW you have NO EVIDENCE,
which is why you keep up the headless chook evasions of those two questions
As explained elsewhere, yes sea level rise is accelerating when using the starting year 1958, when sea levels were barely rising. Apparently it is news to you that acceleration and deceleration rates are wholly dependent on starting and ending points.
And that led to a whopping total of how much sea level rise equivalent? A third of a cm? Is that scary to you…especially since you think we’ll get a meter of sea level rise by 2100?
Apparently, it is new to you that an average acceleration of 0.07 mm per year^2 for 56 years means that the difference between the first and the last rate is 3.92 mm/year.
Continue the 56 year acceleration into the future and see what you get. The IPCC predictions for the RCP8.5 scenario are below one meter for 2100.
And why does ice melt need to be scary? What is scary is that you guys try to twist reality so it conforms to your feelings. I still haven’t found a compelling reason why someone would do something like that to push the so called “skeptic agenda” with no hint of real skepticism or understanding of what you are arguing against.
Gotta remember.. BIG numbers SCARE seb
And little number too, apparently….
1.6mm/year SLR and the poor petal is in a total PANIC
Ocean temperature rise of 0.1ºC in 55 or so years… PANIC
Global atmospheric temperature rise of less than 0.5ºC from two El Nino.. run around like a headless chook type PANIC.
A nice warm April… MASSIVE PANIC.
Must be really difficult for the poor fella to cope in the REAL world.. if he can ever find it.
“Continue the 56 year acceleration into the future and see what you get. “
The IDIOT near linear extrapolation of a cyclic system.
You are digging DEEPER and DEEPER into the basest ranks of STUPID, seb
“What is scary is that you guys try to twist reality so it conforms to your feelings.”
REALITY is a SMALL natural melt of Antarctic ice due to volcanic action, that has a VERY small effect on sea level rise, and has been going on for AGES
Data shows a probable slight increase in recent volcanic activity.
There is ZERO evidence of any human component in this melting.
That is REALITY, do you have anything to counter that REALITY, seb ?
“And why does ice melt need to be scary?”
Tell that to your priests, who go into a complete and utter PANIC about NATURAL ice melt, trying to blame it on humans and a tiny trace gas.. DUMB.
We should have been hoping that the RECOVERY out of the coldest period in 10,000 years would continue..
.. but instead, it got turned into an anti-science, anti-CO2, anti-progress, anti-life, far-left globalist-control agenda and a propaganda FARCE.
@Kenneth
We’re not on the sealevel-Autobahn here. We’re in local traffic, where ups and downs are the norm, not the exception. The troll knows that. He’s just jerking your chain.
People don’t realise just how bitterly cold Antarctica is, and just how incredibly stable that makes the ice there. Particularly when their incomes rely on them not admitting it.
Unlike our resident troll I have done fieldwork in the Antarctic and can vouch personally for the extreme cold.
And I was there in Summer.
It is instructive when talking about the Antarctic to remember how truly vast this continent is —
here’s a graphic of Antarctica compared to the contiguous states of the USA https://www.nasa.gov/images/content/581235main_USA_Antarctica_size_946-710.jpg
P.S.
Thanks Kenneth for the heads-up on the info here, and to Pierre for keeping this blog going, showing that the mantra of the IPCC and their acolytes are neither accurate or real, and all too often are untrue.
P.P.S. Thanks for allowing this blog let me log-in so easily. 😉
When there was the usual fuss a few weeks ago about bits the size of Greater London falling off Antarctica somebody did a comparison and worked out that if Antarctica was a football pitch, Greater London would be a bit bigger than the little quarter-circle you take corner kicks from!
Ha Ha Ha 😉 You are a funny guy!
EMPTY nothingmess from seb, yet again
Still the attention-seeking headless chook comments from him.
So HILARIOUS.. but all the poor petal has to offer.
Any answer to those two simple questions yet, seb.
Here. I’ll restate them to give you yet another chance to show us what you’ve got.
.. OR NOT.
Q1. In what way has the climate changed in the last 40 years, that can be scientifically attributable to human CO2 ?
Q2. Do you have ANY EMPIRICAL EVIDENCE at all that humans have changed the global climate in ANYWAY WHATSOEVER?
I’m glad you enjoy laughing, it means you didn’t get the point…
and that IS truly funny.
🙂
Thanks SebastianH for yet another laugh (at you).
P.S. Hope you’re not still having difficulty with logging in your name and Email each time. I have no such problems! 🙂
So you didn’t get the point of my reply since you are … laughing?
It’s definitely funny how you guys try to spin everything around and imagine that the other side does something fraudulent and you are somehow the victims of their doings. And you couldn’t let my reply just sit there, no you had to turn that around too 😉
P.S.: I am having the cookie problem on every device in every browser and I doubt it is working for you if you are not logged in as a registered user, but just want to write comments. The blog is saving a cookie named “euCookie” and some Google Analytics cookies … that’s it.
“So you didn’t get the point of my reply”
You mean the POINTLESSMESS of all your replies.
That is what is so LAUGHABLE.
And then yet another whinge..
get over yourself, seb.. you are NOT important.
Hey SebastianH,
Still staying away from the topic of the post eh?
OK here’s a whole bunch of off-topic news from the past month for you to hyperventilate about.
“BP CEO Bob Dudley, was recently astonished to find that power companies still get as much of their energy from coal as they did 20 years ago.
US oil & gas show record production; Gazprom’s next giant gas field on course to start production. Coal output up in Australia, coal in the US, coal in South Africa and coal in India. Nuclear production running in India, new nuclear in China, nuclear still running in the US, even Ghana is looking at nuclear, as well as Niger and Bangladesh (thanks to the Chinese).
There’s falling global investment in renewables.
California’s emissions down but at the cost of more power intermittency and request for customers to restrict their consumption.
There’s looming EU energy efficiency fines,while the UK suffers an ongoing wind drought, and increased reliance on burning fuels.
And still volcanic activity melts the West Antarctic Ice Sheet, and researchers say Svalbard was 6°C warmer 10,000 years ago.
Or maybe you subscribe to the completely banal idea that man-made climate change contributed to trapping the boys of the Thai football team in that cave.”
That should keep you off topic for days, weeks even…
Haha ha 🙂
I am laughing because of your worldview expressed in the first comment, how is that not on topic? You made joke and now I am laughing.
The only ones hyperventilating are you guys. Whenever I post something you guys scramble to bury it with nonsense. What would you call such a behaviour?
Yes SebastianH, and I’m sure you believe it.
Here’s laughing at you 🙂
@tomO
As B&T writes, DNFTT.
Better to leave the steaming piles dumped by the troll un-burried. The more involved in them some of us get, the more undeserved credibility he’s given. He’s just here to waste our time. Why give him the satisfaction?
[…] Ref.: https://notrickszone.com/2018/07/23/antarctic-catastrophic-ice-sheet-collapse-alarmism-gets-axed-in-2… […]
“Thank you sir, may I please have another?” Seb getting spanked again. A little comedic respite.
https://www.youtube.com/watch?v=bIZoVO8ZyyQ
[…] https://notrickszone.com/2018/07/23/antarctic-catastrophic-ice-sheet-collapse-alarmism-gets-axed-in-2… […]
If dams (the one in Laos) could collapse in the same pace as ice shelfs, no one would suffer.