By Kenneth Richard on 22. November 2018
The evidence that “global” warming has not been global in scale continues to accumulate. Two more new reconstructions from the Western Pacific (He et al., 2018) and subpolar North Atlantic (Orme et al., 2018) indicate that modern temperatures have continued to decline since the onset of the Little Ice Age.
These add to the nearly 300 graphs published in the scientific literature since 2017 showing that there is nothing unusual, unprecedented, or remarkable about the temperatures changes in the last 150 years.
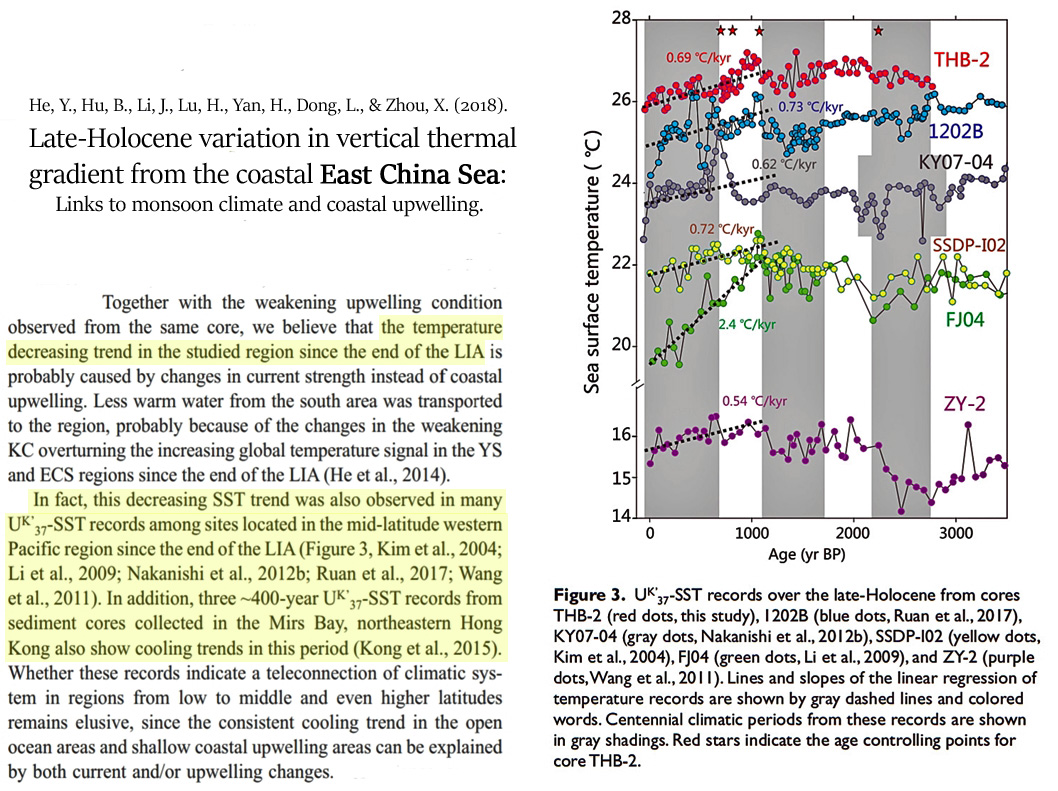
“Together with the weakening upwelling condition observed from the same core, we believe that the temperature decreasing trend in the studied region since the end of the LIA [(the recent ~100 years)] is probably caused by changes in current strength instead of coastal upwelling. Less warm water from the south area was transported to the region, probably because of the changes in the weakening KC overturning the increasing global temperature signal in the YS and ECS regions since the end of the LIA (He et al., 2014). In fact, this decreasing SST trend was also observed in many UK’37-SST records among sites located in the mid-latitude western Pacific region since the end of the LIA (Figure 3, Kim et al., 2004; Li et al., 2009; Nakanishi et al., 2012b; Ruan et al., 2017; Wang et al., 2011). In addition, three ~400-year UK’37-SST records from sediment cores collected in the Mirs Bay, northeastern Hong Kong also show cooling trends in this period (Kong et al., 2015).” (He et al., 2018)
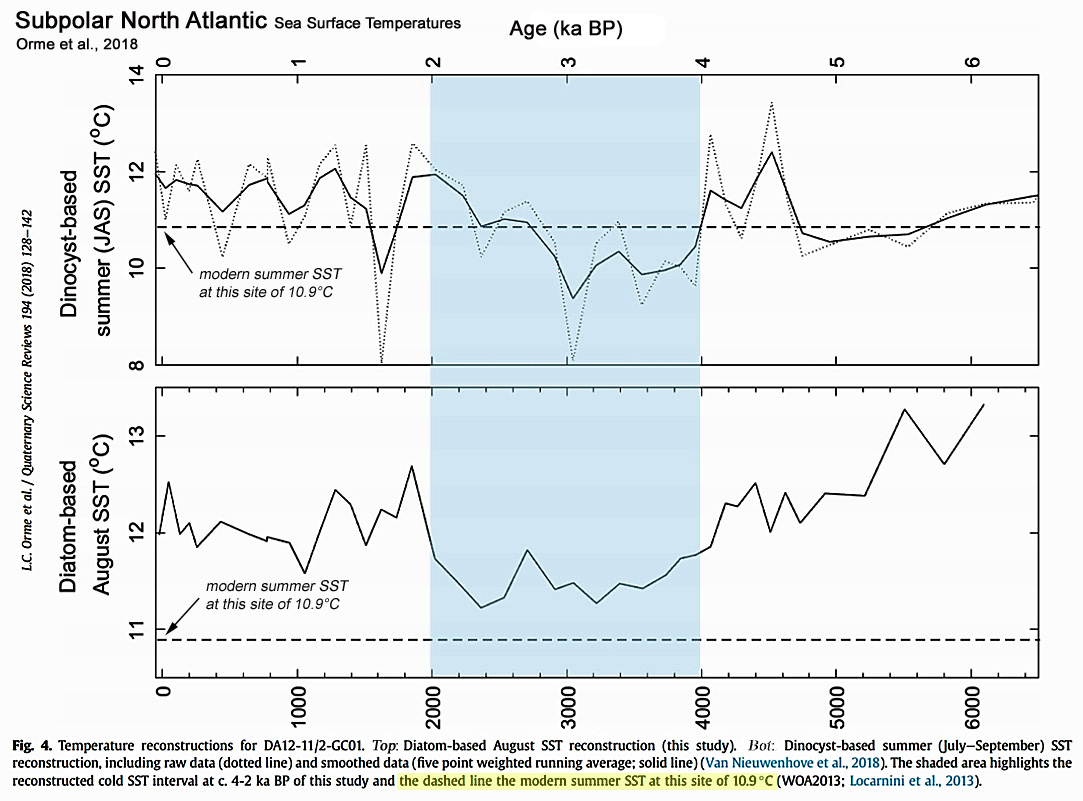
“The diatom-based reconstruction shows warmer reconstructed temperatures than the dinocyst-based reconstruction and the modern measured summer SST (June-August) of 10.9°C. … The overall long-term cooling trend in the diatom-based SST reconstruction for the last 6.1 ka fits with the widely established cooling in the subpolar North Atlantic since the Holocene Thermal Maximum, resulting from decreasing Northern Hemisphere summer insolation (e.g. Calvo et al., 2002; Marchal et al., 2002; Andersen et al., 2004a, 2004b; Andersson et al., 2010; Jiang et al., 2015; Sejrup et al., 2016). … The earliest warm period at ~6.1-4 ka BP had average reconstructed SSTs of 12-13.3°C, with the warmest temperatures in the record occurring at ~6.1-5.5 ka BP (c. 13°C). The cooler period ~4-2 ka BP had reconstructed SST that varied around 11.5°C, with minima at 3.2 and 2.4 ka BP interrupted by a short warming at 2.7 ka BP. In the most recent period after 2 ka BP the SSTs again increased peaking at 1.8 ka BP, yet SSTs did not attain values as high as those reconstructed for 6.1-4 ka BP. … In the diatom-based record the mean reconstructed temperature between 4 and 2 ka BP is 11.5°C compared with 12.5 and 12.1°C in the periods before 4 ka BP and after 2 ka BP respectively, showing a reconstructed cooling of 0.6-1°C. In the dinocyst-based record the mean reconstructed temperature between 4 and 2 ka BP is 10.3°C compared with 11.3 and 11.6°C in the periods before 4 ka BP and after 2 ka BP respectively, showing a cooling of 1-1.3°C.” (Orme et al., 2018)
Below are a few of the many other cooling-since-the-Little-Ice-Age reconstructions that have already been highlighted in 2018.
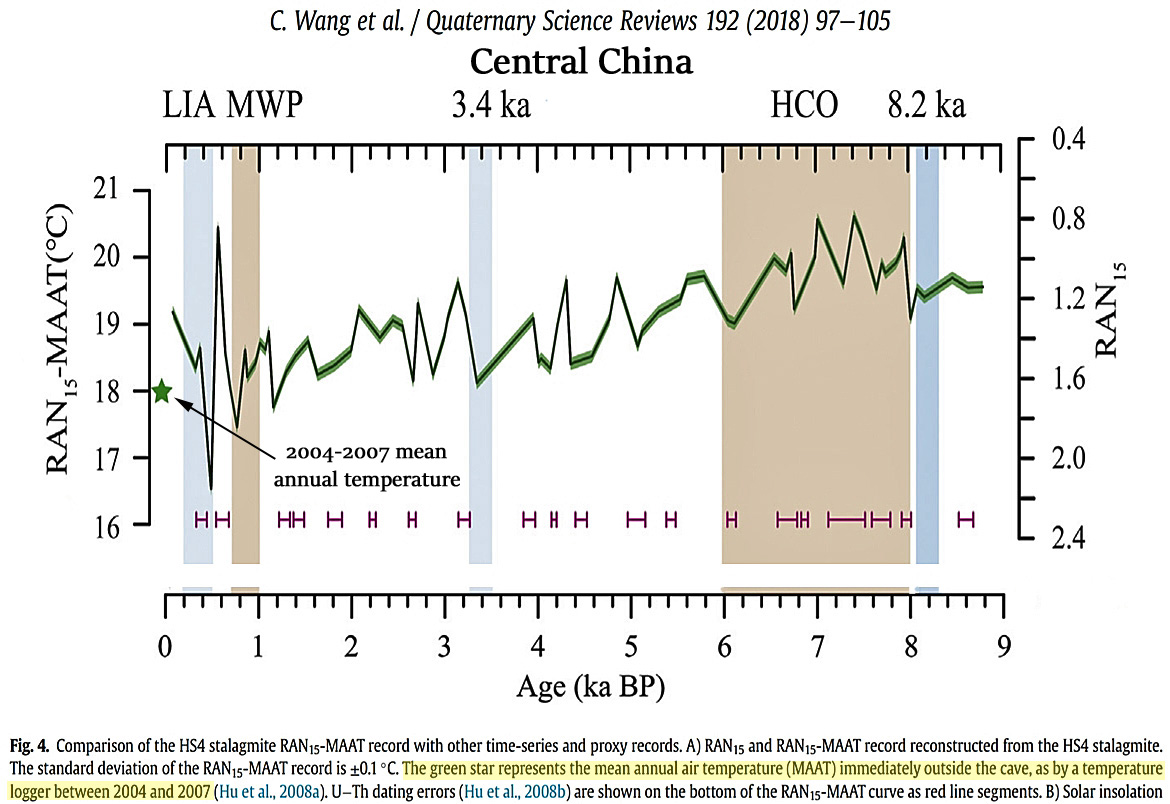
“The average RAN15-MAAT of 18.4°C over the most recent part of the record (<0.8 ka BP) [the last 800 years BP] overlaps with the range of MAATs, ca. 16.2°C to 18.7°C (av. 17.5°C) measured since 1952 at the nearest meteorological station (Yichang, located ca. 100 km away) and is very close to the av. MAAT of 18°C measured directly outside the cave by a temperature logger between 2004 and 2007 (Hu et al., 2008a). This agreement between reconstructed temperatures and instrumental measurements increases our confidence in the potential of the RAN15 proxy. RAN15-MAATs in HS4 vary from 16.5°C to 20.6°C (av. 19°C), during the last 9 ka BP, and broadly follow a long-term trend of declining temperatures in line with declining solar insolation at 30°N in July (Laskar et al., 2004). … Interestingly, the most recent 0.9 ka BP [900 years BP] is distinguished by greater variability with the highest (20.5°C) and lowest (16.5°C) RAN15-MAATs occurring consecutively at 0.6 ka BP [600 years BP] and 0.5 ka BP [500 years BP].” (Wang et al., 2018)
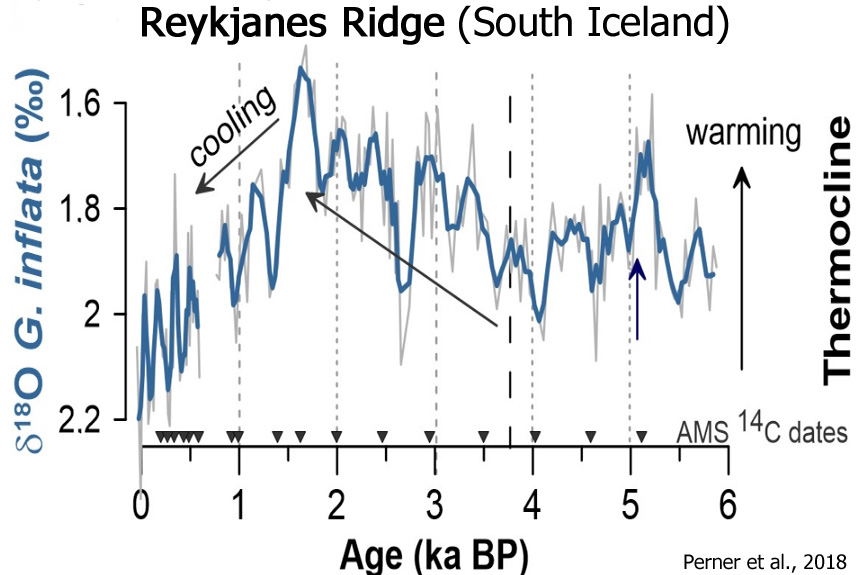
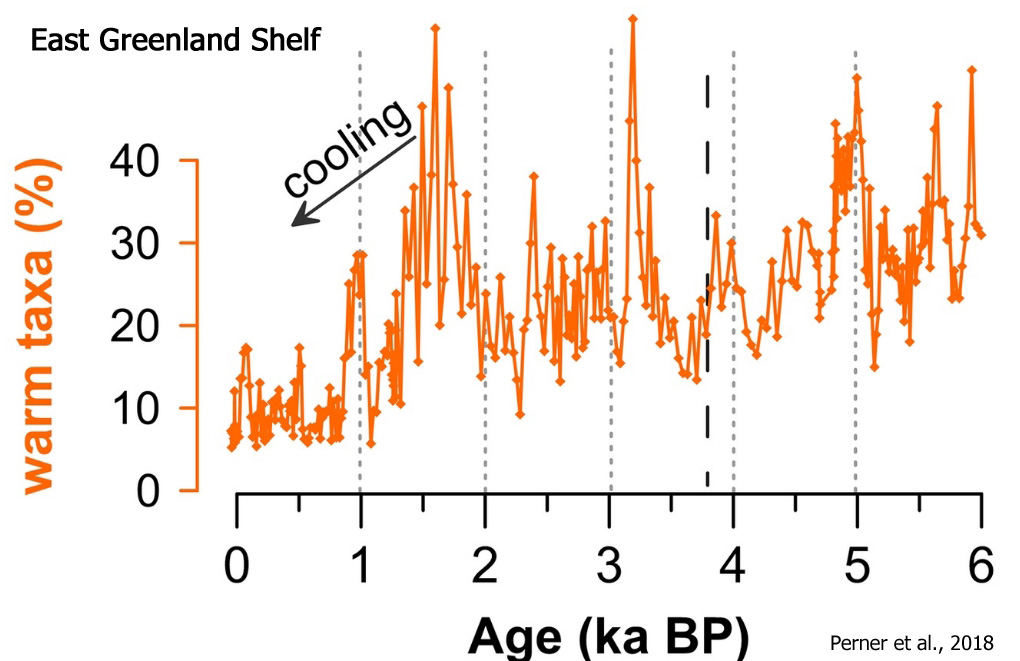
“From c. 1.5 ka BP onwards, we record a prominent subsurface cooling and continued occurrence of fresh and sea‐ice loaded surface waters at the study site.” (Perner et al., 2018)
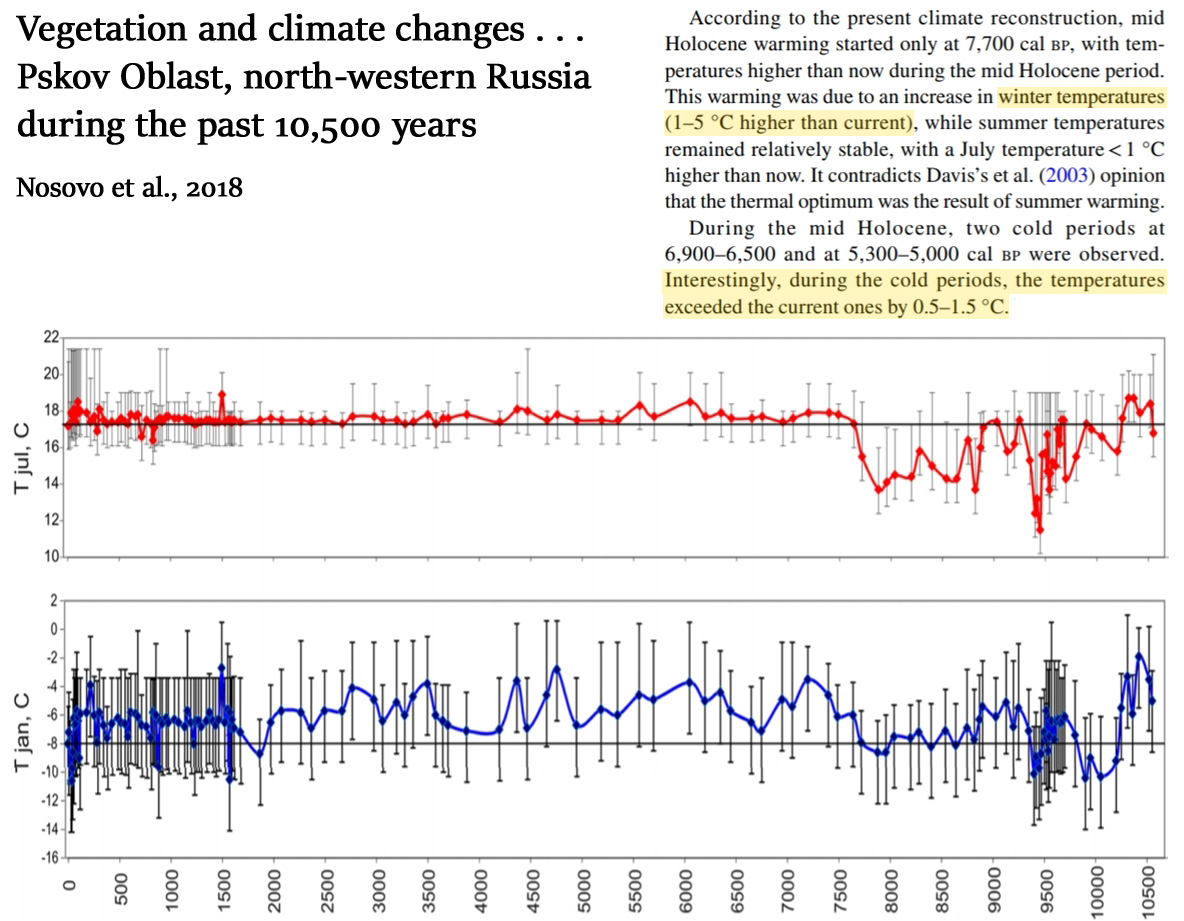
“According to the present climate reconstruction, mid Holocene warming started only at 7,700 cal bp, with temperatures higher than now during the mid Holocene period. This warming was due to an increase in winter temperatures (1–5 °С higher than current), while summer temperatures remained relatively stable, with a July temperature<1 °С higher than now. … During the mid Holocene, two cold periods at 6,900–6,500 and at 5,300–5,000 cal bp were observed. Interestingly, during the cold periods, the temperatures exceeded the current ones by 0.5–1.5 °С. … The transition from the mid Holocene thermal maximum to the following period occurred without considerable climatic changes. The mean annual temperatures remained much higher than the current ones by 0.5–2.5 °С until 2,500 cal bp. Local maximum temperatures were observed at 4,800, 4,300, 3,500 and 2,900–2,700 cal bp. The present climatic reconstruction demonstrates a gradual cooling down to current levels at ca. 2,500 cal bp, and then followed by a new warming phase with up to 1–2 °С increase at approximately 1,500 cal bp.” (Nosova et al., 2018)
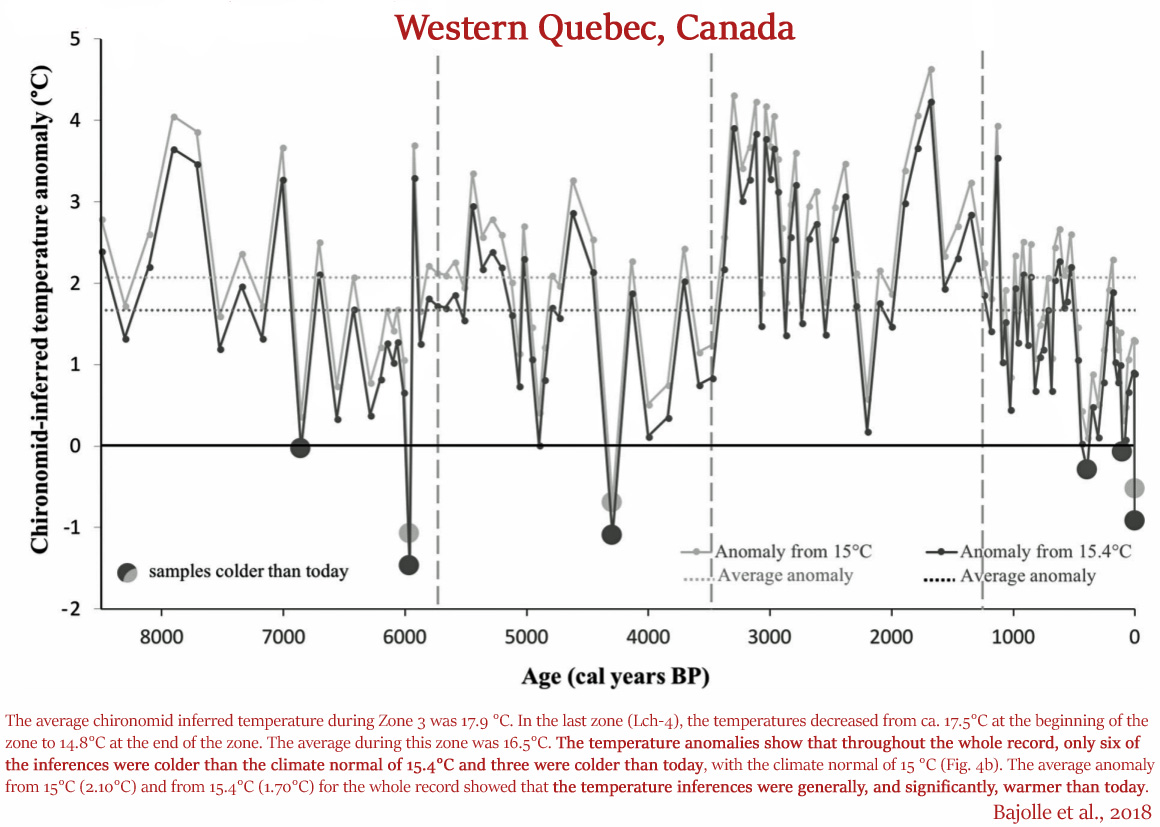
“The mean annual temperature recorded at the closest meteorological station [La Sarre: 1961–1990] is 0.8 °C, with August temperature averages of 15.0 °C (1961–1990) and 15.4 °C (1981–2010). … During zone Lch1 (8500–5800 cal year BP), the average reconstructed temperature was 16.9 °C, with a decrease from 19 °C (maximum) to 17 °C at the end of the zone. In zone Lch-2 (ca. 5700–3500 cal year BP), temperatures had an average of 16.8 °C, with a decrease from 17.8 °C around 5200 cal year BP to 16.2 °C at 3400 cal year BP. Zone Lch-3 (ca. 3500–1200 cal year BP) started with inferences for high temperatures (19.3–18.5 °C), followed by a decrease to 16.8 °C between ca. 3000 and 2500 cal year BP. An increase (18.3 and 19.6 °C) was inferred for the period between 1800 and 1500 cal year BP. The average chironomid inferred temperature during Zone 3 was 17.9 °C. In the last zone (Lch-4), the temperatures decreased from ca. 17.5 °C at the beginning of the zone to 14.8 °C at the end of the zone. The average during this zone was 16.5 °C. The temperature anomalies show that throughout the whole record, only six of the inferences were colder than the climate normal of 15.4 °C and three were colder than today, with the climate normal of 15 °C (Fig. 4b). The average anomaly from 15 °C (2.10 °C) and from 15.4 °C (1.70 °C) for the whole record showed that the temperature inferences were generally, and significantly, warmer than today.” (Bajolle et al., 2018)
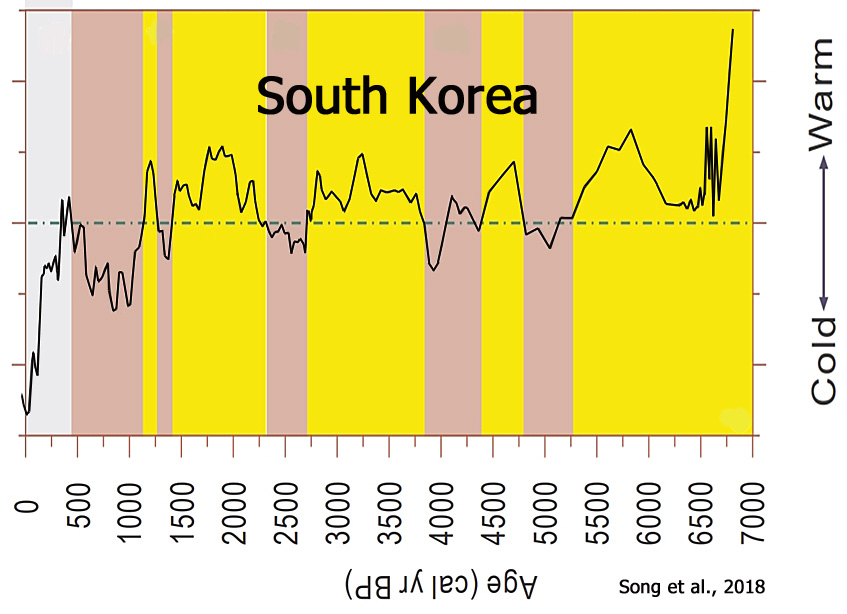
“[A] general warm to cold climate trend from the mid-Holocene to the present, which can be divided into two different stages: a warmer stage between 6842 and 1297 cal yr BP and a colder stage from 1297 cal yr BP to the present.” (Song et al., 2018)
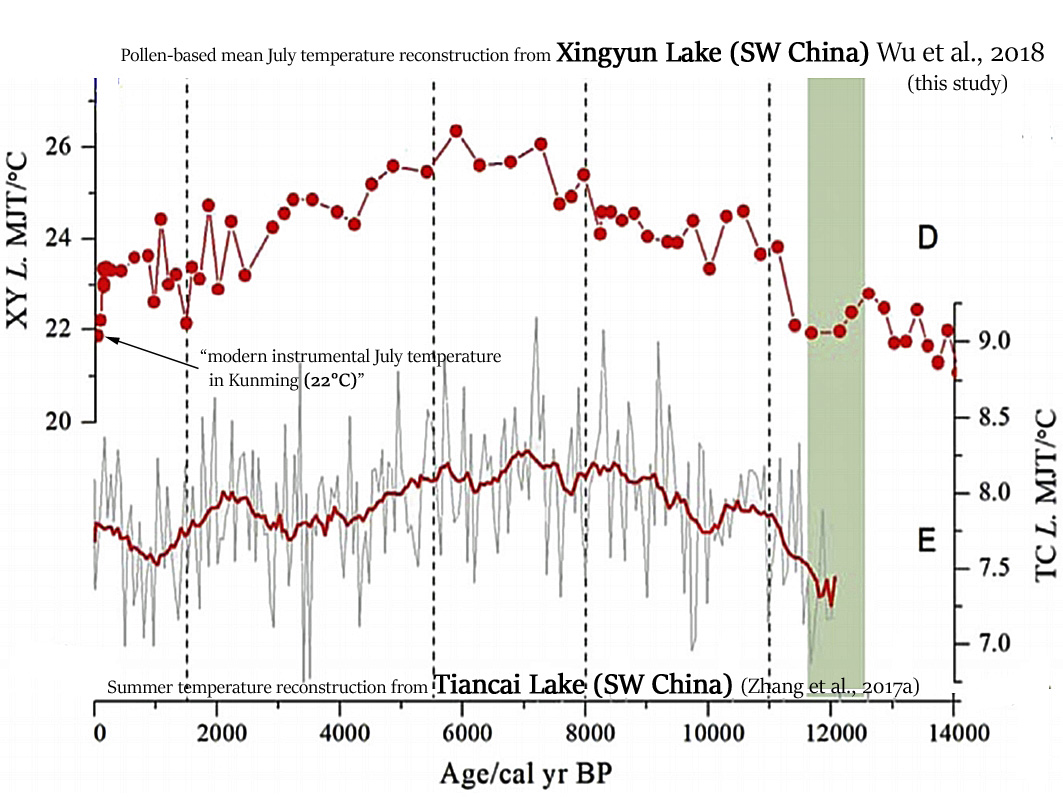
“Summer temperatures (MJT) at Xingyun Lake in the late glacial were low, increased during the early Holocene, were highest during the middle Holocene, and then decreased during the late Holocene. The range of inferred values [for the Holocene] was 21.0°- 26.5°C. The pollen inferred temperature derived from surface samples (21.2°C), is close to the modern instrumental July temperature in Kunming (22°C), supporting the reliability of reconstructions from down-core pollen assemblages.” (Wu et al., 2018)
Posted in Cooling/Temperature, Paleo-climatology |


Perhaps we should remind ourselves that we are not talking about records of thermometer readings, but proxy based reconstructions. Personally, I have about as much faith in such climate reconstructions as I do in climate models – that is to say very little!
There are good reasons for this. Was there or was there not a mediaeval warm period? The reconstructions of Loehle or Moberg would indicate that there was. On the other hand, the reconstructions of Thompson or Mann would suggest that there wasn’t. Perhaps the best known example of the failure of proxies is provided by the so-called “divergence problem”. This relates to the fact that most tree ring proxies simply fail to pick up the modern, post ~ 1960, warming. This is what underlay Jones’ infamous “hide the decline”.
Of course, none of this tells us very much about the reconstructions in this thread apart from the injunction to “Be careful!” The reconstructions themselves may be either spot on or else wildly inaccurate. We shall probably never know.
In the meantime we should note that the AGW religion does not require us to believe that everywhere in the world has warmed. Indeed, given the complexities of climate, it seems highly probable that a few places would actually have cooled. Maybe the reconstructions here are an example of this. Maybe they aren’t.
Recently, when checking out a completely unrelated idea, I had occasion to examine the UNadjusted GHCN database for Iceland. This contains six stations with complete annual records for 1910 as well as at least one complete annual record for temperatures post 1990. Four of these show a warming and two of them show a cooling! Maybe the data is unreliable or maybe we really can have isolated cooling in an otherwise warming world.
I have seen the unadjusted Iceland temperatures and unadjusted Greenland temperatures. If I recall correctly they are on the NOAA website.
They show that apart from 1 year (I seem to recall 2010), unadjusted themperatures in Iceland and Greenland are not as warm today as they were in circa 1940.
Unadjusted Iceland and greenland temperatures show cooling as from the highs of circa 1940, although they may show some warming if one extends the period back to the early 1900s.
The position as from 1940 is important since about 95% of all manmade CO2 emissions has taken place post 1940 such that if there is no significant warming since 1940 it would suggest that CO2 is not a significant driver of upward temperatures.
It is certainly true that Greenland and Iceland are not the best advertisements for the AGW theory. Like most of the rest of the world, they show a pronounced cooling from 1940-1969. But, unlike most other places, this cooling is barely compensated for in the subsequent 30 year period. In fact, over the whole 60 years, Iceland shows a net cooling whereas Greenland shows a minuscule net warming.
However, given the proportion of the earth’s surface that they cover, it is perhaps going a bit too far to treat this as a refutation of AGW.
http://polarmet.osu.edu/PolarMet/PMGFulldocs/box_yang_jc_2009.pdf
“The annual whole ice sheet 1919–32 warming trend is 33% greater in magnitude than the 1994–2007 warming.”
Uncorrupted (urbanization, ocean air effects) instrumental data show that…
The United States
China
Central South America
Pakistan/India
W. Africa
S. Africa
SE Australia
…have experienced the same not-quite-as-warm-as-the-1930s/1940s pattern too.
What if the proxy is, for example, tree lines? We can determine with a great deal of precision what minimum temperatures will support the growth of certain trees. So if we have tree stumps in the sub-Arctic that can be carbon-dated to the Medieval Warm Period, but today the tree line is hundreds of kilometers south…or if we have tree stumps on mountain sides that are 100s of meters atop the end of the tree lines of today, and we have a lapse-rate temperature for the heights that can support tree growth…
Kullman, 2018
https://www.researchgate.net/publication/324991910_Further_Details_on_Holocene_Treeline_GlacierIce_Patch_and_Climate_History_in_Swedish_Lapland
“All recovered tree specimens originate from exceptionally high elevations, about 600-700 m atop of modern treeline positions.”
“Conservatively drawing on the latter figure and a summer temperature lapse rate of 0.6 °C per 100 m elevation (Laaksonen 1976), could a priori mean that, summer temperatures were at least 4.2 °C warmer than present around 9500 year before present. However, glacio-isostatic land uplift by at least 100 m since that time (Möller 1987; Påsse & Anderson 2005) implies that this figure has to be reduced to 3.6 °C higher than present-day levels, i.e. first decades of the 21st century.”
Looks to me like you are assuming that the post-1960s warming curve was “reality”, and therefore the fact that the tree ring evidence does not support Mann’s nearly vertical hockey stick curve must be suspect — or a “failure”. I don’t think your assumption that the post-1960s proxy evidence is inconsistent with thermometer evidence is necessarily valid — especially if we look at thermometer records that are not corrupted by artificial urban heat or ocean air effects.
We have, for example, evidence from 450 (un-corrupted) thermometer stations from across the world that show a temperature trajectory for the 20th/21st centuries that look quite similar to the proxy evidence:
It’s Here: A 1900-2010 Instrumental Global Temperature Record That Closely Aligns With Paleo-Proxy Data
If you choose not to read the link above, compare the un-corrupted instrumental record here to the tree-ring proxy record here. Notice how the divergence “failure” (as you called it) disappears.
You’re probably going to need to define your terms here. When you talk about a “warming world”, what’s the starting point? If we’re talking since the early 20th century, then yes, both the proxy and instrumental data show an overall warming. If we’re talking about the 1920s-1940s as a starting point, then no, the un-corrupted and proxy records do not appear to show a net warming — just a recovery from the 1950s-1970s cooling period that led to widespread concerns about the “coming ice age”.
Looks like the inverse of climate crook Mann’s hockey stick.
I always knew that averages were dodgy things. You throw away a lot of information.
[…] https://notrickszone.com/2018/11/22/2-more-new-sea-surface-reconstructions-indicate-rapid-cooling-in-… […]