Newly published macrofossil discoveries from 4 papers strongly suggest that modern warmth may still be about 3°C colder than nearly all of the last 10,000 years.
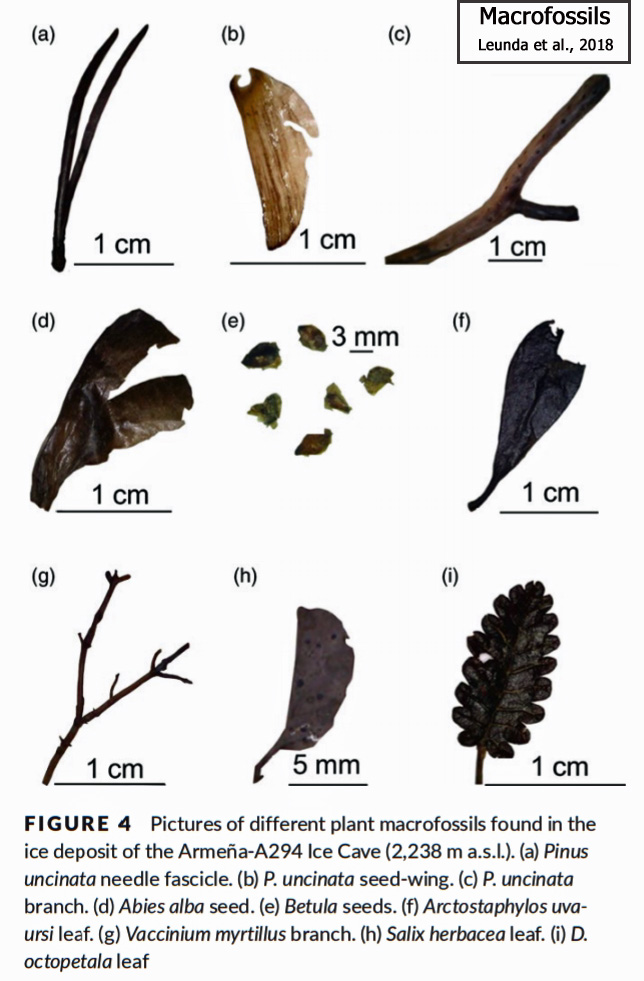
Image Source: Leunda et al. (2018)
1. Permafrost is still present today in a region that was permafrost-free throughout the Holocene (until the onset of the Little Ice Age)
According to data from a new study (Sannel et al., 2018), subarctic Northern Sweden has yet to rise out of the range of frigid, permafrost-friendly temperatures coeval with of the Little Ice Age (roughly 1400 to 1900 AD).
Permafrost still exists today in regions where there was no recorded permafrost during nearly all of the Holocene, when temperatures were too warm (3°C higher than today) for permafrost to form.
“Throughout most of the Holocene, these northern peatlands have not experienced climatic conditions cold enough for permafrost to form.”
These findings strongly suggest that modern warmth is nothing unusual, unprecedented, or even remarkable. In fact, it may be said that today’s subarctic warmth may only be slightly warmer than the coldest centennial-scale period — the Little Ice Age — of the last 10,000 years.
Sannel et al., 2018
“At all these sites the datings together with the results of the plant macrofossil analyses suggest that permafrost aggradation took place around 600–100 cal. a BP [the Little Ice Age]. … [A]t these sites there are no indications of permafrost inception prior to the Little Ice Age. … Warmer conditions during recent decades have resulted in extensive permafrost degradation in Fennoscandian palsas and peat plateaus (Sollid& Sørbel 1998; Zuidhoff& Kolstrup 2000; Luoto & Seppala 2003; Sannel & Kuhry 2011; Borge et al. 2017).”
“At present the permafrost is close to thawing with mean annual ground temperatures just below 0°C (Christiansen et al. 2010; Johansson et al. 2011; Sannel et al. 2016).”
“Throughout most of the Holocene, these northern peatlands have not experienced climatic conditions cold enough for permafrost to form.”
“During peatland initiation (c. 10 000–9600 cal. a BP) the climatic conditions in the region were favourable for plant productivity with around 3 °C warmer summer temperatures compared to today (Kullman & Oberg 2015), resulting in relatively rapid peat and net carbon accumulation rates during the early Holocene.”
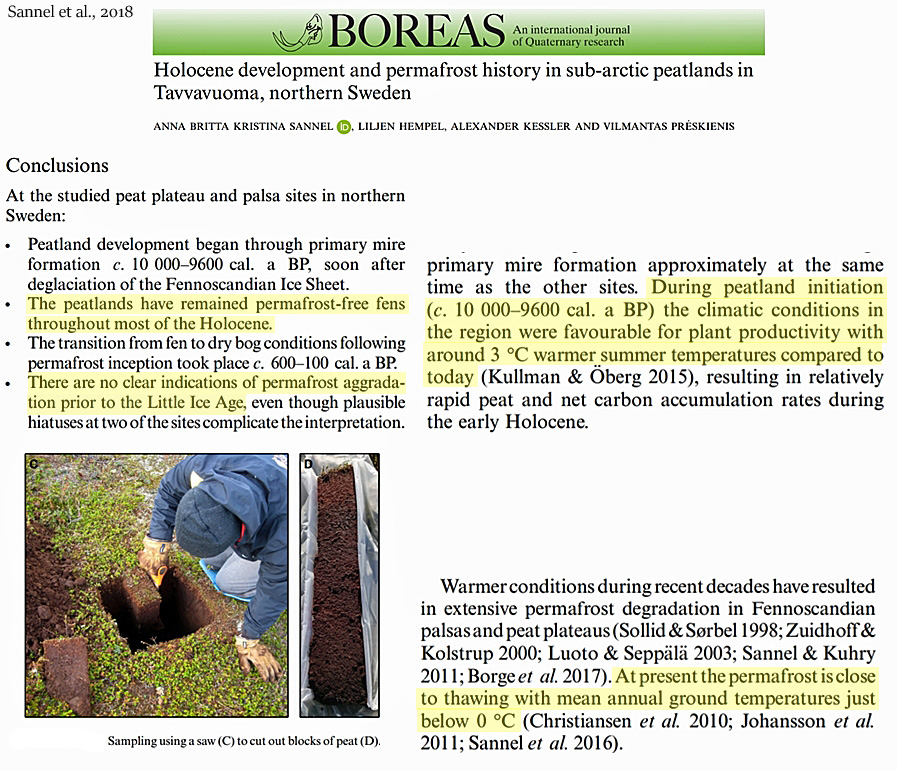
Image Source: Sannel et al., 2018
2. Italian Alps tree lines ~460 meters higher than present indicate surface temperatures were 3.1°C warmer during the Mid-Holocene
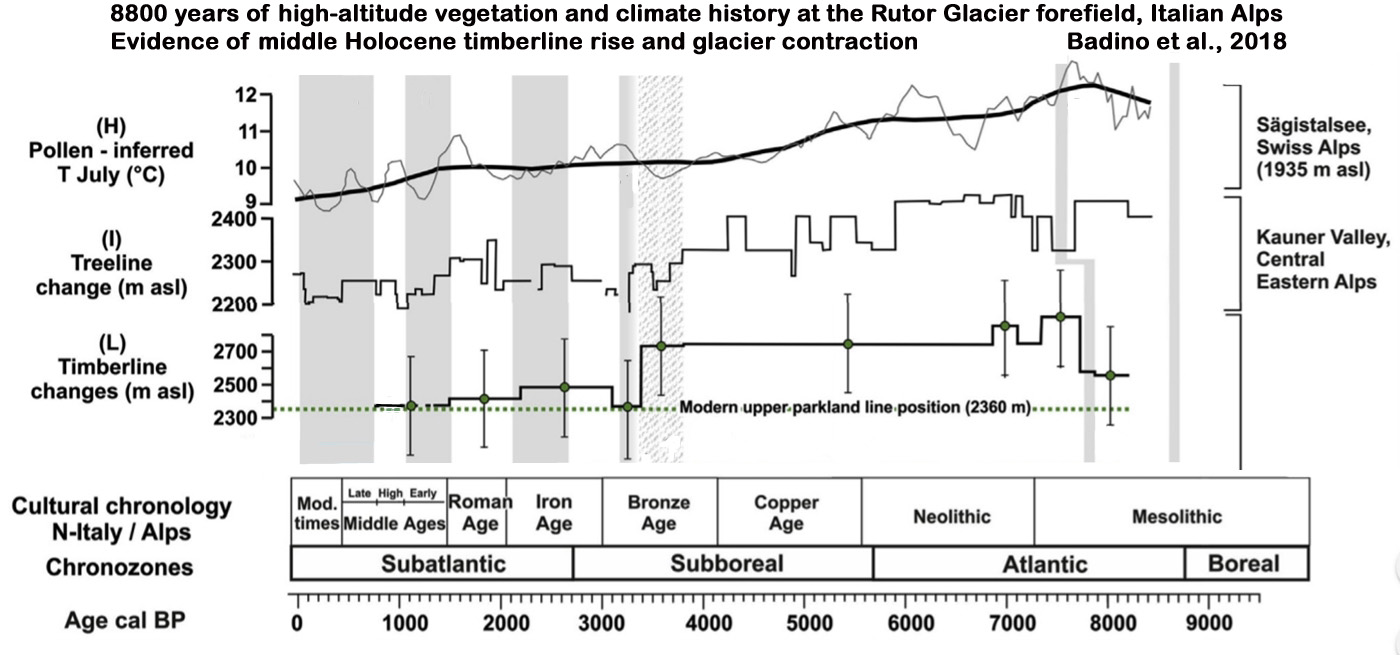
The modern forest line position in an Italian Alps study area (Badino et al., 2018) is 2,360 meters above sea level (m asl).
Per the data indicated in the graph below, the forest line position averaged between 2,750 to 2,900 m asl during 7400 to 3600 cal yrs BP — about 460 m higher than today’s forest line.
With a temperature lapse rate of 0.67°C/100 m for the region documented in the paper, this indicates temperatures were about 3.1°C warmer than today [4.6 X 0.67°C] during the Mid-Holocene.
Badino et al., 2018
“Between 7400 and 3600 yrs cal BP, an higher-than-today [~2820 m asl vs. 2360 m asl today] forest line position persisted under favorable growing conditions (i.e. TJuly at ca. 12 °C).”
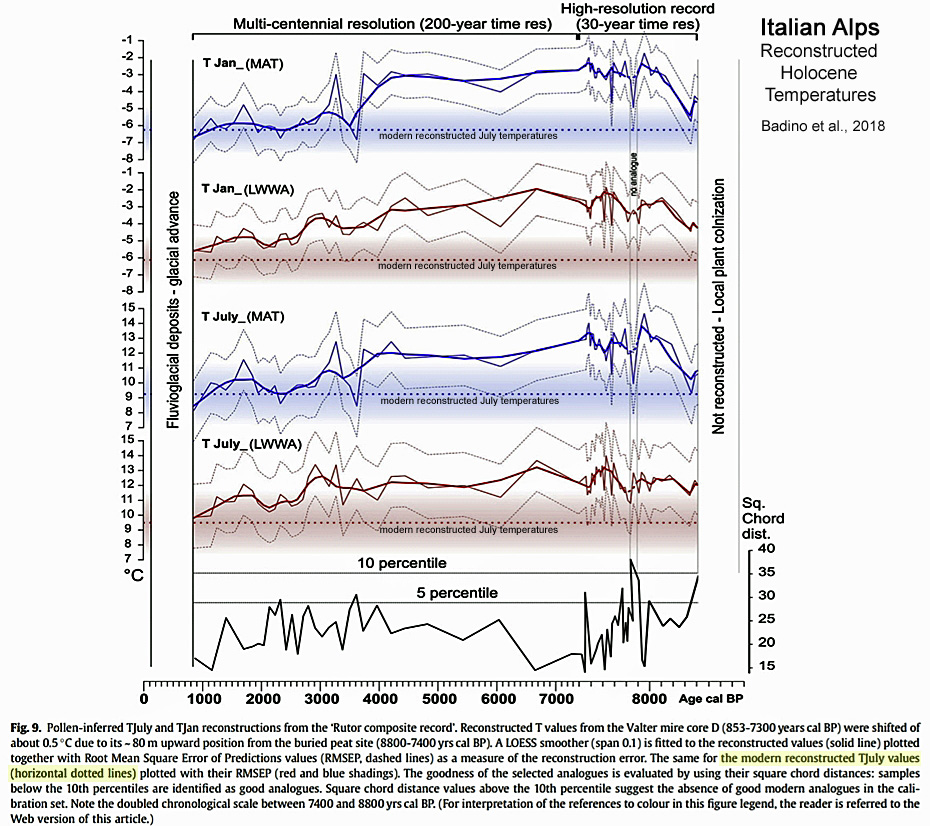
“Between ca. 8.4-4 ka cal BP, our site [Italian Alps] experienced a mean TJuly of ca. 12.4 °C, i.e. 3.1 °C warmer than today.”
“[O]ur lapse rate (0.67°C/100 m), [is] slightly steeper than the average of 0.6°C for temperate regions (Barry and Chorley, 1992) was provided at higher spatial resolution.”
Images Source: Badino et al., 2018
3. The Pyrenees (Spain) timber line exceeded today’s uppermost limit by 300-400 meters ~4,500 years ago, indicating Mid-Holocene surface temperatures were about 2°C higher
The temperature lapse rate for the Pyrenees region is 0.517°C/100 m according to a newly published paper.
“Estimation of near‐surface air temperature lapse rates over continental Spain and its mountain areas … The median NSLR [near‐surface (i.e., non‐free atmosphere) air temperature lapse rates] … Pyrenees −5.17 °C/km“ (Navarro-Serrano et al., 2018)
Leunda et al. (2018) have published a study that shows the Mid-Holocene (about 4,500 years ago) Pyrenees timber line was 300-400 meters higher than today’s uppermost limit.
This would suggest that Pyrenees temperatures were about 1.6 to 2.1°C warmer [3.5 X 0.517°C] than today during 4,650-4,200 calendar years before present.
Leunda et al., 2018
“The tree line ecotone was located at the cave altitude from 5,700 to 4,650 cal year bp, when vegetation consisted of open Pinus uncinata Ramond ex DC and Betula spp. Woodlands and timberline were very close to the site. Subsequently, tree line slightly raised and timberline reached the ice cave altitude, exceeding its today’s uppermost limit by c. 300–400 m during more than four centuries (4,650 and 4,200 cal year bp) at the end of the Holocene Thermal Maximum.”
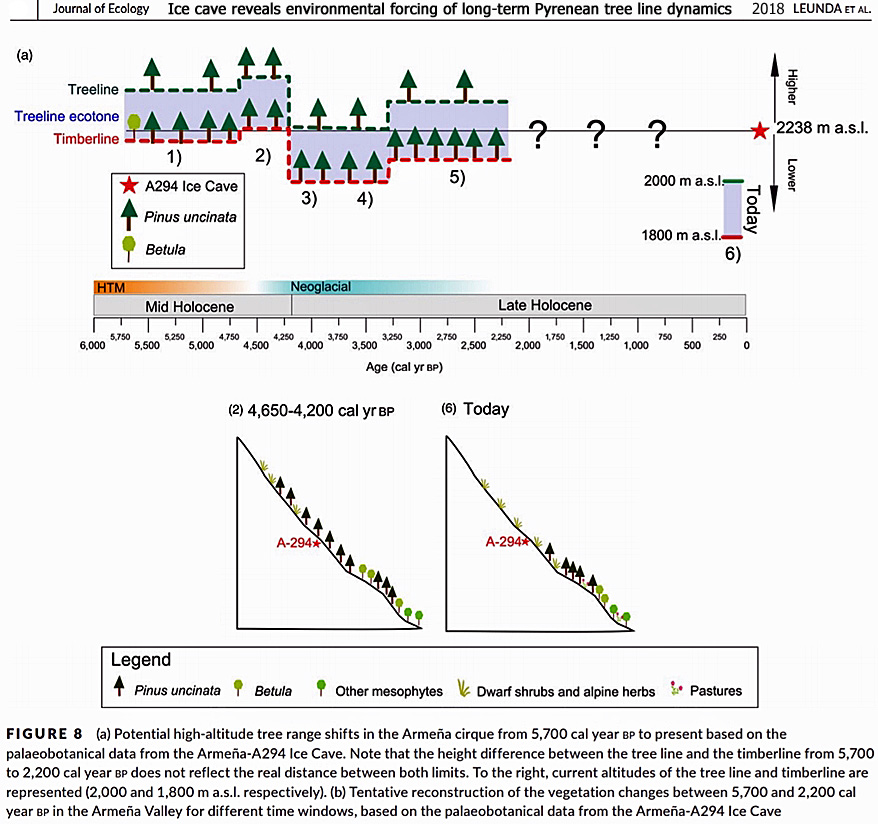
Image Source: Leunda et al. (2018)
4. Tree remnants found northern Sweden mountain sites 600 to 700 meters atop where the 21st century tree line ends imply the Early Holocene (9500 years ago) was 3-4°C warmer than today
The temperature lapse rate for the Swedish Lapland region is 0.6°C/100 m.
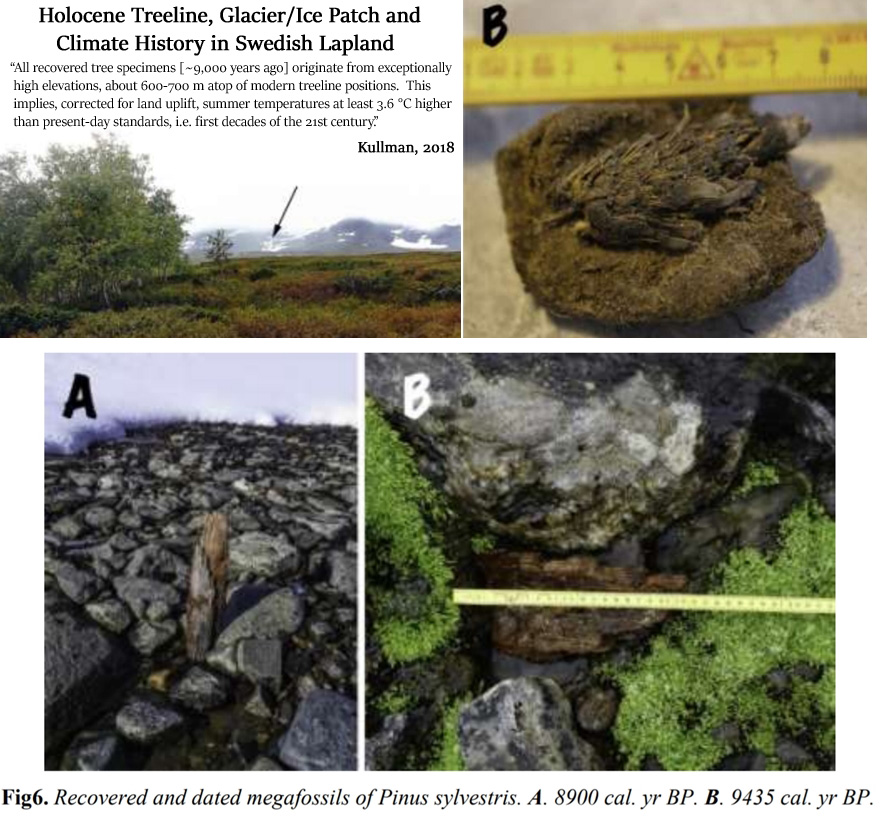
Kullman (2018) found tree debris (trunks, cones, roots, etc.) 600 to 700 meters atop modern tree line positions that were dated to about 9,500 years ago. Accounting for glacio-isostatic uplift, this tree line elevation implies surface air temperatures were 3.6°C higher than today during the Early Holocene.
Kullman, 2018
“The present paper reports results from an extensive project aiming at improved understanding of postglacial subalpine/alpine vegetation, treeline, glacier and climate history in the Scandes of northern Sweden. The main methodology is analyses of mega fossil tree remnants, i.e. trunks, roots and cones, recently exposed at the fringe of receding glaciers and snow/ice patches. This approach has a spatial resolution and accuracy, which exceeds any other option for tree cover reconstruction in high-altitude mountain landscapes.”
“All recovered tree specimens originate from exceptionally high elevations, about 600-700 m atop of modern treeline positions.”
“Conservatively drawing on the latter figure and a summer temperature lapse rate of 0.6 °C per 100 m elevation (Laaksonen 1976), could a priori mean that, summer temperatures were at least 4.2 °C warmer than present around 9500 year before present. However, glacio-isostatic land uplift by at least 100 m since that time (Möller 1987; Påsse & Anderson 2005)implies that this figure has to be reduced to 3.6 °C higher than present-day levels, i.e. first decades of the 21st century. Evidently, this was the warmth peak of the Holocene, hitherto. This inference concurs with paleoclimatic reconstructions from Europe and Greenland (Korhola et al. 2002; Bigler et al. 2003; Paus 2013; Luoto et al. 2014; Väliranta et al. 2015).”


QUESTION FOR MICHAEL MANN
How does one read tree ring widths of trees that have been dead and gone for centuries, done in by modern cold? Does one just “homogenize,” as with temperatures – you know, make them up? Or does one just ignore the problem, and pretend it doesn’t exist?
Michael Mann selects trees (bristlecone pines from North America) that can show a hockey stick shape when “processed”. Then he claims those trees represent the entire Northern Hemisphere, which earns him the Nobel Prize.
Interestingly, Marcott’s graph of “global” temperatures that makes it look like there was a dramatic increase in recent temperatures never revealed the contradictory data that showed the opposite.
http://science.sciencemag.org/content/339/6124/1198/tab-e-letters
“What Marcott has produced for us is a climatic history of the Holocene based upon tree-ring proxies.”
“1. The proxy data in the accompanying Excel file show no dramatic increase in the 20th century. This can easily be checked simply by plotting the supplied data. 2. Figures S5 and S6 show no recent upturn at all. 3. The Phd thesis of the first author uses the same data sets and plots similar graphs, but with no trace of any sharp increase. This earlier contradictory work is not cited in the paper.”
Thanks, Kenneth.
I also find what follows that quote to be very interesting, as well…
“Any one of these issues would raise serious questions about the validity of this work. Taken together they leave no doubt that the results presented are spurious and misleading. The paper should be withdrawn immediately.”
He then calls it “seriously flawed”.
Wow. I didn’t know anyone in academia who wasn’t retired would be so blunt. That’s a pleasant surprise.
Tree ring widths are proxies for many other things besides temperature. Photochemical kinetics would suggest that these include sunlight, cloud cover, ground water, humidity, carbon dioxide, soil nutrients and, just possibly, the length of the growing season, (i.e. temperature).
What Michael Mann and his followers do is to use principal component analysis to weight the various tee ring samples according to how well they pick up the modern, post ~1960, warming. This, almost inevitably, gives a high weighting to those samples that are proxies for carbon dioxide. This in turn, produces a hockey stick.
Actually, PCA should only be used to assess the relevance of different TYPES of proxy – not individual proxies.
The reason why tree rings seem to work as temperature proxies in earlier periods is that temperature pre ~1970 is very dependent on cloud cover and possibly, to a lesser extent, humidity.
This is a good reference, perhaps a little too good as indicated by the fact that it is no longer found without the help of the Wayback Machine.
https://web.archive.org/web/20080607095707/http://www.priweb.org/globalchange/climatechange/studyingcc/scc_01.html
It can also be found transcribed here (3rd article down – “Tree ring data unreliable”), with the following editorial comment:
“The guys below are tree ring experts and even though they are Warmists, they have to admit how difficult it is to draw any firm conclusions from such data” – John Ray (blog author)
Some more useful information here. Just watch out for the speculative warmist spin they put on it. While they do list some of the serious problems with tree ring data, they seem to me to brush them aside a little more willingly than they should.
NOTE – not much warmist spin in the last link above. I was being too defensive when first re-reading it. It’s not bad, actually.
A somewhat lively discussion going on at Judith Curry’s place regarding Hockey Sticks and the influence of a few specific series. And whether a graph from RealClimate by Gavin Schmidt is demonstrating the restoration of the MWP when Bristlecones and Tiljander series are removed.
https://judithcurry.com/2018/11/19/admitting-mistakes-in-a-hostile-environment/#comment-884400
More “settled science”.😁
You may also be interested in this report by Harvey Nichols from the late 1970s:
Historical Aspects of the Northern Canadian Treeline
http://pubs.aina.ucalgary.ca/arctic/Arctic29-1-38.pdf
ABSTRACT
From palynological studies it appears that northernmost dwarf spruces
of the tundra and parts of the forest-tundra boundary may be relicts from times of
prior warmth, and if felled might not regenerate. This disequilibrium may help
explain the partial incongruence of modern climatic limits with the present forest
edge. Seedlings established as a result of recent warming should therefore be found
within the northernmost woodlands rather than in the southern tundra.
Has a couple of maps and an old (1958) photo. 9 pages. Many references.
Michael Mann’s Nobel Prize is as fictitious as is his hockey stick.
Yes, indeed! The Nobel Prize was awarded to the IPCC. This was not one of the three scientific prizes but the Peace Prize – which has always been a reflection of what was at the time political correctness. It would have been more appropriate to award the IPCC the prize for literature – i.e. fiction!
Yup.
Yasser Arafat
Al Gore and a perverted railroad engineer
Barack HUSSEIN Obama
More like an anti-peace prize, it would seem.
Older papers that may also be of interest showing more geographically extensive reach for climatically warm periods.
From 2012
From https://www.researchgate.net/publication/257850228_Variations_of_the_tree_line_and_glaciers_in_the_Central_and_Eastern_Altai_regions_in_the_Holocene
Variations of the tree line and glaciers in the Central and Eastern Altai regions in the Holocene
Article (PDF Available) in Doklady Earth Sciences 444(2) · June 2012
DOI: 10.1134/S1028334X12060244}
A. N. Nazarov
Olga N Solomina Russian Academy of Sciences
Vladimir Myglan Siberian Federal University
The investigations were carried out in the Central and Eastern Altai regions at the territories of Russia, Kazakhstan, China, and Mongolia…
~~~~~~~~~~~~~~~~~
Also from 1993 this may be of interest —
http://science.sciencemag.org/content/260/5111/1104
A 3620-Year Temperature Record from Fitzroya cupressoides Tree Rings in Southern South America
Antonio Lara1, Ricardo Villalba
Science 21 May 1993:
Vol. 260, Issue 5111, pp. 1104-1106
DOI: 10.1126/science.260.5111.1104
Where the abstract says
Also of note is this interesting little piece —
Apparently some forest are very good at changing their local weather/climate, some may even ‘telconnect’ across the globe — https://www.quantamagazine.org/forests-emerge-as-a-major-overlooked-climate-factor-20181009/
Wow, what cd be more convincing of higher temperature than that the treeline was higher, as demonstrated by fossilized remains?!
My favorite graph is one which demonstrates the entire temperature record of the past 17,000 years allowing one to see pictorially our temperature relationship to past ages. It is the 3d graph in this article. https://www.globalresearch.ca/global-cooling-is-here/10783
Don Easterbrook, writing in 2008, was an early predictor of a cooling trend.
[…] https://notrickszone.com/2018/11/26/new-treeline-permafrost-evidence-strongly-affirms-the-mid-holocen… […]