Back in 1975, when there was still considearable concern about decades of Northern Hemisphere cooling, the National Academy of Sciences (NAS) announced in their report that the end of the current interglacial could arrive sooner than thought.
“[T]here is a finite probability that a serious worldwide cooling could befall the earth within the next hundred years.”
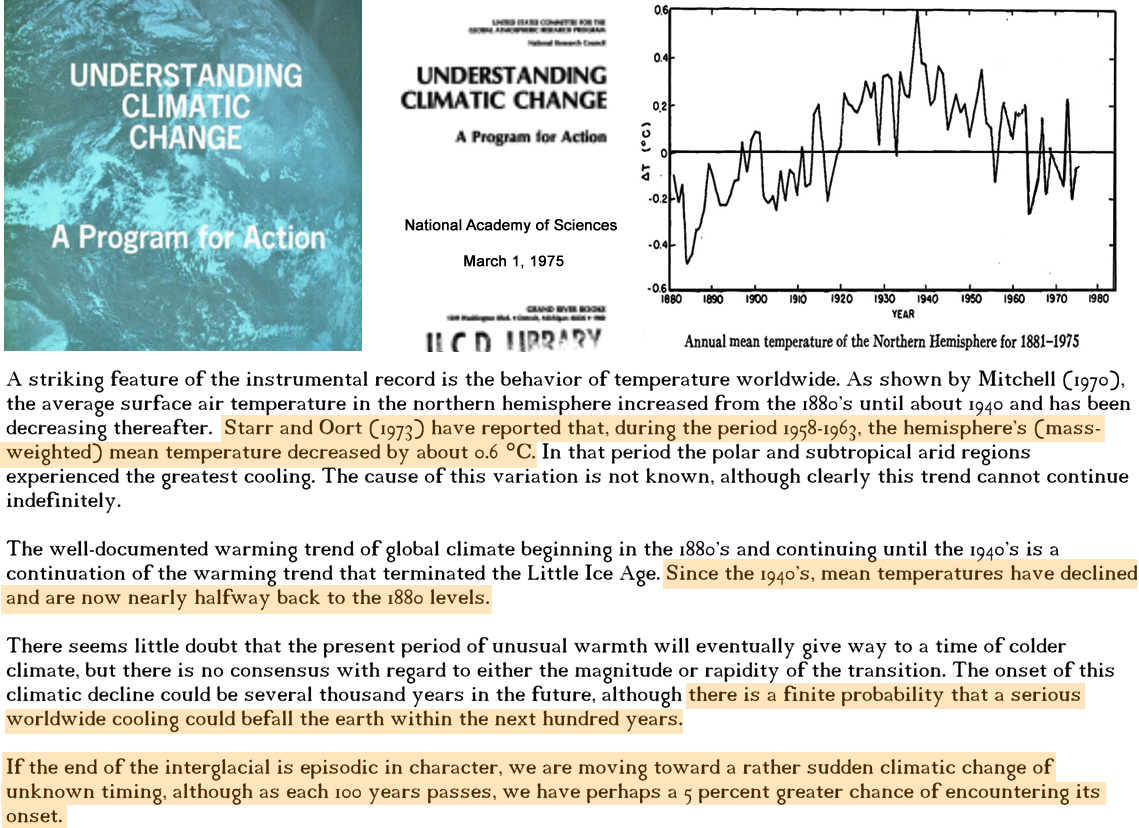
Image Source: NAS, 1975, Understanding Climatic Change
The NAS cooling concerns were substantiated by a 1973 scientific paper published in Nature that quantified a sharp cooling surge from 1958 to 1963.
According to Starr and Oort (1973), about 175,000 measured monthly temperatures for “92% of the atmosphere” indicated that the Northern Hemisphere cooled by -0.6°C during 1958-’63.
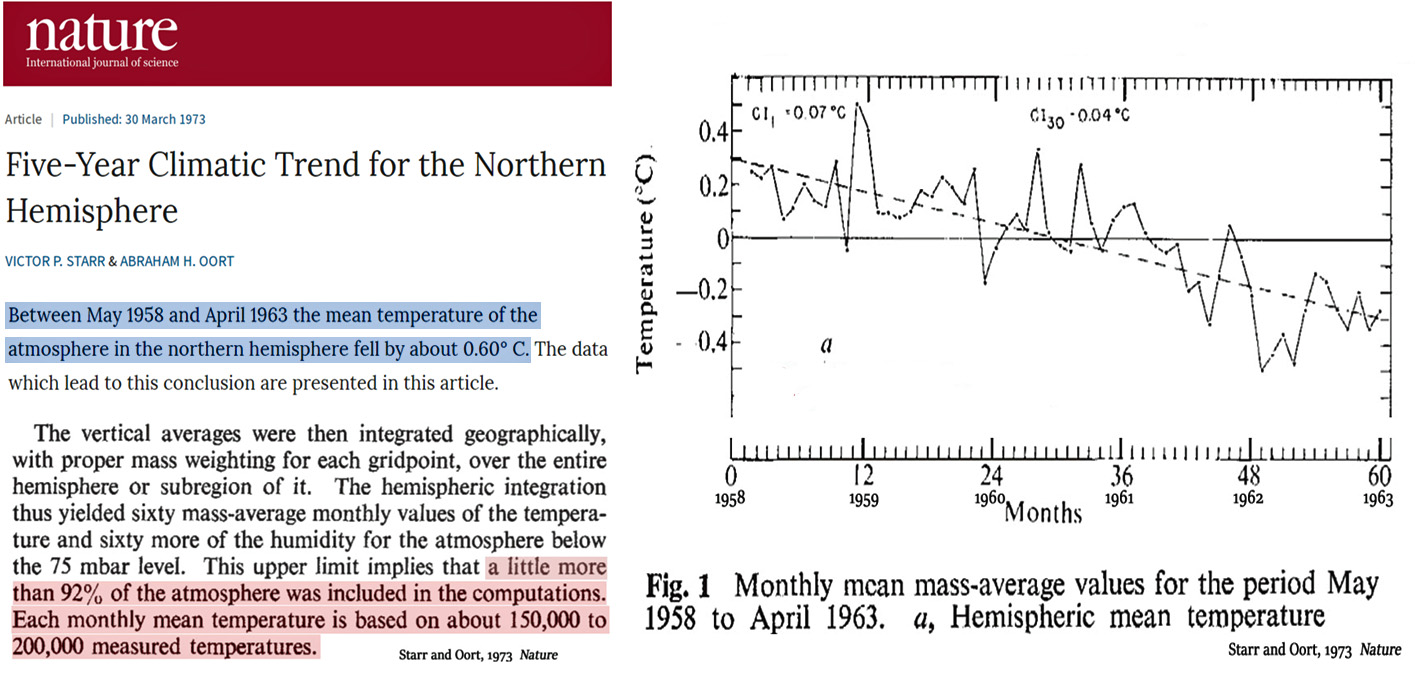
Image Source: Starr and Oort (1973)
In today’s NASA GISS temperature record there is no indication that a NH cooling of -0.6°C ever occurred.
Instead, the 1958-63 period looks to be either flat or only modestly decling (<0.1°C).
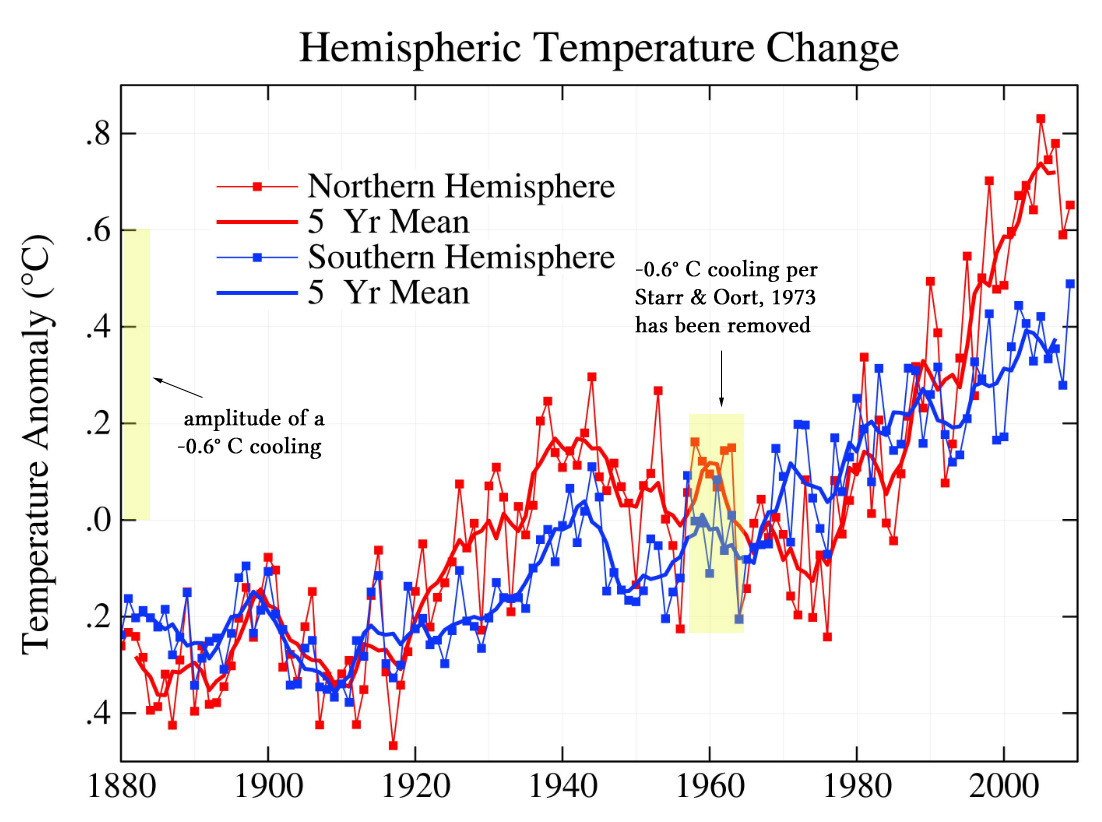
Image Source: NASA GIS
According to the prevailing evidence at the time, Pirazzoli, 1990 reported that a 0.5°C increase in global temperature had occurred between the years 1880 and 1950.
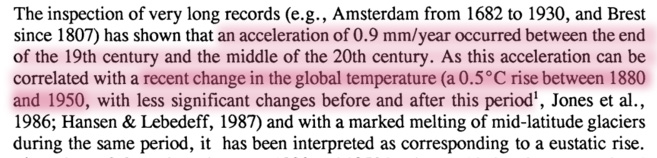
Today, that 0.5°C warming has disappeared. The same NASA GISS data set now has no warming between 1880 and 1950.
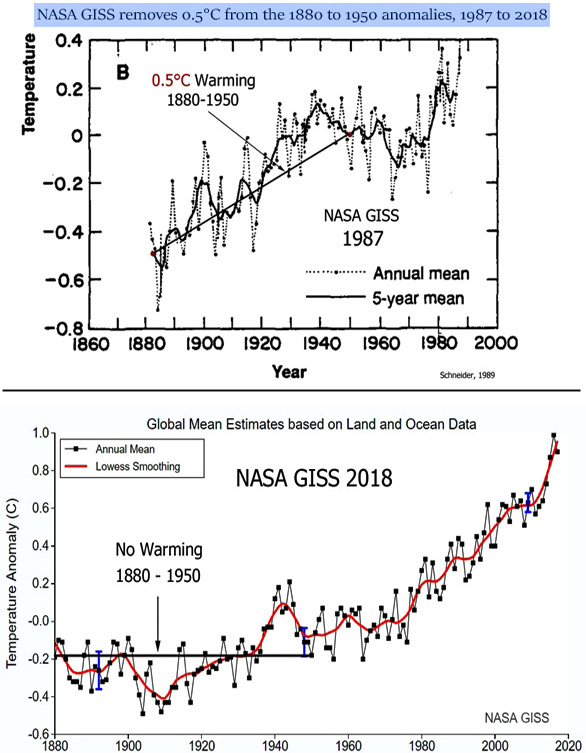
Image Source: Schneider, S. H. 1989, NASA GISS
Between 2008 and 2018, NASA GISS added 0.24°C of trend-steepening warmth to the 1910 to 2000 period. To accomplish this transformation, the pre-1950 temperatures were cooled, and the more recent temperatures were warmed up so as to create a more linear warming trend.
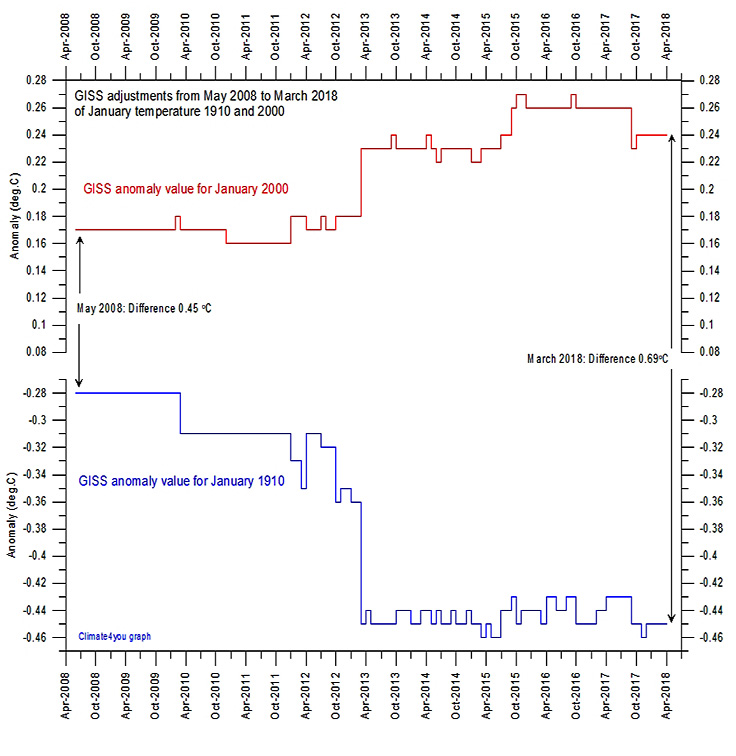
Image Source: climate4you.com
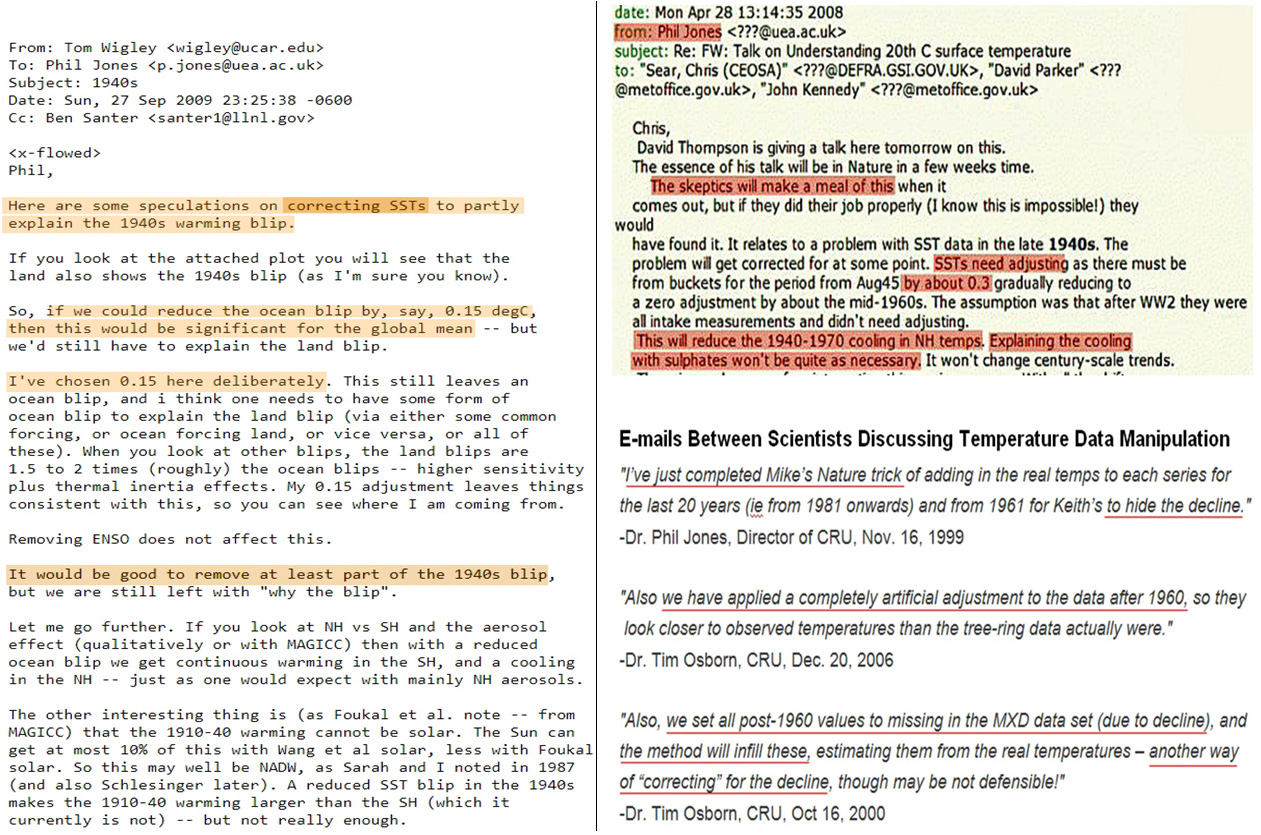
The motivation to change the data (i.e., “correct” the temperature record to support the “argument”), can be gleaned from the leaked e-mail exchanges between the overseers of temperature data sets.
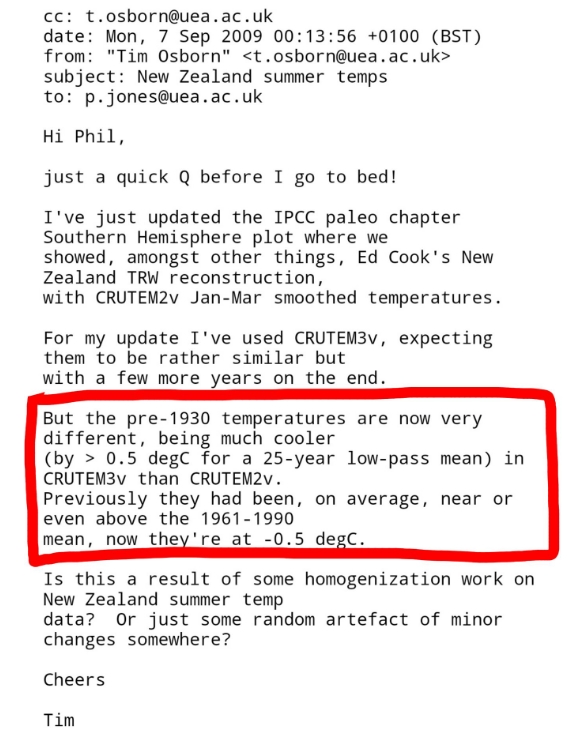
As there is considerable evidence that the integrity of the climate record has been compromised, it may be time to reconsider what the global temperature trends may look like when they are not “corrected” to fit the narrative preferred by data overseers.
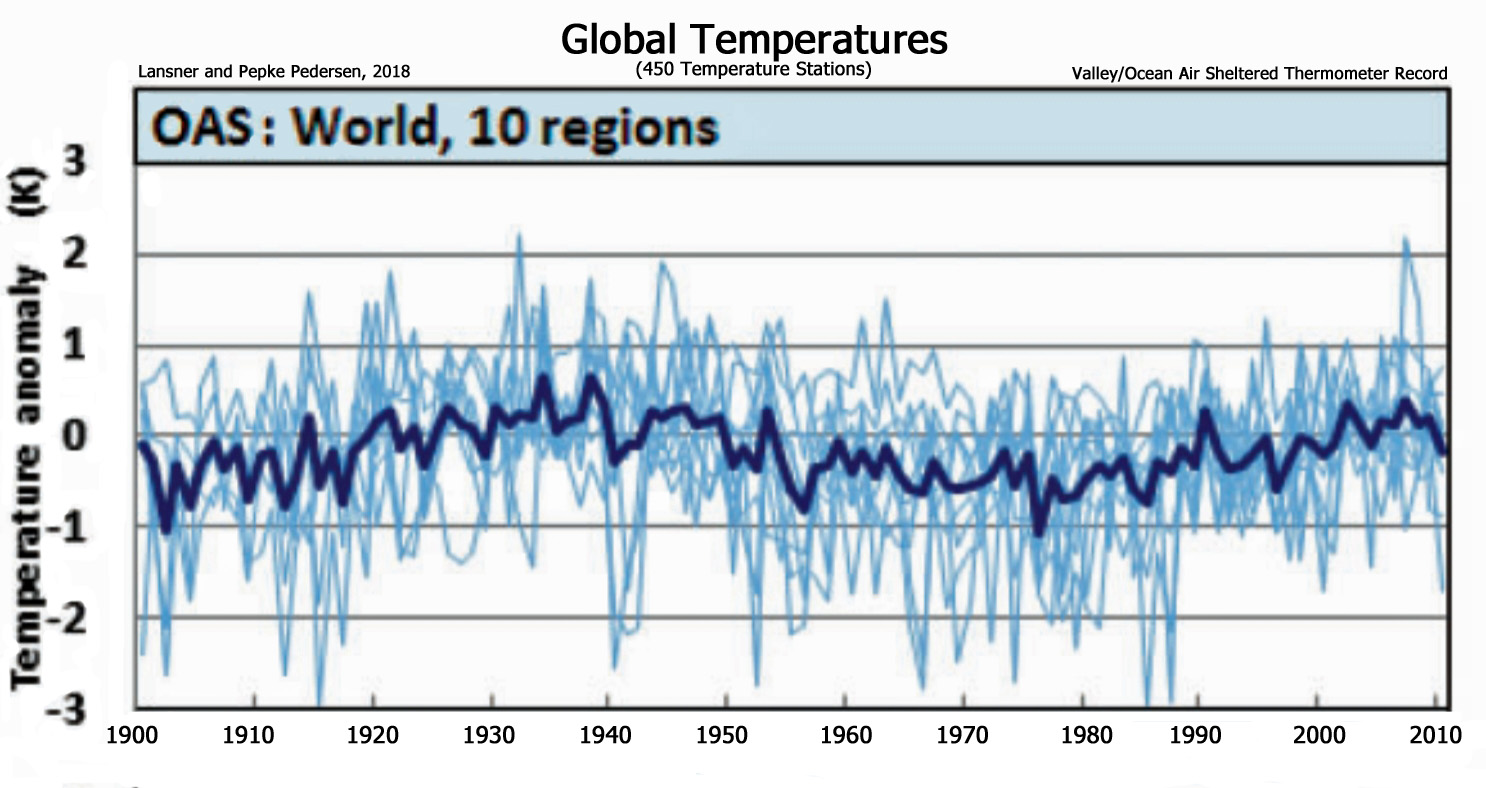
A year ago, a global instrumental dataset (450 temperature stations from across the world) was published (Lansner and Pepke Pedersen, 2018) that only used non-coastal — non-urban and non-ocean-air affected — thermometers. In other words, these temperature data have not been corrupted by aritificial or non-climatic thermal influences.
Without the biases and adjustments, the 1900 to 2010 instrumental record shows the more recent decades no warmer than the 1920s to 1940s. Further details on this temperature data set can be found here.


To adjust for urban heat islands (UHI), researchers either have to adjust the earlier temperatures down (the choice), or adjust the current temperature down, that is, take the “urbanization”
warming out.
If one does the latter, then current TV and internet reporting would not match what folks read on their porch thermometers. By doing the former, the line for temperature has a greater upward slope.
The data, as adjusted, are no longer useful.
I haven’t looked at the Lansner/Pepke Pedersen report but the abstract mentions ocean air-affected and air-sheltered stations.
A further look, maybe if I have time.
Also of interest are some comments of Frank Lansner about the article and the difficulties they faced in order to get the raw data and what they found :
https://borsen.dk/opinion/blogs/view/17/5015/pepke_pedersens_og_lansneras_nye_peer_rev_artikel_andrer_forstaelsen_af_globale_temperaturer.html
Regards
Surely you mean that in order to remove the impact of UHI: either to adjust the earlier temperatures up (because they are not adversely impacted by UHI) or adjust present day temperatures down (because they are artificially too high because they are impacted by UHI).
Of course if one is interested in the true teperature one would leave the historic old temperatures as they were (since they are not adversely impacted by UHI) and then adjust present day temperatures downwards to remove from modern temperatures the impact of UHI.
Obviously, one would make it quite clear why the adjustment is being made and why the order of adjustment is appropriate so that one can consider the validity of the adjustment.
Or why not better still just keep RAW unadjusted data as it is and then set error bounds which error bounds widen as we get towards the present as UHI becomes an ever increasing factor?
I suppose those manipulating the data imagine themselves to be wizards of climate as they magically change climate change history to meet their AGW illusions.
I imagine they are coming around to realize the game is up as we approach the solar minimum – although I watched a youtube segment where the speaker indisted a Maunder-type minimum would have no real effect on AGW according to his models which include TSI measurements of distant stars.
I suspect some tectonic events and/or volcanoes which have historically recognized during minimums may defeat his conclusions.
“Speaker insisted a Maunder-type…”
“Volcanoes which have been historically..”
The Lansner analysis is important because it takes seriously the existence of microclimates. From the abstract:
Temperature data 1900–2010 from meteorological stations across the world have been analyzed and it has been found that all land areas generally have two different valid temperature trends. Coastal stations and hill stations facing ocean winds are normally more warm-trended than the valley stations that are sheltered from dominant oceans winds.
Thus, we found that in any area with variation in the topography, we can divide the stations into the more warm trended ocean air-affected stations, and the more cold-trended ocean air-sheltered stations. We find that the distinction between ocean air-affected and ocean air-sheltered stations can be used to identify the influence of the oceans on land surface. We can then use this knowledge as a tool to better study climate variability on the land surface without the moderating effects of the ocean.
We find a lack of warming in the ocean air sheltered temperature data – with less impact of ocean temperature trends – after 1950. The lack of warming in the ocean air sheltered temperature trends after 1950 should be considered when evaluating the climatic effects of changes in the Earth’s atmospheric trace amounts of greenhouse gasses as well as variations in solar conditions.
My synopsis is https://rclutz.wordpress.com/2018/04/30/pushing-for-climate-diversity/
This is very significant, in my opinion, well within the grasp of mainstream journalists. I personally notice the change since i pay attention of the climate issue in the last 10 years or so… I think this should be more wildly known.
[…] The Northern Hemisphere Cooled By -0.6°C From 1958-’63. That Cooling Has Now Vanished. […]
Both Phil Jones (of CRU) in his 1980 paper, and Hansen in his 1981 Science papaer showed this Northern Hemishere cooling, and both noted that as at 1980 the NH was still some 0.3deg C cooler than the NH highs of about 1940.
It is even set out in the first IPCC Report.
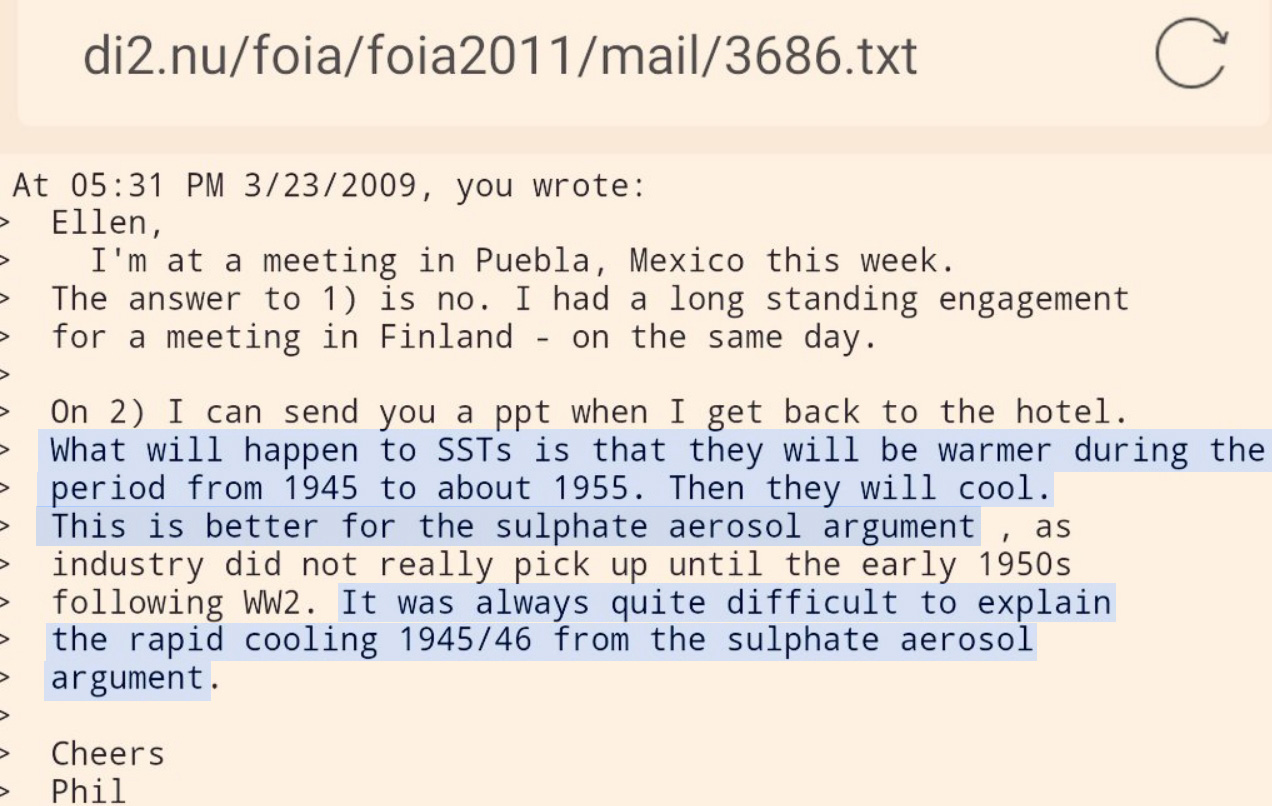
Phil Jones :
“… as the industry did not really pick up until the early 1950s following WWII.
It was always quite difficult to explain the rapid cooling 1945/46 from the sulfate aerosol argument. ”
Why bother ?
Ya know, in climate “science” consequences often happen before causes, particularly when most of these causes are phony.
Just more “World’s Best Practice” temperature homogenisation.
Imagine the embarrassment if the globe was not warming as the climate models predict! Trump would be one of a very small number of politicians who would be proven right – that will never be permitted to happen.
The entire globe could be covered in ice and snow and the CAGW believers would be told it is more evidence of Climate Change and a short reversal in the ever present warming trend.
[…] Read more at No Tricks Zone […]
April 4, 2019 Study: Early 21st-Century Global Warming Hiatus Is Real
A new study by Williams et al appearing in the Journal of Atmospheric and Solar-Terrestrial Physics shows that the global warming hiatus of the early 21st century was in fact real.
https://principia-scientific.org/study-early-21st-century-global-warming-hiatus-is-real/
[…] Read more at No Tricks Zone […]