By Kenneth Richard on 3. October 2019
In the last few years, hundreds of peer-reviewed scientific papers have been published linking changes in solar activity to Earth’s climate (2016, 2017, 2018). The evidence for a robust Sun-Climate connection continues to accumulate in 2019.
When it comes to the Sun’s influence on climate, one conclusion is certain: there is no widespread scientific agreement as to how and to what extent solar activity and its related parameters (i.e., galactic cosmic rays, geomagnetic activity, solar wind flux) impact changes in the Earth’s temperature and precipitation.
The disagreement is so chasmic and the mechanisms are so poorly understood that scientists’ estimates of the influence of direct solar irradiance forcing between the 17th century and today can range between a negligible +0.1 W m-2 to a very robust +6 W m-2 (Egorova et al., 2018; Mazzarella and Scafetta, 2018).
“There is no consensus on the amplitude of the historical solar forcing. The estimated magnitude of the total solar irradiance difference between Maunder minimum and present time ranges from 0.1 to 6 W/m2 making uncertain the simulation of the past and future climate.” (Egorova et al., 2018)
“According to the IPCC (2013), solar forcing is extremely small and cannot induce the estimated 1.0–1.5 °C since the LIA. However, thesolar radiative forcing is quite uncertain because from 1700 to 2000 the proposed historical total solar irradiance reconstructions vary greatly from a minimum of 0.5 W/m2 to a maximum of about 6 W/m2 (cf..: Hoyt and Schatten 1993; Wang et al. 2005; Shapiro et al. 2011). Moreover, it is believed that the sun can influence the climate also via a magnetically induced cosmic ray flux modulation (e.g.: Kirkby 2007) or via heliospheric oscillation related to planetary resonances (e.g.: Scafetta 2013, 2014b; Scafetta et al. 2016, and others). Since solar and climate records correlate quite significantly throughout the Holocene (cf: Kerr 2001; Steinhilber et al. 2012; Scafetta 2012, 20104b), the results shown herein may be quite realistic, although the exact physical mechanisms linking astronomical forcings to climate change are still poorly understood.” (Mazzarella and Scafetta, 2018)
Thus far in 2019, 55 scientific papers have been located that link solar forcing to climate changes. This is an incomplete compilation and it is likely to swell to about ~100 papers by year’s end or upon further review.
Such a large volume of research devoted to finding connections between the Sun’s variability and its effect on the Earth’s climate system would seem to contradict the conclusion that there is widespread consensus that the Sun’s climate impact is negligible.
Below are the first 12 papers on the list. For the rest of the compilation, click here.
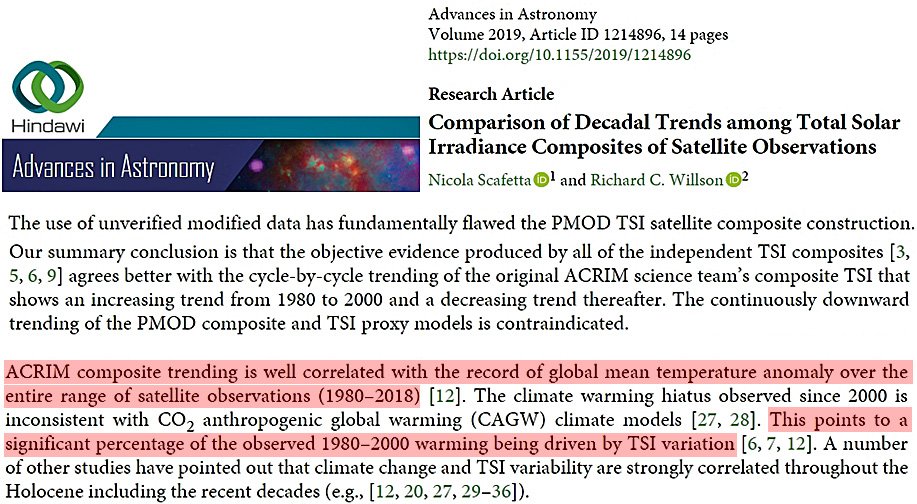
Scafetta and Willson, 2019 The consistent downward trending of the PMOD TSI composite is negatively correlated with the global mean temperature anomaly during 1980–2000. This has been viewed with favor by those supporting the CO2 anthropogenic global warming (CAGW) hypothesis since it would minimize TSI variation as a competitive climate change driver to CO2, the featured driver of the hypothesis during the period (cf.: [IPCC, 2013, Lockwood and Fröhlich, 2008]). .. Our summary conclusion is that the objective evidence produced by all of the independent TSI composites [3,5, 6, 9] agrees better with the cycle-by-cycle trending of the original ACRIM science team’s composite TSI that shows an increasing trend from 1980 to 2000 and a decreasing trend thereafter. The continuously downward trending of the PMOD composite and TSI proxy models is contraindicated. … PMOD’s modifications of the published ACRIM and ERB TSI records are questionable because they are based on conforming satellite observational data to proxy model predictions. … ACRIM shows a 0.46 W/m2 increase between 1986 and 1996 followed by a decrease of 0.30 W/m2 between 1996 and 2009. PMOD shows a continuous, increasing downward trend with a 1986 to 1996 decrease of 0.05 W/m2 followed by a decrease of 0.14 W/m2 between 1996 and 2009. The RMIB composite agrees qualitatively with the ACRIM trend by increasing between the 1986 and 1996 minima and decreasing slightly between 1996 and 2009. … ACRIM composite trending is well correlated with the record of global mean temperature anomaly over the entire range of satellite observations (1980–2018) [Scafetta. 2009]. The climate warming hiatus observed since 2000 is inconsistent with CO2 anthropogenic global warming (CAGW) climate models [Scafetta, 2013, Scafetta, 2017]. This points to a significant percentage of the observed 1980–2000 warming being driven by TSI variation [Scafetta, 2009, Willson, 2014, Scafetta. 2009]. A number of other studies have pointed out that climate change and TSI variability are strongly correlated throughout the Holocene including the recent decades (e.g., Scafetta, 2009, Scafetta and Willson, 2014, Scafetta, 2013, Kerr, 2001, Bond et al., 2001, Kirkby, 2007, Shaviv, 2008, Shapiro et al., 2011, Soon and Legates, 2013, Steinhilber et al., 2012, Soon et al., 2014). .. The global surface temperature of the Earth increased from 1970 to 2000 and remained nearly stable from 2000 and 2018. This pattern is not reproduced by CO2 AGW climate models but correlates with a TSI evolution with the trending characteristics of the ACRIM TSI composite as explained in Scafetta [6,12, 27] and Willson [7].
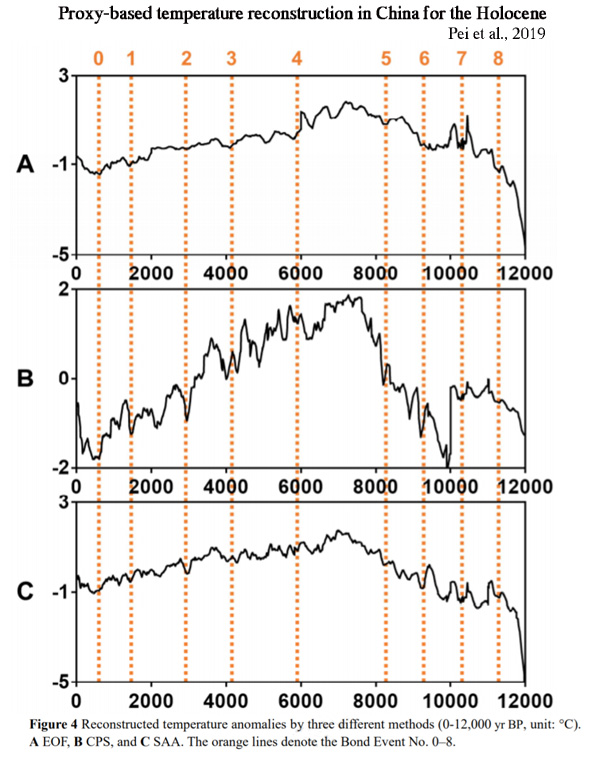
Pei et al., 2019 During the period of 0–10,000 yr BP, China’s temperature has closely followed the solar forcing. The correlation is as high as 0.800 (p < 0.01) for the EOF-based reconstruction. … Similar to the North Atlantic SST, AO also plays an important role in China’s temperature (Zuo et al., 2015). NAO and AO are both suggested to influence the climate in East Asia by modifying the strength and location of the 200 hPa jet stream (Yang et al., 2004). The AO record of Darby et al. (2012) is based on sea-ice drift, which has a high resolution of 10–100 years and shows a close connection with solar activities.
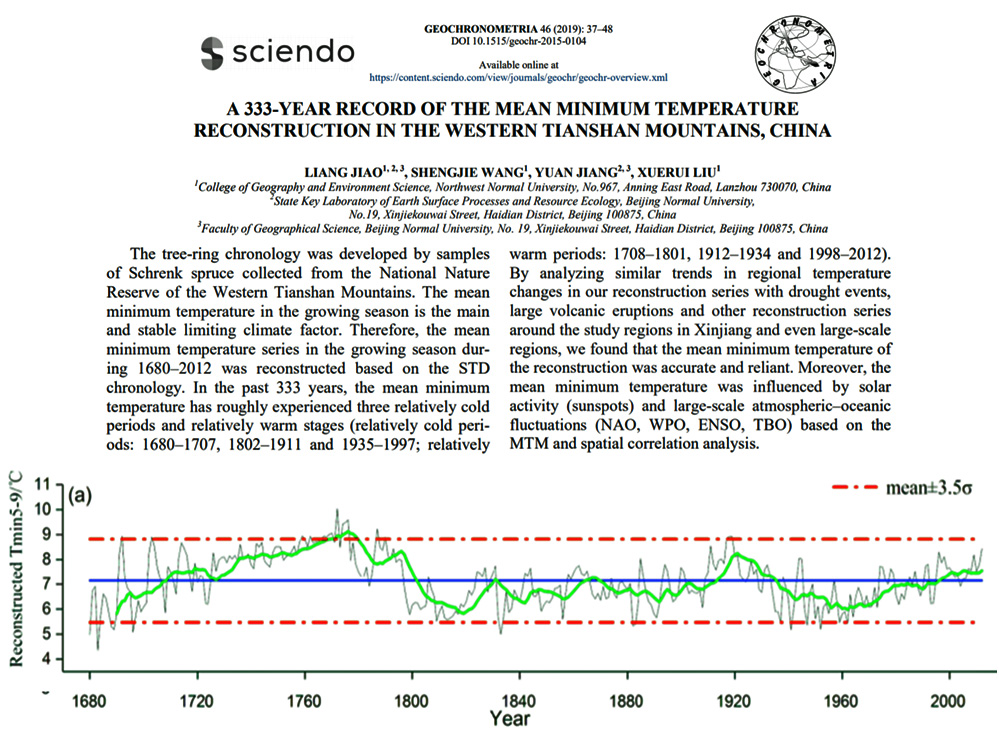
Jiao et al., 2019 Regional climate change is affected by large-scale climate-forcing factors, such as solar activity and atmospheric–oceanic variability (Fang et al., 2010; Linderholm et al., 2015; Rydval et al., 2017). On the one hand, based on the MTM analysis results, the temperature changes in the study area are mainly influenced by the solar activity via the mean minimum temperature within approximately 11-year periods (Li et al., 2006; Wang et al., 2015). The tree-ring chronology was developed by samples of Schrenk spruce collected from the National Nature Reserve of the Western Tianshan Mountains. The mean minimum temperature in the growing season is the main and stable limiting climate factor. Therefore, the mean minimum temperature series in the growing season during 1680–2012 was reconstructed based on the STD chronology. In the past 333 years, the mean minimum temperature has roughly experienced three relatively cold periods and relatively warm stages (relatively cold periods: 1680–1707, 1802–1911 and 1935–1997; relatively warm periods: 1708–1801, 1912–1934 and 1998–2012). By analyzing similar trends in regional temperature changes in our reconstruction series with drought events, large volcanic eruptions and other reconstruction series around the study regions in Xinjiang and even large-scale regions, we found that the mean minimum temperature of the reconstruction was accurate and reliant. Moreover, the mean minimum temperature was influenced by solar activity (sunspots) and large-scale atmospheric–oceanic fluctuations (NAO, WPO, ENSO, TBO) based on the MTM and spatial correlation analysis.
Zharkova et al., 2019 Recently discovered long-term oscillations of the solar background magnetic field associated with double dynamo waves generated in inner and outer layers of the Sun indicate that the solar activity is heading in the next three decades (2019–2055) to a Modern grand minimum similar to Maunder one. On the other hand, a reconstruction of solar total irradiance suggests that since the Maunder minimum there is an increase in the cycle-averaged total solar irradiance (TSI) by a value of about 1–1.5 Wm−2 closely correlated with an increase of the baseline (average) terrestrial temperature. … These oscillations of the baseline solar magnetic field are found associated with a long-term solar inertial motion about the barycenter of the solar system and closely linked to an increase of solar irradiance and terrestrial temperature in the past two centuries. This trend is anticipated to continue in the next six centuries that can lead to a further natural increase of the terrestrial temperature by more than 2.5 °C by 2600.
Deke et al., 2019 The results provide robust evidence for synchronous ~500-yr cyclical changes in monsoon climate, human activity and prehistoric cultural development in the East Asian Monsoon (EAM) region during the Holocene. Six prosperous phases of Neolithic and Bronze Age cultures correspond approximately to warm-humid phases caused by a strengthened EASM, except for the first expansion of the Hongshan culture, which corresponds to the phase of strongest EASM in the middle Holocene. We suggest that humans responded to climatic fluctuations with different social strategies, leading to the rise and fall of early complex societies in the region.
(press release) The climate theory casting new light on the history of Chinese civilisation … Researchers say that when 500-year-long sun cycles brought warmth, communities flourished, but when the Earth cooled, ancient societies collapsed. … Scientists say they have found evidence beneath a lake in northeastern China that ties climate change and 500-year sun cycles to ups and downs in the 8,000 years of Chinese civilisation. According to the study by a team at the Institute of Geology and Geophysics in Beijing published in the science journal Nature Communications this month, whenever the climate warmed, Chinese civilisation prospered and when it cooled, it declined.
Jin et al., 2019 We show that a strong 11-year solar cycle can excite a resonant response of the intrinsic leading mode of the AWM [Asian winter monsoon] variability, resulting in a significant signal of decadal variation. The leading mode, characterized by a warm Arctic and cold Siberia, responds to the maximum solar irradiance with a peculiar 3 to 4-year delay. We propose a new mechanism to explain this delayed response, in which the 11-year solar cycle affects the AWM via modulating Arctic sea ice variation during the preceding summer. At the peak of the accumulative solar irradiance (i.e., 4 years after the maximum solar irradiance), the Arctic sea ice concentration reaches a minimum over the Barents–Kara Sea region accompanied by an Arctic sea surface warming, which then persists into the following winter, causing Arctic high-pressure extend to the Ural mountain region, which enhances Siberian High and causes a bitter winter over the northern Asia.
Horikawa et al., 2019 The Mg/Ca-derived SST record clearly represented five warmer periods at 6200–6000, 4900–4500, 4200–3800, 2600–2100, and 900–400 cal. year BP, almost consistent with previously published diatom records. These warmer events also corresponded to the periods in which warm molluscan assemblages increased at the northern end of the TWC, suggesting that periods of higher SST can be seen as reflecting the increased volume transport of the TWC. We interpreted the results of a model study showing that higher solar irradiance provoked positive Arctic Oscillation (AO)-like spatial patterns and the negative phase of the Pacific Decadal Oscillation (PDO) to mean that increased (reduced) TWC volume transport on the multi-centennial to millennial time scales was caused by high (low) solar insolation via a potential link between AO and PDO.
Kossobokov et al., 2019 On the Diversity of Long-Term Temperature Responses to Varying Levels of Solar Activity at Ten European Observatories … In the present paper, we propose a short but in-depth overview of a very specific topic, i.e., the statistical testing of hypotheses related to solar influence on regional temperature regimes at the time scale of several decades. … These new observations lead us to conclude that the climate in different regions presents different responses to variations in solar activity. Moreover, the distributions of the lower, middle, and higher quartiles of the temperature and pressure indices in solar cycles with high versus low activity are significantly different, providing further robust statistical confirmation to this conclusion (confidence level higher to much higher than 99% using the Kuiper test).
Wu et al., 2019 On the centennial to millennial time scale, the results of wavelet analysis and band‐pass filtering show that the occurrence and development of El Niño have also promoted a weaker EAWM after ~6.0 ka cal. BP, which is inversely correlated with the variation of the ca. 500‐year cycle originated from changes in solar output. These results imply that the climate transition in the mid‐Holocene is caused by the change of variations in solar activity and amplified by ocean circulation El Niño‐Southern Oscillation to influence the East Asian Monsoon system, especially the EAWM, and finally change the vegetation in Great Khingan Mountain Range.
(press release) Lead scientist Dr Wu Jing, from the Key Laboratory of Cenozoic Geology and Environment at the Institute of Geology and Geophysics, part of the Chinese Academy of Sciences, said the study had found no evidence of human influence on northern China’s warming winters. … The study found that winds from Arctic Siberia have been growing weaker, the conifer tree line has been retreating north, and there has been a steady rise in biodiversity in a general warming trend that continues today. It appears to have little to do with the increase in greenhouse gases which began with the industrial revolution, according to the researchers. As a result of the research findings, Wu said she was now more worried about cooling than warming.
Wang et al., 2019 Here we present the first high-resolution stable isotope (δ13C and δ18O) speleothem record from northern Laos spanning the Common Era (∼50 BCE to 1880 CE). The δ13C record reveals substantial centennialscale fluctuations primarily driven by local water balance. Notably, the driest period at our site occurred from ∼1280 to 1430 CE, during the time of the Angkor droughts, supporting previous findings that this megadrought likely impacted much of Mainland Southeast Asia. In contrast, variations in stalagmite δ18O reflect changes in rainfall upstream from our study site. Interestingly, the δ18O record exhibits a positive correlation with solar activity that persists after 1200 CE, contrary to the findings in previous studies. Solar-forced climate model simulations reveal that these δ18O variations may be driven by solar-forced changes in upstream rainout over the tropical Indian Ocean, which modify the δ18O of moisture transported to our study site without necessarily affecting local rainfall amount. We conclude that future rainfall changes in Mainland Southeast Asia are likely to be superimposed on multi-decadal to centennial-scale variations in background climate driven primarily by internal climate variability, whereas solar forcing may impact upstream rainout over the Indian Ocean.
Misios et al., 2019 The Pacific Walker Circulation (PWC) fluctuates on interannual and multidecadal timescales under the influence of internal variability and external forcings. Here, we provide observational evidence that the 11-y solar cycle (SC) affects the PWC on decadal timescales. We observe a robust reduction of east–west sea-level pressure gradients over the Indo-Pacific Ocean during solar maxima and the following 1–2 y. This reduction is associated with westerly wind anomalies at the surface and throughout the equatorial troposphere in the western/central Pacific paired with an eastward shift of convective precipitation that brings more rainfall to the central Pacific. We show that this is initiated by a thermodynamical response of the global hydrological cycle to surface warming, further amplified by atmosphere–ocean coupling, leading to larger positive ocean temperature anomalies in the equatorial Pacific than expected from simple radiative forcing considerations. The observed solar modulation of the PWC is supported by a set of coupled ocean–atmosphere climate model simulations forced only by SC irradiance variations. We highlight the importance of a muted hydrology mechanism that acts to weaken the PWC. Demonstration of this mechanism acting on the 11-y SC timescale adds confidence in model predictions that the same mechanism also weakens the PWC under increasing greenhouse gas forcing.
Bhargawa and Singh, 2019 Since the Sun is the main source of energy for our planet therefore even a slight change in its output energy can make a huge difference in the climatic conditions of the terrestrial environment. The rate of energy coming from the Sun (solar irradiance) might affect our climate directly by changing the rate of solar heating of the Earth and the atmosphere and indirectly by changing the cloud forming processes. … In our investigation, we have observed that the impact of solar irradiance on the global surface temperature level in next decade will increase by ∼4.7% while the global mean sea level will increase about 0.67%. In the meantime, we have noticed about 5.3% decrement in the global sea-ice extent for the next decade. In case of the global precipitation anomaly we have not observed any particular trend just because of the variable climatic conditions. We also have studied the effect of CO2 as anthropogenic forcing where we have observed that the global temperature in the next decade will increase by 2.7%; mean sea level will increase by 6.4%. Increasing abundance in CO2 will be responsible for about 0.43% decrease in the sea-ice extent while there will not be any change in the precipitation pattern.
Zaffar et al., 2019 This study shows that every value of El Nino-southern oscillation (ENSO) Cycles and Sunspot Cycles are strongly correlated to preceding values in both the self-similar and self-affine cases. Unit root test is applied to the tail parameter and the strength of long range-correlation of El Nino-southern oscillation (ENSO) and Sunspot Cycles confirms stationary behavior of the parameters. The variation of earth climatic has a strong influence in Sunspots Cycles and El Nino-southern oscillation (ENSO) Cycles. Sunspots and El Nino-southern oscillation (ENSO) have strong correlation with each other (Asma et al. 2018). The El Nino-southern oscillation (ENSO) cycles influence on the variation of the parameter of local climate which depends on the changes in solar activity.
Posted in Solar Sciences |


TSI isn’t all that the sun has for us
https://www.youtube.com/watch?v=rEWoPzaDmOA
See what happens during solar flares (around 6 mins 30 secs into the video)
IMO the length of this post and other long posts here degrade the post’s effectiveness. Suggest shortening the amount of material displayed for your longer posts and adding a “Read More” link at the end for those interested in wading through an account of 55 papers or other large amount of material.
Your suggestion has been heeded. The list was reduced to the first 12 and then a “click here” link was added for the rest. Thank you.
Thanks, Kenneth. I do enjoy your material, but I also find it hard to read that much at one sitting. It would be a shame for you to do all that excellent work, and not have it given the attention it surely deserves.
Looking forward to your new method of presentation. Maybe now I can read enough of it to feel able to comment appropriately.
JKintheUSA,
Many readers, including myself, may feel like you about the lengthy presentation. Your “Read More” suggestion is constructive, from my point of view.
At the same time, I cannot stress enough how important Kenneth’s contributions are, how valuable his search for papers is and how useful it is to have a repository of scientific findings such as offered by NoTricksZone.
Thank you ever so much Kenneth, and please keep going!
Thanks Kenneth for this current array of solar studies.
The ocean produces the low clouds Svensmark claims for his cosmic ray theory, during increasing MEI/decreasing Central Pacific OLR conditions, as observed here using figure 10 from his recent paper.
Plot of strong OLR-cloud relationship and here, and the strong Nino34-MEI-CP OLR relationships.
Cosmic rays exhibit almost no correlation with ISCCP clouds.
It’s no coincidence that cosmic rays and clouds follow the solar cycle, but to claim cosmic rays cause the clouds is a misattribution, like misattributing temperature rise to increasing CO2, wherein both theories implicitly ignore the primary role of the sun’s TSI in warming/cooling the ocean that results in evaporation and clouds.
@Bob Weber
You write “Cosmic rays exhibit almost no correlation with ISCCP clouds.”, linking for “proof” to graphed data, allegedly from OULU Cosmic Ray Station, that purports to disprove any connection with clouds.**
Are you aware that the head of the OULU Cosmic Ray Station, Ilya Usoskin has published that cosmic rays DO have an influence on low magnetic latitude clouds?
http://cc.oulu.fi/~usoskin/personal/Usoskin_AG06.pdf
Sorry, but your material in support of your contention appears to be insufficient and not specific enough to support it.
**Where is that graphic from? Who is (or was) “coolclimateinfo”?
https://coolclimate.info/
….nobody home…..(at least not when I visited a few minutes ago)
Cosmic rays correlate very poorly with clouds overall, which is one piece of evidence against it.
The graphic you asked about is the cross-correlation of Oulu cosmic rays with the individual parameters noted on it, including ISCCP clouds which exhibit almost zero correlation with cosmic rays.
The low clouds claimed for cosmic rays are actually generated by the ocean as my evidence indicates. So what if Usoskin says something else. Michael Mann says things all the time too, like ‘the climate is human-caused now’, so should I believe him too on faith or should I look at the evidence?
The cosmic ray hypothesis has insufficient supporting evidence.
The evidence shows the CP OLR was in the positive most of the time since the big ENSO ended in 2016, which absolutely means there were fewer clouds since then than during the very time cosmic ray clouds were increasing and supposedly creating cooling clouds.
The cooling since 2016 is from lower TSI, not higher cosmic rays. The cosmic ray theory is going nowhere – it’s actually the solar climate theory for dummies. You have to be smart to understand TSI, but for cosmic ray theory, just the usual big hand wave will do for many.
As to my domain – I didn’t tell you my website was open did I? Not that it’s any of your business, but coolclimateinfo is my wordpress login name that I acquired years ago so I could converse on Dr. Curry’s site, and actually opening the site is at my discretion and schedule.
I’ve also owned this domain longer than coolclimate, and I didn’t start using it until this week, two days ago, over five years after I bought it, fyi.
“The graphic you asked about is the cross-correlation of Oulu cosmic rays with the individual parameters noted on it, including ISCCP clouds which exhibit almost zero correlation with cosmic rays.” – Bob Weber
There is no such thing as “ISCCP clouds.” ISCCP is a database of cloud data, not a cloud type. And yes, not all clouds correlate with cosmic rays, only low clouds om low magnetic latitudes, according to the head of OULU. By including all cloud data at all latitudes, you mask the effect cosmic rays have. Also, by preventing us from validating that graph, which for all we know could have been made by your parakeet, you prevent us from cross checking its validity.
In any case, if the head of OULU publishes a paper that says cosmic rays have an effect on cloud formation, why should I believe you and your unverifiable graph that it doesn’t?
You want to have credibility, go ahead and earn it.
You didn’t address the falsifications I brought up.
I meant the total ISCCP cloud data, if you didn’t realize. No overall cloud connection to cosmic rays is indicated in my cross-correlation image, seriously calling into question the relative strength of the supposedly large northern cosmic ray-low cloud influence on climate – just one strike against CR theory.
The northern climate atmosphere is cooling and expanding southward from solar minimum low TSI, concurrent with the arctic ocean warming from warm water that filtered in from the tropics this year where Nino4 was especially warm.
As I said before the fact is there are fewer clouds now not more because OLR is positive, as it has been most of the time since 2016, while cosmic rays have increased.
My sun-climate work is very credible with successful predictions, which includes what is coming this winter, another of many TSI-based climate predictions I made over the past five years that you probably didn’t know about. The cosmic ray crowd gets all the press and support but plays it safe with no specific predictions.
The low clouds are sourced by Nino34 spikes. The warm tropical waters spread into the northern ocean while simultaneuously the atmosphere cools in the north during the solar minimum as TSI declines, perfect conditions for low-level evaporation and clouds that are mistakenly attributed to cosmic rays that are concurrently high with the low TSI.
These low level clouds are similar to the fog over a warm pond or lake when the air temperature is very low, same principle.
The northern climate is in sync with the ocean, driven by the tropics.
For cosmic ray theory to be viable, it must control the tropics, Nino34, but how can it do that when galactic radiation doesn’t reach that far?
“you didn’t address the falsifications I brought up.
I meant the total ISCCP cloud data” – Bob Weber
Yes, I did. I wrote…
“By including all cloud data at all latitudes, you mask the effect cosmic rays have.”
At least that’s what it appears to be, since others have no trouble finding what you seem to miss.
“For cosmic ray theory to be viable, it must control the tropics, Nino34, but how can it do that when galactic radiation doesn’t reach that far?” – Bob Weber
You’ll have to ask the head of OULU. He finds cloud dependence on cosmic rays.
http://cc.oulu.fi/~usoskin/personal/2004GL0195072.pdf
While he finds more of an effect at higher latitudes, there is still a measurable effect in the tropics, even with lower cosmic ray intensity there.
Others find an influence on clouds, as well.
https://notrickszone.com/2018/09/27/new-paper-the-gcr-cloud-link-to-solar-driven-climate-change-persists-despite-the-post-2000-violation/
While the changes in cloud cover may still have to be better correlated with climate, there is plenty of evidence that cosmic rays measurably influence cloud production. The evidence I’ve seen for that is much stronger than what you have provided to the contrary.
———————————-
Comparing Usoskin to Michael Mann? Really? You’re correct that Mann says things all the time, but unlike Mann Usoskin has much more reliable publications to back himself up, his own and others.
The IPCC model of the climate is certainly an example of the fallacy of the single cause.
Forty years maximum of reliable Earth observations is hardly enough to come to any definitive climate conclusions.
Climate scientists would be better employed diligently and objectively collecting and organising data rather than looking for data that confirm a priori assumptions.
Hypotheses can be left to future generations, maybe in two hundred years.
Yeah, Chris. Lets all just be data collecting drone techs, and let future scientists get the credit for figuring out what it all means. funny. not. And how, without hypotheses, would we even know what data to collect?
You’re obviously not a scientist, or at least not one with any self esteem, anyway.
We have lots of data already, if we know where to look.
http://www.sciencebits.com/CosmicRaysClimate
Let the future scientists worry about what we might have gotten wrong, if anything.
Or were you being sarcastic? Sometimes these days, it’s hard to tell…
https://assets.amuniversal.com/34df4760c0460137c01a005056a9545d
No, I wasn’t being sarcastic.
OK, then my initial complaint stands. No scientist worth his salt is going to be a drone, nor should he/she be. I repeat, collecting data without a working hypothesis is a waste of time and not at all scientific.
JKintheUSA , I too am sympathetic to the material presented on this blog, but for the same reasons you post, I have never bothered to read any of Kenneths’ posts.
Thank you for the constructive criticism. I have shortened this post and plan to heed the suggestion to err on the side of brevity in the future.
https://www.smhi.se/polopoly_fs/1.143989.1548428766!/image/allsack_1983-lastyear.jpg_gen/derivatives/Original_1256px/image/allsack_1983-lastyear.jpg
Clouds are out of fashion now-days.
It would help to provide DOI links to papers quoted. It makes it easier and faster to land on the right abstract page in the right journal. I’d point to PDFs only when the published paper is pay-walled and PDF is *legally* available from elsewhere.
Otherwise, thanks and thanks again for keeping an eye on what’s actually being published and letting us know.
[…] 55 New (2019) Scientific Papers Link Solar Activity To Climate Change […]
[…] by K. Richard, October 3, 2019 in NoTricksZone […]
[…] https://notrickszone.com/2019/10/03/55-new-2019-scientific-papers-link-solar-activity-to-climate-cha… […]
[…] https://notrickszone.com/2019/10/03/55-new-2019-scientific-papers-link-solar-activity-to-climate-cha… […]
[…] 55 New (2019) Scientific Papers Link Solar Activity To Climate Change […]
You may find this of interest; it’s possible confirmatory evidence of a GCR-climate link:
https://wimflyc.blogspot.com/2019/10/exploding-galaxies-and-climate-change.html
To all intents and purposes, according to research by Michael and Ronan Connolly summarised below, the greenhouse effect underlying climate modelling has been empirically refuted.
Rather than conceding it a role to play in global warming, I would suggest the basics of the greenhouse effect should be reviewed before the world is turned topsy turvy on the strength of a faulty theory from the 19th century.
“According to the greenhouse effect theory (see Pierrehumbert, 2011[11] for a concise summary), barometric temperature profiles are strongly influenced
by the presence of trace greenhouse gases (e.g., H2O CO2, O3 and CH4) in the atmosphere. Greenhouse gases are assumed to substantially increase the mean
temperature of the troposphere and decrease the mean temperature of the stratosphere. Specifically, the theory predicts that the greenhouse gases present in the atmosphere reduce the rate at which outgoing infra-red radiation leaves the Earth into space, i.e., the rate of infra-red cooling.
In the theory, the rate of infra-red cooling is believed to vary substantially throughout the atmosphere, with the rate at each location depending on a number of factors: the local concentration of the different greenhouse gases, the local temperature of the air, the atmospheric pressure, as well as the radiative flux passing through that location. The spectrum of the radiative flux at each location is also considered important – if a particular frequency of radiation has already been absorbed before reaching the air parcel, that frequency is said to be saturated, and is no longer available to be absorbed by greenhouse gases.
Figure 19 [see the link below, G.T.] shows a typical radiation model for a mid- latitude summer atmosphere, taken from the 1990 InterComparison of Radiation Codes in Climate Models (ICRCCM) dataset[12, 32, 33], which is based on the greenhouse effect theory.
It can be seen from the infra-red cooling model
of Figure 19 that the greenhouse effect theory predicts a strong influence from the greenhouse gases on the barometric temperature profile. Moreover, the
modelled net effect of the greenhouse gases on infra-red cooling varies substantially over the entire atmospheric profile.
However, when we analysed the barometric temperature profiles of the radiosondes in this paper, we were unable to detect any influence from greenhouse
gases. Instead, the profiles were very well described by the thermodynamic properties of the main atmospheric gases, i.e., N2 and O2, in a gravitational field.
[…O]ur results suggest that the magnitude of the greenhouse effect is very small, perhaps negligible. At any rate, its magnitude appears to be too small to be detected from the archived radiosonde data.”
The source: http://oprj.net/oprj-archive/atmospheric-science/19/oprj-article-atmospheric-science-19.pdf
Oct 9, 2019 “Climate Forcing” Made Easy
If you have an immediate need to find papers on a specific aspect of the climate, you can do an internet search for things such as “Solar forcing el nino” or “solar geomagnetic polar vortex jet stream” or “solar forcing sea surface temperature” – it’s that easy.
https://youtu.be/tul07hx8V8w