Though the media like to tell their audience that man-made climate change is leading to more extreme weather, the data don’t support it. In fact, one could easily argue that Japan’s climate is more agreeable today.
By Kirye in Tokyo
and Pierre Gosselin
No trend in long-term annual precipitation
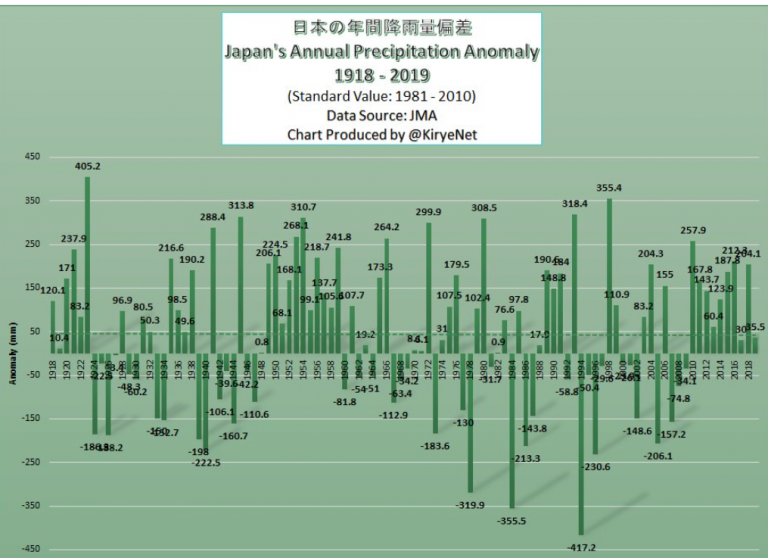
Over the past 100 years, for example, annual precipitation has not trended in an particular direction over the long term, showing rather some cyclical attributes:
Data source: Japan Meteorological Agency (JMA).
If anything, precipitation has been rather steady for the better part of the past 2 decades, and even resembles what was observed about 60 years ago, in the 1950s.
Note how the extremes in precipitation occurred in the 1970s and 1980s when most of the climate talk was about global cooling. But overall, there’s been no trend change in precipitation in Japan.
Typhoons trending downward modestly!
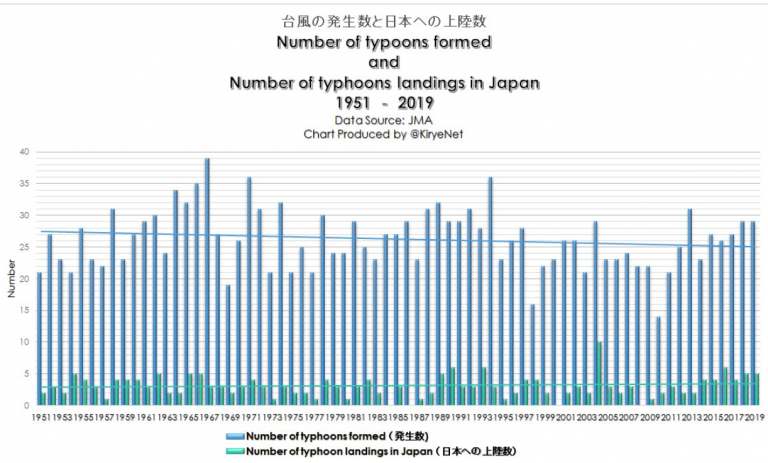
Typhoons forming, and those striking Japan, also show no worsening, as is otherwise often claimed by climate alarmists. What follows is a plot of typhoon landfalls for Japan and typhoons formed, since 1951:
The data suggest the number of typhoons forming and those striking Japan have declined modestly over the past 70 years, which is in line with the trends for global tropical storms. So there’s nothing alarming happening.
Japan sea level rise “no long-term trend”
Also nothing dramatic is happening with regards to Japan and sea level rise. This is the official conclusion of the JMA! Their site states:
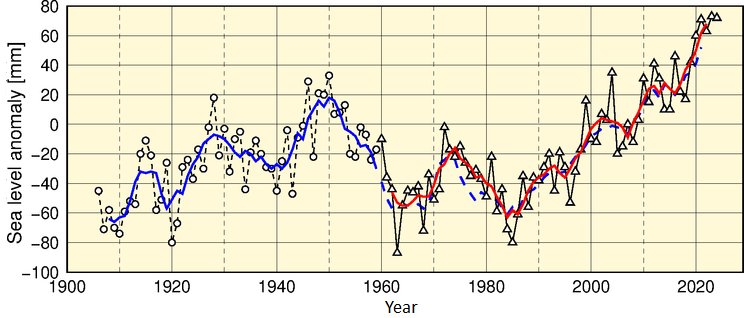
A trend of sea level rise has been observed in Japanese coastal areas since the 1980s, but no long-term trend of rise is seen for the period from 1906 to 2018. Variations with 10- to 20-year periods (near-10-year variations) are seen for the period from 1906 to 2018.
Time-series representation of annual mean sea level values (1906 – 2018)
The 1981 – 2010 average is used as the normal.
Annual sea level anomaly time series (comma-separated value file: 3 KB)The graph indicates annual mean sea level anomalies for each year averaged among the four tide gauge stations shown in the map on the left below for the period from 1906 to 1959, and among the four regions shown in the map on the right below for the period from 1960 onward. The solid blue line represents the five-year running mean of annual sea level anomalies averaged among the four stations, while the solid red line represents the corresponding value for the four regions. The dashed blue line represents the value at the four stations for the same period shown by the solid red line (from 1960 onward) for reference.”
Japan annual temps steady 80 years, before peculiar 1990 jump
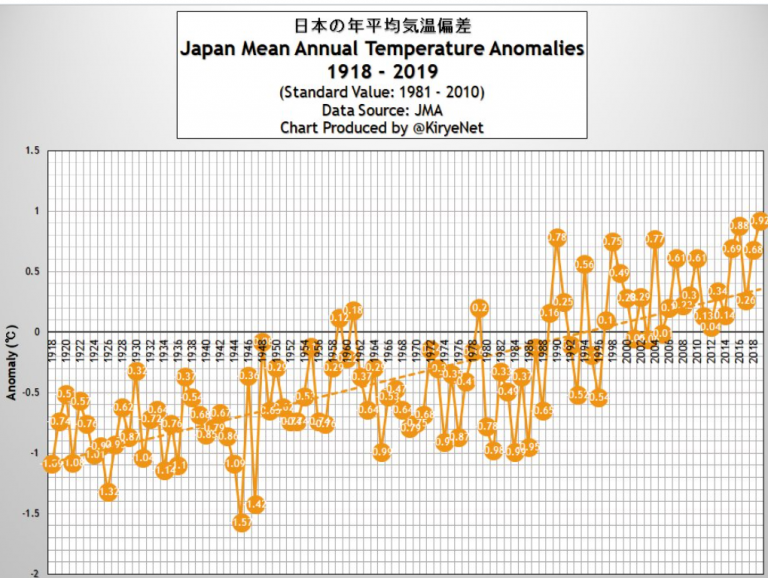
Finally, we look at Japan’s mean annual temperature trend over the past 100 years. Though we see an overall rise – it had remained more or less steady for some 80 years, from 1918 to 1990. But suddenly in 1990, the mean temperature jumped to new plateau.
Data source: JMA.
Perhaps this may have in part been due to a change over to electronic measurement systems and urban heat island effect, along with station siting. One thing can be ruled out: Any CO2 effect would not act so instantaneously.
Japan’s climate has not really worsened
Overall in terms of weather extremes, cold and storms, things in Japan have not gotten worse. In fact one could easily argue things have tamed just a bit.


Very interesting. Thanks.
~~~~~maybe related
Pattern in the North-Eastern Pacific impacting the NH (think B.C., Wash., and Oregon) just changed.
Cold and snow imminent.
[…] Kirye, January 9, 2020 in […]
[…] Read more at No Tricks Zone […]
[…] https://notrickszone.com/2020/01/09/despite-1990s-warming-japan-climate-has-become-more-agreeable-le… […]
[…] Despite 1990s Warming, Japan Climate Has Become More Agreeable, Less Extreme Over Past 100 Years! […]
[…] Despite 1990s Warming, Japan Climate Has Become More Agreeable, Less Extreme Over Past 100 Years! […]
Look at the CET-temepture jump in 1989
https://www.metoffice.gov.uk/hadobs/hadcet/