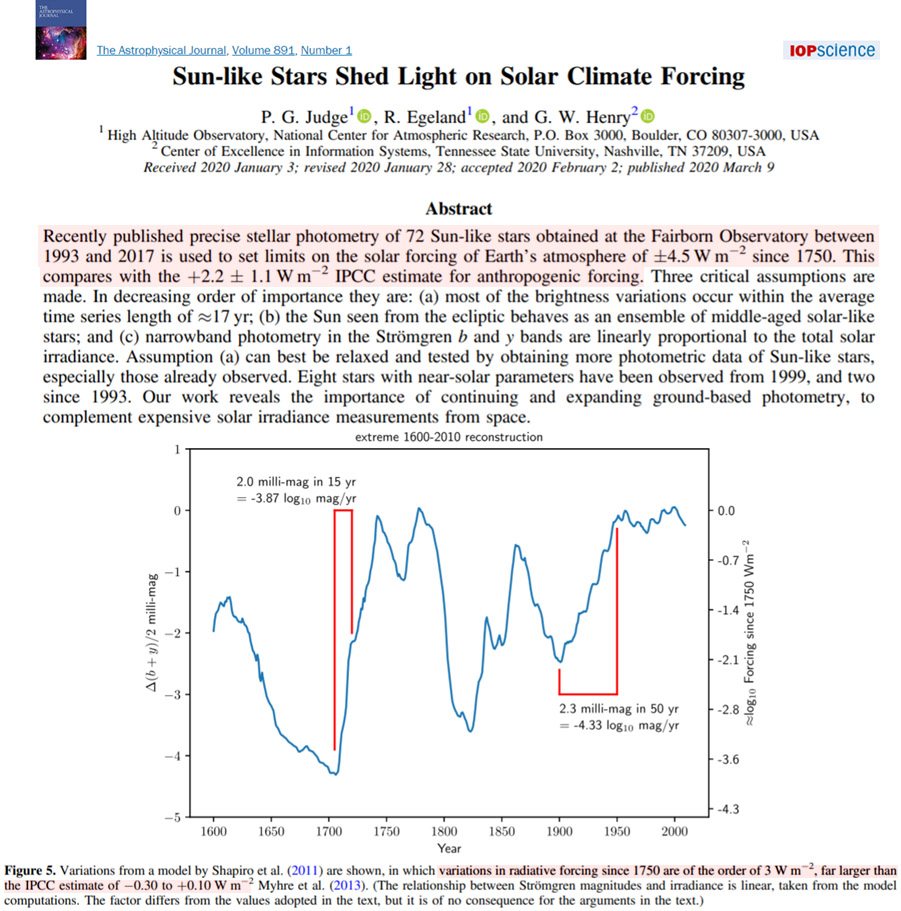
An observational analysis of photometric evidence suggests solar forcing of Earth’s atmosphere could vary by as much as ±4.5 W/m² since 1750, which is “far larger than the IPCC estimate of −0.30 to +0.10 W/m²” (Judge et al., 2020).
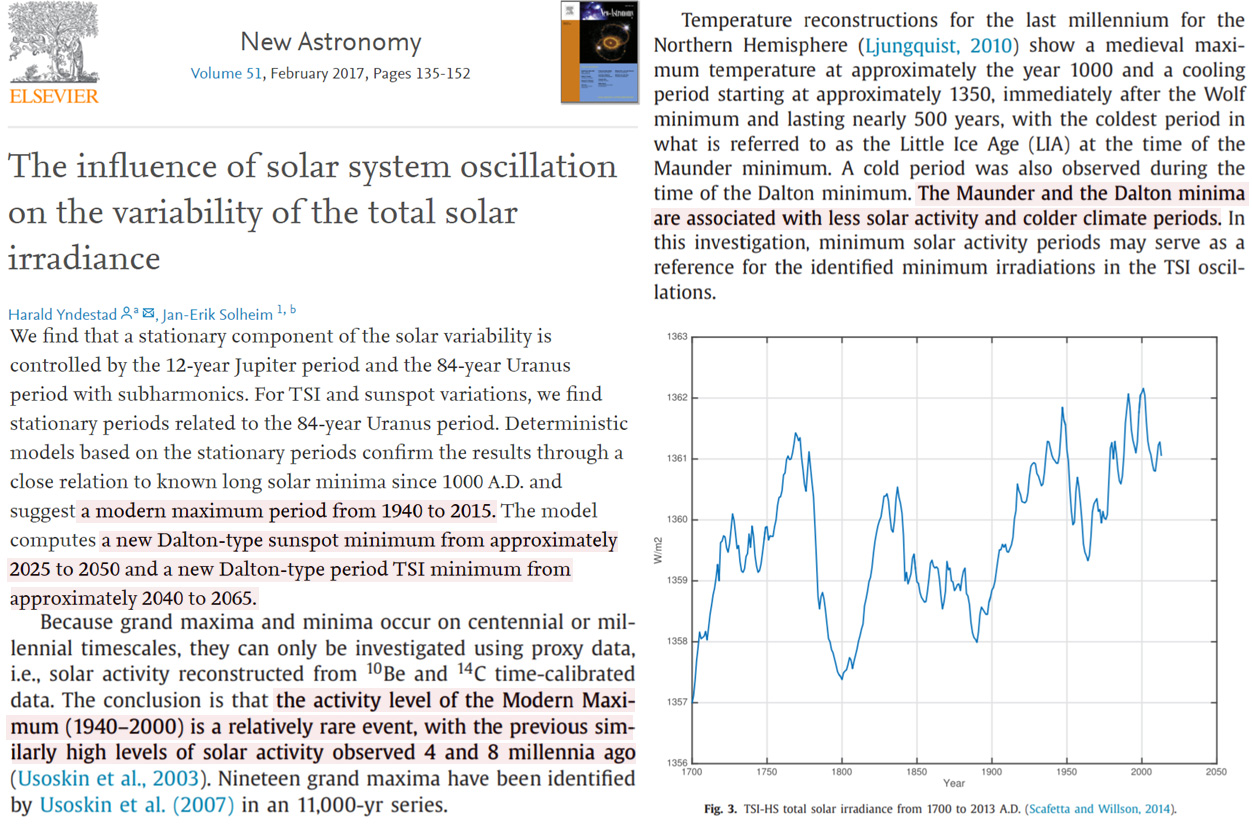
A 2017 study suggested the solar activity during the “modern maximum period from 1940 to 2015” is a “relatively rare event, with the previous similarly high levels of solar activity observed 4 and 8 millennia ago” (Yndestad and Solheim, 2017). Variations in solar activity since the 18th century were shown to have ranged between about 1357.5 W/m² and 1362 W/m² (~4.5 W/m²).
In contrast, the total radiative forcing due to the increase in the CO2 concentration since 1750 is suggested to be 1.82 W/m² (Feldman et al., 2015).

Image Source: Yndestad and Solheim, 2017
A new study (Judge et al., 2020) also affirms our highly uncertain estimations of solar forcing variations since 1750 may be “of the order of 3 W/m², far larger than the IPCC estimate of −0.30 to +0.10 W/m²” and also greater than the uncertain IPCC estimates of total anthropogenic forcing (+2.2 ± 1.1 W/m²) since 1750.
Large estimate ranges for solar forcing variability should reduce the certainty that Earth’s radiative forcing has been dominated by anthropogenic activity in recent centuries.


https://www.youtube.com/watch?v=rEWoPzaDmOA&list=PLHSoxioQtwZdP64kv7PmAJbadWEpcH6B1&index=2&t=0s
The sun also sends particles our way. solar wind, CMEs etc
[…] über New Study: Solar Forcing Estimates Since 1750 Could Be Much Larger Than Estimates Of Anthropogenic F… […]
“Variations in solar activity since the 18th century were shown to have ranged between about 1357.5 W/m² and 1362 W/m² (±4.5 W/m²).”
The “(±4.5 W/m²)” should be +-2.25W/m2 or 4.5W/m2.
Keep up the good job, I’m visiting your site almost daily.
Solar small scale variations, like terrestrial weather and climate, are chaotic.
And chaotic processes are often (always?) self organizing pattern generators, it is what drives so many natural processes and it in the very center of life. Whether or not that we can see them depends on our individual perceptions and biases.
See https://www.youtube.com/watch?v=p_yOueFMe7c (1hour long video)
Small? The daily, output shown by the solar sats. Have a temperature variation on their graph of 10 to tune third, to 10 to the sixth. Depending on the stream speed the temperature varies wildly. In the two years I have watched it, the output goes from just below the four to almost the six. That’s oh wicked hot to ooh!
Yes small!
Not the large variations that you mention but the other smaller ones.
The small variations!
🙂
The sun’s output has to be divided by 4 as it’s night half the time and the earth is sphere not a disk.
So this 4.5W/M2 ends up really being only 1.1W/M2