NOTE: Sorry about putting up the wrong chart earlier. Now the correct chart for Iceland is up. I was in a rush today and so was a bit less than diligent. -PG (When the wife says be ready by 7 pm, she means it!)
======================================
By Kirye,
and P. Gosselin
Iceland is situated in the upper North Atlantic, which makes it ideal for observing climate patterns and changes in that region.
Some people say that today’s climate is being driven almost entirely by man-made CO2, a trace gas in the atmosphere. Others, however, insist that the system is far more complex and involves a vast array of interdependent factors. One of the major factors is oceanic cycles.
What follows is a chart of April mean temperatures from 3 stations in Iceland, plotted using the data from the Japan Meteorological Agency (JMA).
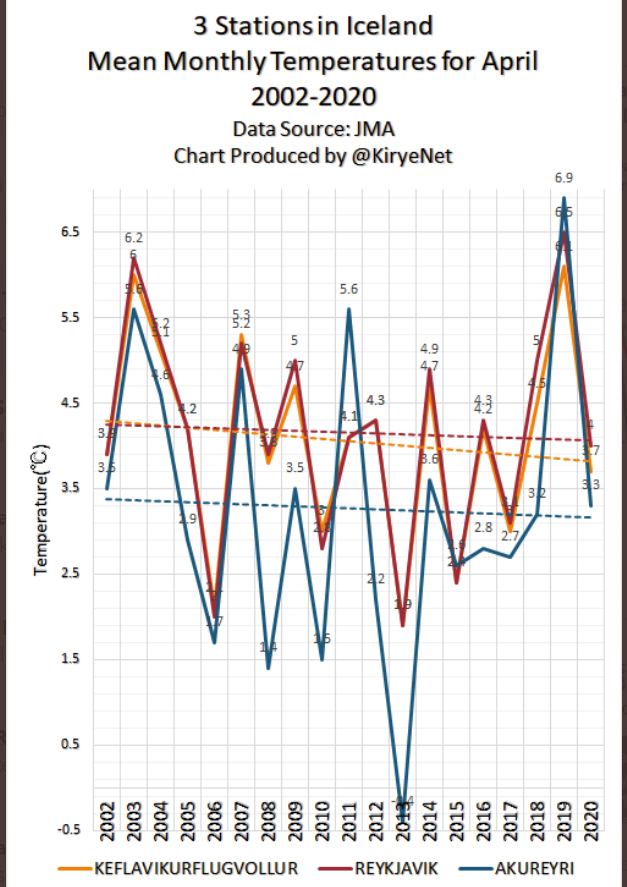
Data: JMA.
The results show there has been cooling in April since 2002. No warming to speak of. Spring is taking a little longer to arrive than it was 18 years ago.
Annual mean temps falling since 2002
But the mean temperatures for one single month like April are not enough to tell us if there is an overall warming or cooling trend for Iceland. Looking at the annual mean temperature plot using JMA data for three stations, we find the following trends:
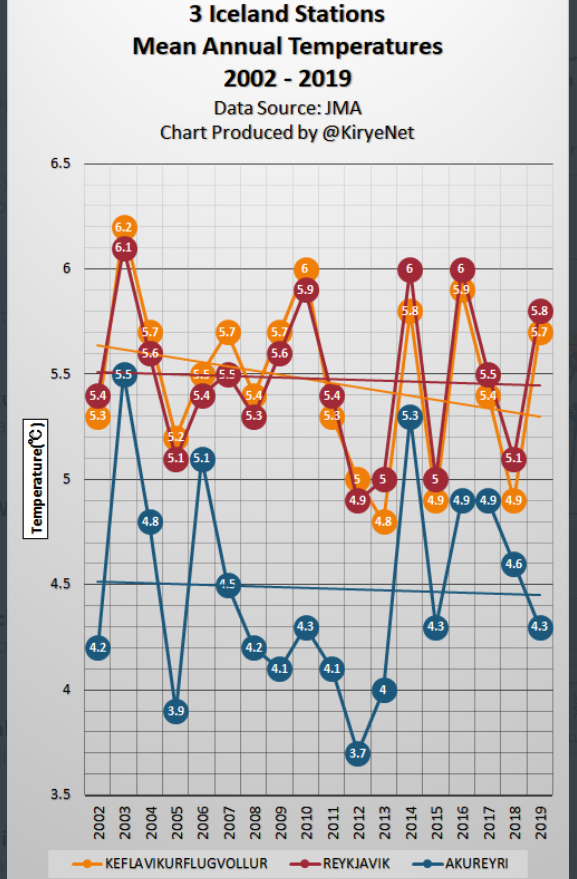
Iceland mean annual temperatures at three stations, since 2002. Data: JMA
The three stations plotted above show no warming at all, even though global temperatures are said to be warming due to CO2.
So why would Iceland be cooling? Obviously other natural factors are very much at work, like oceanic cycles. The story is similar at many locations worldwide. CO2 is not the main driver of the climate.


Ummm, the first plot shows Ireland stations, not Iceland!
Oh dear. Please check your work. Iceland and Ireland are both islands in the North Atlantic, but they are not the same.
The six stations in the first graph are in Ireland, not Iceland.
Ireland – Iceland????
Thanks – my bad! Now fixed. I had to work fast today, and of course we all know what that often leads to.
Not only was the old lady on my case being ready on time today, now I’m getting an earful from Kirye. 🙁
Iceland or Ireland – doesn’t matter. Don’t fuss about details and data. The oceanic cycles are driven by Man Made CO2. This I believe.
Relax.
Everyone knows Earth only has 11 years and a few months.
We are all going to drown or burst into flames.
Either of these is hard on digital things.
Cheers to all and thanks to P. G.
It would be interesting to know if the Tmin or the Tmax is player here.
Most places where it is said to have much warming usually it is Tmin that is rising, and not Tmax. No that it bother the MSM propagandists as they always play to the illusion that hot days are getting hotter, etc. In fact usually it is that nights are not as cool.