By Kirye
and Pierre Gosselin
Today we plot the Japan Meteorological Agency (JMA) data for Northern Europe for the month of August, 2020.
We have selected this region because it is the home of 17-year old climate alarmist/activist Greta Thunberg, who thinks the planet is heating up rapidly and so we’re all doomed.
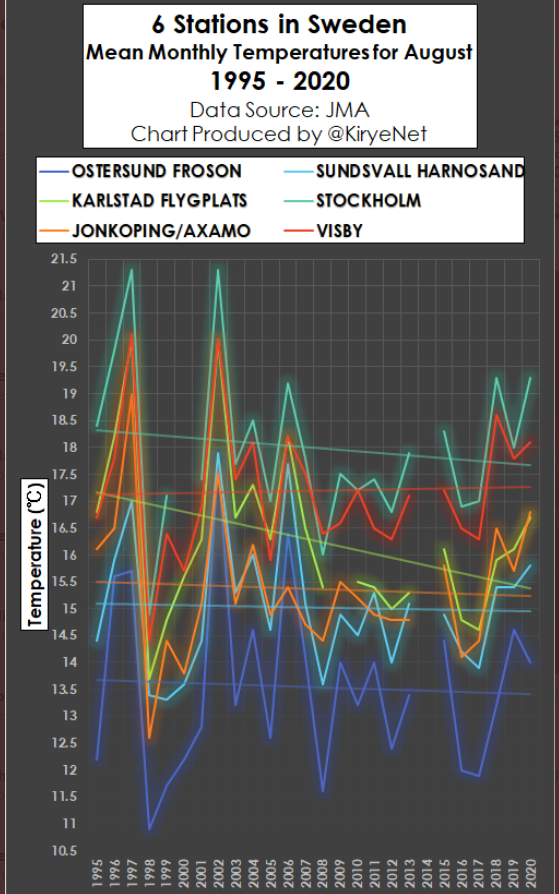
We plot the data for the stations for which the JMA has sufficient data going back over 2 decades. First we plot the August data for Sweden, Greta’s home country:
Data: JMA
Five of the 6 stations plotted show a cooling trend. So it’s a mystery how Greta thinks her country is warming up. The data suggest that summers have been shortening a bit. Over the course of Greta’s life, she has yet to see warming in August.
Next we examine Norway, Greta’s western neighbor:
Data: JMA
Here we see 6 of the 11 stations have seen an August cooling trend over the past quarter century. The colder stations have warmed somewhat, while the warmer ones have cooled. Overall, no warming to speak of, really.
The story is similar in Finland (further from the Atlantic), but here the colder stations have cooled, while the warmer stations have warmed slightly – but statistically insignificantly:
Data: JMA
Finally we plot the data for the emerald island, Ireland, next to the tempestuous Atlantic:
Data: JMA
Four of the six stations in Ireland have been cooling in August. Those warming have done so insignificantly. Overall the emerald island has been cooling during the month of August since 1983!


It would be of interest to see the locations of these stations plotted on maps. Are the warming stations clustered near each other? Are the cooling ones? Are they mixed? Are they near housing developments, businesses, industries, highways? Are they near bodies of water? What is the terrain like? Flat, hilly, mountainous? How has vegetation in the region changed over the past 25 years? How has development? Temperature trends are interesting, but asking related questions would give a better understanding of the situation.
I can only answer for Norway. Bjornøya (Bear Island, between Svalbard / Spitzbergen and Norway) and Jan Mayen (70 dgr north) are small islands in the Arctic sea, Svalbard AP is I guess the airport at Longyearbyen. Tromso (north Norway, pop. 70.000) is the airport, Bodo also north Norway pop. 50.000 (don’t know what VI means), Vardo is close to the Russian border in north Norway pop. 2500, Orland (Ørland) is in mid-Norway west of Trondheim, the main air force base. Bergen / Florida; Bergen is on the west coast, pop. 250.000, Florida is in the city centre, met. office. Oslo/Gardermoen is the main airport of Oslo, 50 km north of the city, rural area. Stavanger/Sola; Sola is th eairport of Stavanger, pop 300.000 (urban area of 4 communes), Oslo / Blindern is the site of the national meteorological office, and also the university campus. Very fun to see that the trend here is downwards, because the alarmist climate research centre (CICERO)is also located here 🙂 The university did not want them, but were forced to by political pressure. The locations are from ca 10 to 200 m above sea level, Jan Mayen, Bjornøya, Tromsø, Bodø, Ørland, Svalbard, Sola and Vardø very close to open sea.
Is there any indication that these stations have been relocated at in point in the past 25 years? There are some gaps in the histories which suggests that might have been the case.
[…] Greta Thunberg’s Scandinavia Has Seen August Cooling Trend Over The Past Quarter Century […]
Right in Gretas’s back yard. No need to get on a sail boat, Greta.