Highly anomalous terrain (an active volcano), 40 years of cooling temperatures, and a CO2 record that dramatically contrasts with fluctuating values from forests and meadows reaching 600-900 ppm all beg the question: Is Mauna Loa’s CO2 record globally representative?
Mauna Loa is the Earth’s largest land volcano. It has erupted over 3 dozen times since 1843, making this terrestrial landscape extremely unusual relative to the rest of the globe’s terrain. (Forests, in contrast, cover over 30% of the Earth’s land surface.)
Mauna Loa has been thought to be the world’s best location to monitor global CO2 levels since 1958.
While Mauna Loa CO2 levels show a rise of 338 ppm to 415 ppm since 1980, Mauna Loa temperatures (HCN) show a cooling trend during this same time period. The only warming period in the last 65 years occurred between about 1975 and 1985.
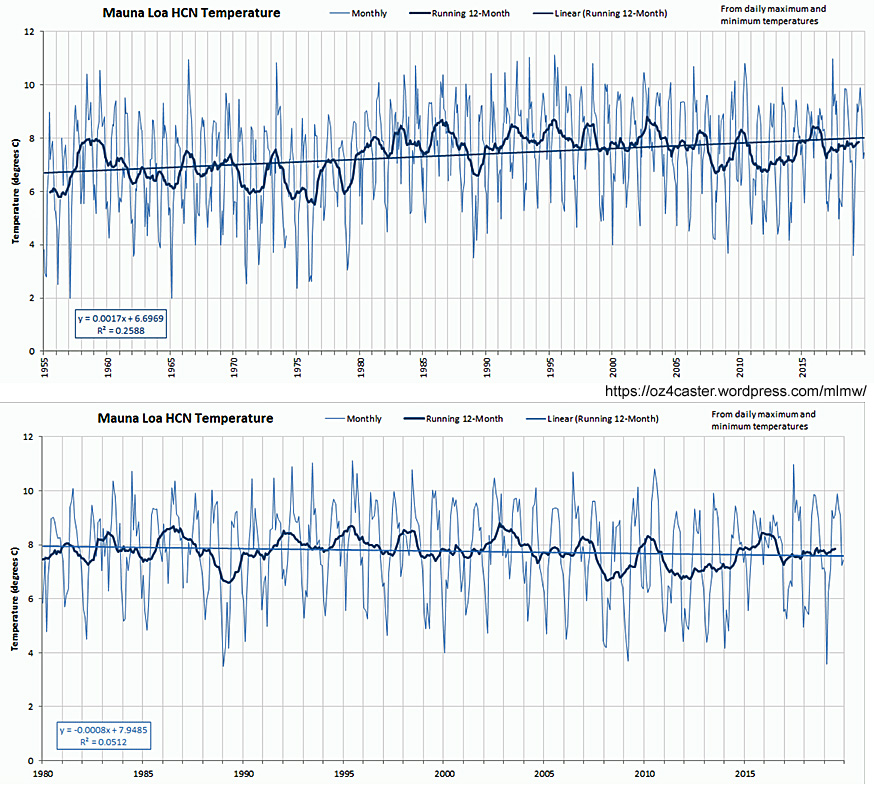
Image Source: oz4caster
Forest CO2 fluctuations
As mentioned above, forests are orders of magnitude more terrestrially representative than the highly anomalous site of the Earth’s largest volcano.
In forests or tree-covered areas, CO2 rises from around 300 ppm in the warmth of the afternoon (~3 p.m.) to over 600 ppm before sunrise (~4 a.m.), when it is cooler (Fennici, 1986, Hamacher et al., 1994). This massive fluctuation occurs daily and CO2 values average out to be far higher than the Mauna Loa record suggests.
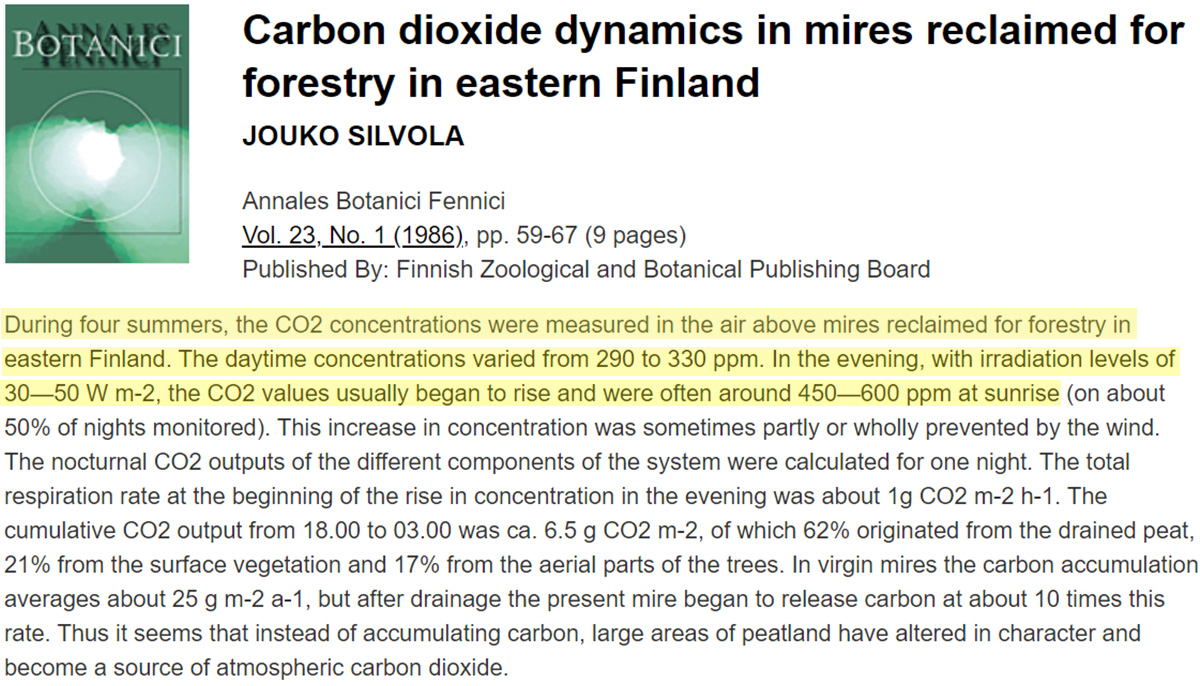
Image Source: Fennici, 1986
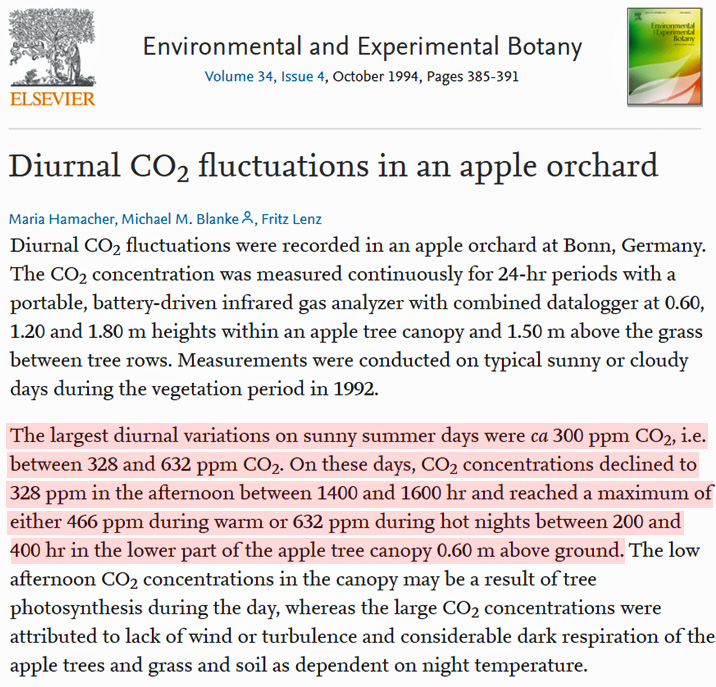
Image Source: Hamacher et al., 1994
Meadow CO2 fluctuations
In open fields, or meadows, air CO2 can vary between 266 ppm and 1,430 ppm. The average variance is from 280 ppm to 980 ppm 2 meters above the soil (Szaran et al., 2005).
Interestingly, just as in forests, temperature drops of 4 to 5°C are associated with rising levels of CO2.
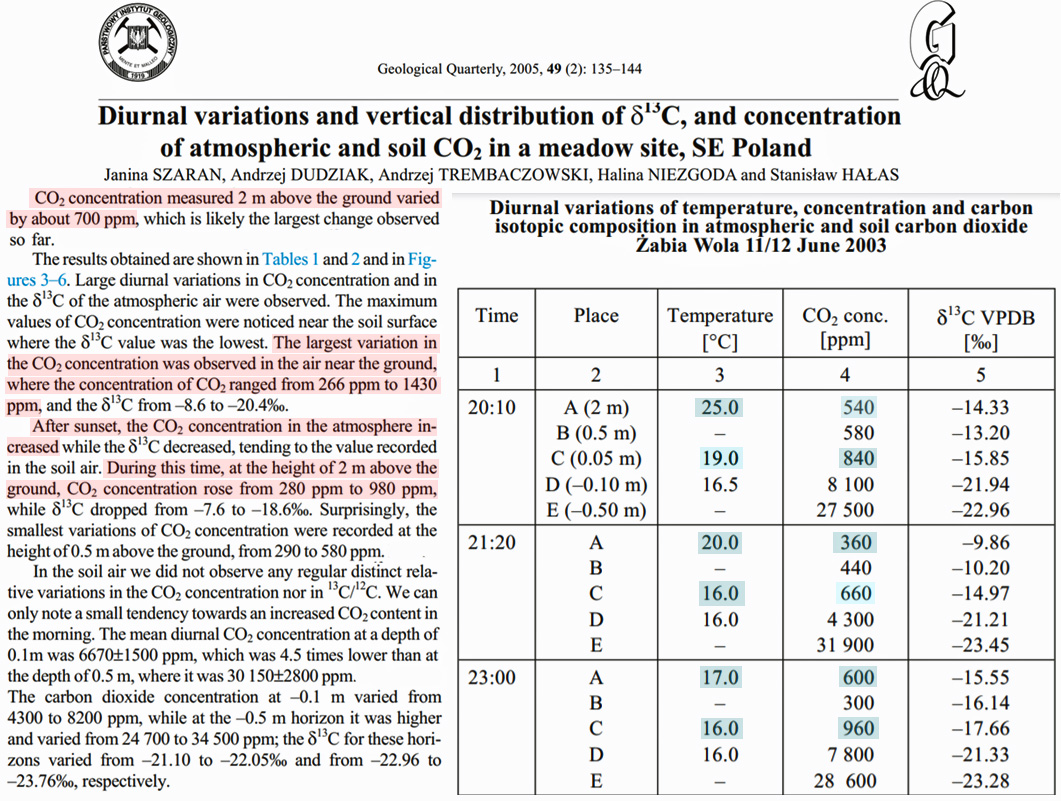
Image Source: Szaran et al., 2005
CO2 beneath snow and ice
Modern CO2 concentrations beneath snowpack and ice range from 600 to 1800 ppm. These concentrations can fluctuate by as much as 200 ppm within a period of just 4 days (Massman and Frank, 2006).
If this kind of rapid and wide-ranging variability can be observed for modern conditions, our capacity to accurately assess the “global” CO2 concentration for ice and snow thousands of years old becomes all the more suspect.
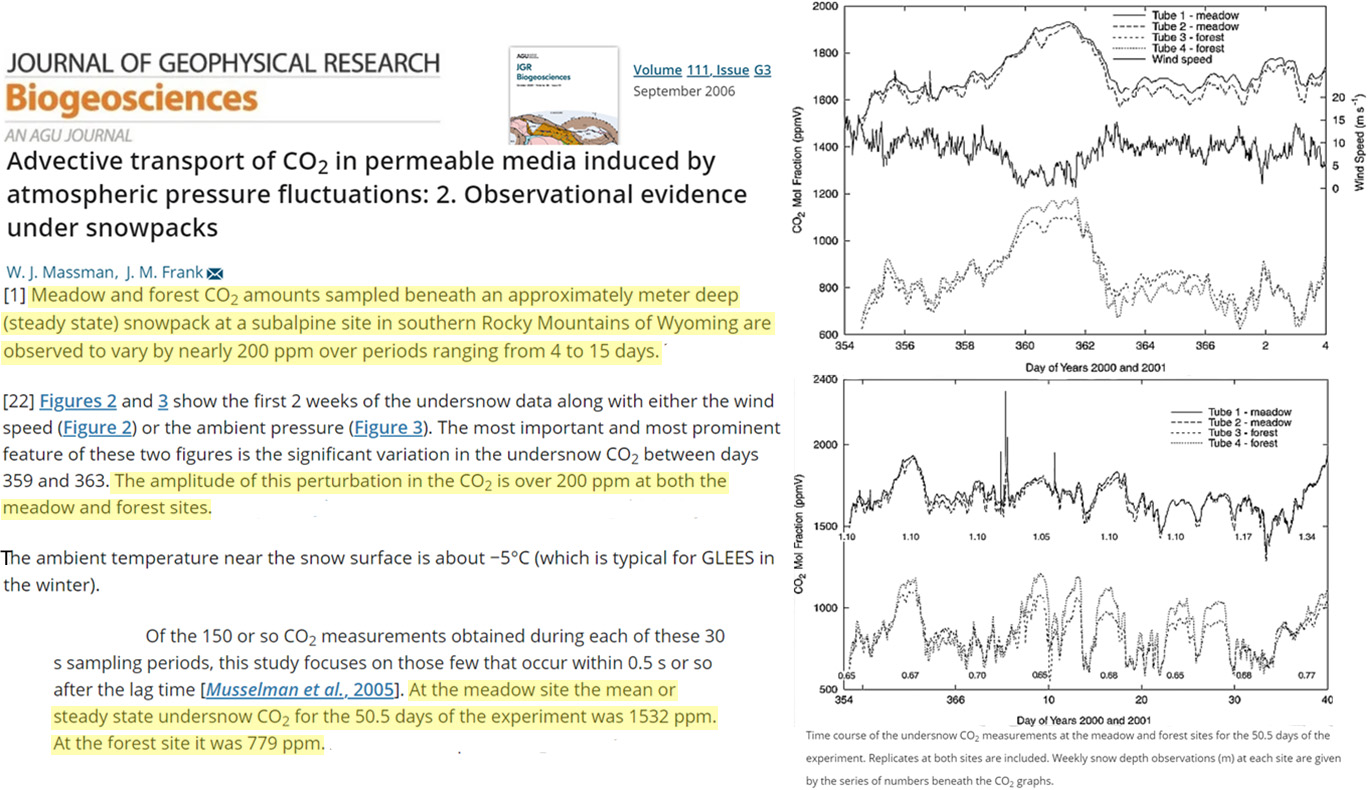
Image Source: Massman and Frank, 2006
CO2 near cave entrances
Within caves, CO2 levels can reach as high as 30,000 ppm. Even in the open air <1 meter from the entrance to a cave, CO2 levels can reach 11,500 ppm (Cowan et al., 2013).
CO2 levels vary by 10s of 1000s of ppm from one cave to the next in the same geographical region.
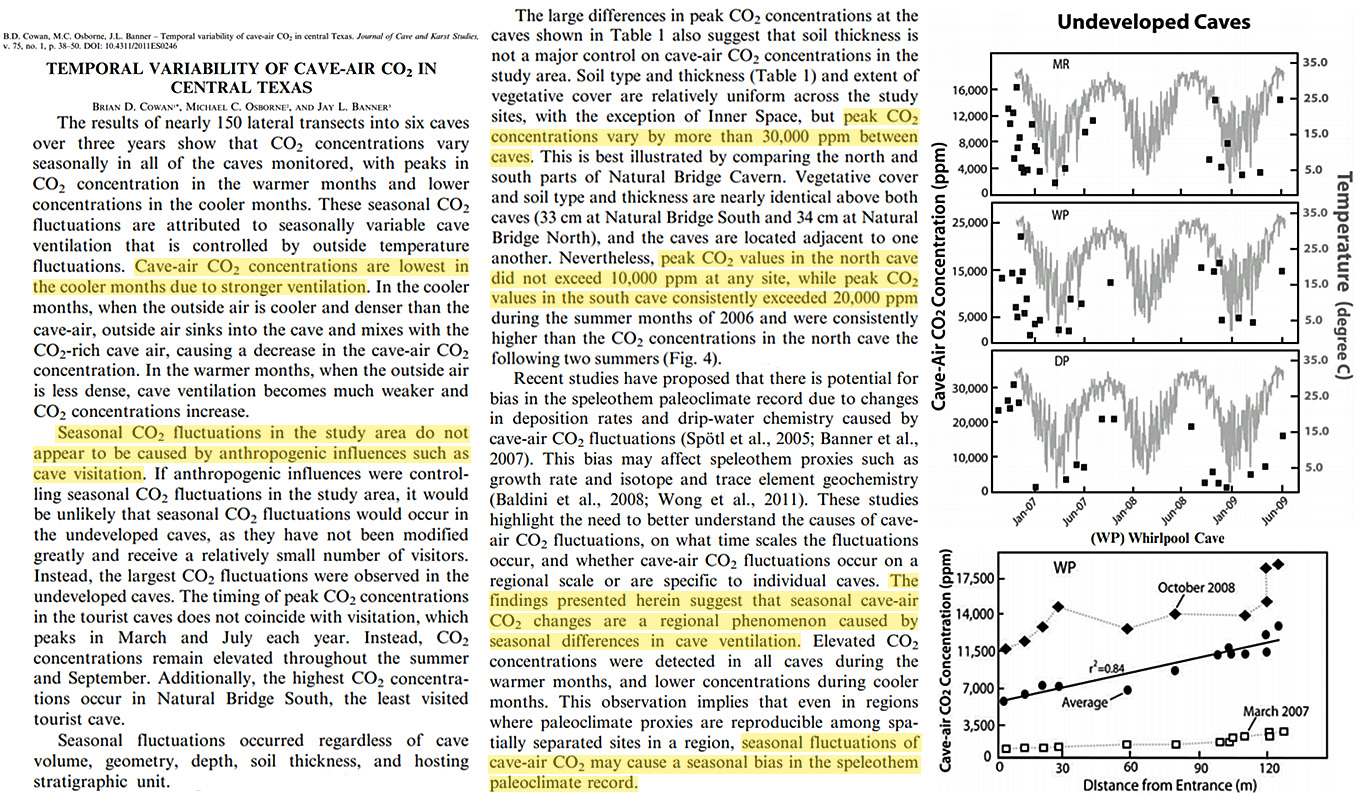
Image Source: Cowan et al., 2013
Mauna Loa CO2 is globally representative?
Cave entrances should probably be considered no less terrestrially unusual than the site of the world largest active volcano. And certainly forests and meadows are far more representative of the Earth’s terrestrial landscape than the Mauna Loa site.
And yet it has been decided, via consensus, that the rarified air above a Hawaiian island in the middle of the Pacific correctly monitors the CO2 levels for the entire globe.
Why?


Start here:
https://earthobservatory.nasa.gov/blogs/climateqa/mauna-loa-co2-record/
The Mauna Loa site is an excellent place to measure atmospheric CO2. Go to their explanation pages and learn what they do, and note that other places are in constant contact, with highly similar results. These sites are not attempting to measure CO2 in forests, meadows, caves, or apple orchards. Don’t put your bet on CO2 in a rapidly growing field of Maize!
I agree that Mauna Loa is well sited for the purpose of monitoring atmospheric CO2. One of the other sites chosen for this is Point Barrow, Alaska. In 1952 Hock et.al. published “Composition of Ground-level Atmosphere at Point Barrow, Alaska” which detailed the results of chemical gas analysis done on about 350 samples from 1947 to 1949 showed an average of .04% (400 PPM) with many readings as high as .06%. Many other chemical analyses in the 19th and early 20th century found concentrations much higher and more variable than the ice cores from Antarctica suggest.
This issue has been hashed over many times. The Mauna Loa setup was designed to overcome the many deficiencies in early measurements. It’s very disturbing to see people trying to discredit careful scientific observations. This is not about scoring points against your opponent or attacking him on every issue no matter how weak your position. This sort of activity turns the AGW controversy into a mere clash of prejudices.
What if they’re not representative of global CO2 levels? Would it matter if the observations are “careful” if they’re inaccurate?
Why is it disturbing to question the “consensus”?
“It’s very disturbing to see people trying to discredit careful scientific observations” – Javier
Same thought I have every time I see what NASA/NOAA Climate “Scientists” do when they “adjust” the temperature data that’s been acquired by careful systematic data collection. But, for some reason, warmists aren’t bothered by that.
I don’t question the CO2 data from Mauna Loa, as it applies to Mauna Loa. But to the world? …eh, it’s not so consistent.
ERRATA
In my last, it should have been: “It’s very disturbing to see people trying to discredit careful scientific observations” – rw
(misattribute to Javier)
Yep. Mauna Loa is an excellent location to measure global CO2 levels under the right conditions (the way it is done). And the measurements are confirmed by several stations placed at distant locations over the world.
This article is nonsense. There is nothing wrong with atmospheric CO2 measurements.
“There is nothing wrong with atmospheric CO2 measurements.”
How right are the pre-1950s records of CO2 since we divine those values from ancient ice bubbles?
Obviously we cannot place the same confidence on global CO2 levels prior to the establishment of Mauna Loa (ML) station.
CO2 measurements from ice bubbles are a proxy for atmospheric CO2 levels, and all proxies have issues. Nevertheless they are the best we have and in general terms confirmed by 13C levels. See for example figure 4 in:
Böhm, F., et al. “Evidence for preindustrial variations in the marine surface water carbonate system from coralline sponges.” Geochemistry, Geophysics, Geosystems 3.3 (2002): 1-13.
https://agupubs.onlinelibrary.wiley.com/doi/pdf/10.1029/2001GC000264
Ice CO2 levels have a much lower resolution than ML measurements due to the firning process, but until something better comes along that’s what we have.
Today’s measurements from snowpack/ice show that CO2 vary from 600 ppm to 1800 ppm and fluctuate by 200 ppm within a period of days. Since today’s data are entirely inconsistent with Mauna Loa, why would we assume 1000s of years old snow/ice is any more accurate than today’s inaccurate values from snow/ice?
Further, if Mauna Loa is the correct value for atmospheric CO2, why would would we assume that ANY other data from any other location prior to 1958 is accurate?
So if the best we have is wrong, what does it matter if it’s the best or worse?
“fossil fuel and soil have a similar δ13C value“
That’s a ridiculous idea.
http://www.ferdinand-engelbeen.be/klimaat/klim_img/antarctic_cores_001kyr_large.jpg
http://www.ferdinand-engelbeen.be/klimaat/klim_img/law_dome_sp_co2.jpg
There’s an overlap of about 20 years between Law Dome and Antarctic CO2 atmospheric measurements and they match.
To know that it is wrong you would need a better data that contradicts it. There is none. That’s why science advances with the best data available at the time, and that is why what we know today can be confirmed or refuted in the future.
Irrelevant for the purpose of this discussion. If the decrease in 13C matches the increase in CO2, IT CONFIRMS THE INCREASE. 13C says what we are seeing in Antarctic cores CO2 is quite correct.
I am surprised you go so against the evidence in this one.
My reply keeps getting lost.
“Since today’s data are entirely inconsistent with Mauna Loa”
That’s a ridiculous idea.
http://www.ferdinand-engelbeen.be/klimaat/klim_img/antarctic_cores_001kyr_large.jpg
http://www.ferdinand-engelbeen.be/klimaat/klim_img/law_dome_sp_co2.jpg
There’s an overlap of about 20 years between Law Dome and Antarctic CO2 atmospheric measurements and they match.
“So if the best we have is wrong, what does it matter if it’s the best or worse?”
To know that it is wrong you would need a better data that contradicts it. There is none. That’s why science advances with the best data available at the time, and that is why what we know today can be confirmed or refuted in the future.
“fossil fuel and soil have a similar δ13C value”
Irrelevant for the purpose of this discussion. If the decrease in 13C matches the increase in CO2, IT CONFIRMS THE INCREASE. 13C says what we are seeing in Antarctic cores CO2 is quite correct.
I am surprised you go so against the evidence in this one.
“Since today’s data are entirely inconsistent with Mauna Loa”
That’s a ridiculous idea.
There’s an overlap of about 20 years between Law Dome and Antarctic CO2 atmospheric measurements and they match.
“So if the best we have is wrong, what does it matter if it’s the best or worse?”
To know that it is wrong you would need a better data that contradicts it. There is none. That’s why science advances with the best data available at the time, and that is why what we know today can be confirmed or refuted in the future.
“fossil fuel and soil have a similar δ13C value”
Irrelevant for the purpose of this discussion. If the decrease in 13C matches the increase in CO2, IT CONFIRMS THE INCREASE. 13C says what we are seeing in Antarctic cores CO2 is quite correct.
I am surprised you go so against the evidence in this one.
http://www.ferdinand-engelbeen.be/klimaat/klim_img/law_dome_sp_co2.jpg
See figure 3 at:
https://agupubs.onlinelibrary.wiley.com/doi/full/10.1002/jgrd.50668
Figure 3 shows the comparison of our new ice core data set with firn measurements from DE08‐2, DSSW20K and South Pole, and the Cape Grim atmospheric record.
This article extends it to 2000.
“CO2 measurements from ice bubbles are a proxy for atmospheric CO2 levels, and all proxies have issues.”
That’s an understatement – from Mr. “Javier”. Given the countless effects that have operated on the ice and air bubbles over thousands of years, the measured values are unlikely to be even the CO2 that was originally in the ice. With certainty, they’re not the CO2 that was in the ancient atmosphere.
Proxies of atmospheric CO2 before it was actually measured are little more than wishful thinking.
It produces me unending amusement that people that distrust ice core CO2 records then trust them enough to say that they demonstrate that temperature changes precede CO2 changes.
Is skepticism so selective?
“It produces me unending amusement that people that distrust ice core CO2 records then trust them enough to say that they demonstrate that temperature changes precede CO2 changes.” – Javier
The logic is, that since warmists accept the results of CO2 and Temperature proxies, it is warmists who have to explain why CO2 rise/fall follows Temp rise/fall, implying that [CO2], by warmists’ own interpretation of the data, is not the driver of temperature.
Skeptics aren’t the ones being inconsistent here.
CO2 from ice bubbles are only reported from Antarctic ice cores. CO2 data from Greenland ice cores were dismissed because they disagree with Antarctic ice core CO2 data and are theorized to be altered by chemical reactions. Interestingly, Antarctic CO2 parallels Antarctic temperatures and are out of phase with Greenland temperatures.
https://i.imgur.com/qsgV2iF.jpg
Yes, we already discussed this, Renee. CO2 is global. The disparity between Greenland and Antarctic cores had to be due to an artifact. The artifact was found. Antarctic cores agree with atmospheric measurements.
The main source of CO2 before human emissions was temperature-dependent Southern Ocean outgassing. It is hardly surprising that it parallels Antarctic temperatures.
Why would question the Status Quo be nonsense?
Anything you say Javier (is this really Ferdinand himself) can be questioned, because this is how science works.
Here is a study from 2011
https://cp.copernicus.org/articles/7/975/2011/cp-7-975-2011.pdf
It deviates from the above quoted study.
Here is another study
https://www.soest.hawaii.edu/oceanography/masters/2017-Terlouw.pdf
Very interesting if you get to read through to the conclusion.
“Identifying an ocean acidification trend is much more difficult on coral reefs compared to the
open ocean, owing to the large natural pCO2sw variability in these ecosystems. The anticipated ocean
acidification trend of ~ 2 µatm yr-1
is overshadowed by inter-annual pCO2sw trends that are affected by
SST and wind speed variations.”
which is in stark contrast to the opinionated last sentence
“Projected increases in SST as well as decreased trade wind speeds as a
result of climate change might be a more important driver of the inter-annual pCO2 trend on Hawaiian
reefs than Ocean Acidification, at least within the next decade. “
Javier seems is really Roger J. Francey.
I’d prefer more than one station to measure CO2 content of the atmosphere to conclude on global changes.
More so since NASA shows maps where the CO2 content changes locally and regionally and even more so since CO2 is not evenly distributed in the atmospheric layers.
[…] Ist Mauna Loa wirklich der beste Ort um globale CO2-Werte zu messen? […]
and yet we all exhale 40,000 ppm Co2 in our breath and willingly trap a vast amount of it in our WHO mandated dog muzzles (sorry – masks) and happily re breath it to comply with the Marxists dicktats.
Strange that.
Seems the biggest issue with using Mauna Loa is what are they measuring? Changes in CO2 from “man’s” use of fossil fuels, cement, agriculture … or the flux of CO2 with the Pacific Ocean.
Obviously both, but it does make one wonder … maybe a couple of sister sites in the Easter USA and near Lake Baikal differenced with ML data could turn up something interesting.
[…] This article blows the consensus on this issue. You will see that in practice there is no one measurement and so it is impossible to give an accurate average. […]
What about the CO2 from the volcano?!?! You have a gauge sitting on top of a fountain of CO2
JW:
I hear that they discard around 85% of the readings and keep only those that look good.
Yes, they discard the CO2 values they think are wrong, and keep the ones they think are right.
Notice ice cores show CO2 values reached 700-2500 ppm during the Holocene.
<a href="Additionally…
And, more recently…
https://notrickszone.com/2019/03/25/satellite-evidence-affirms-solar-activity-drove-a-significant-percentage-of-recent-warming/#comment-1299764
[…] Is Mauna Loa Really The Best Location To Measure ‘Global’ CO2 Levels? […]
How about this article
Kreutz, 1941(?); Kohlensäuregehalt der unteren Luftschichten in Abhängigkeit von Witterungsfaktoren. (aus den Agrarmeteteorologischen Forschungsstelle Gießen des Reichsamts für Wetterdienst) Angewandte Botanik, XXIII pp 89-116
More tests and more accurate than Mauna Loa with actual results available obtained by Beck
[…] Is Mauna Loa Really The Best Location To Measure ‘Global’ CO2 Levels? […]
“Carbon Dioxide and People” A study published in 1987 showed the almost perfect correlation between Mauna Loa CO2 and global population (the sum total of human activities). That correlation remains high today.
Abstract: “For at least a quarter of a century the steady increase of carbon dioxide in the atmosphere has closely paralleled the growth of world human population with an amazing correlation of .9985. This nearly perfect correlation can hardly be fortuitous. It suggests that the rate of increase of CO2 is almost wholly dependent on human activities with only very minor contributions from natural causes such as volcanoes, the melting of glaciers, and changes in oceanic circulation. It is generally agreed by ecologists that rates of human activities, such as the consumption of fossil fuels and the destruction of forests, are also increasing. No matter how complex the relationship may be, the fact remains that CO2 and the population explosion are almost precisely correlated. We suggest that mean values of atmospheric CO2 taken at frequent intervals should usefully supplement, or even replace, inaccurate census compilations for estimating the global growth of human population and some of its consequences: increasing industrialization, burning of fuels, urbanization, changes in land management, etc. It appears that population growth has now exceeded the capacity of the earth to provide a reasonable quality existence for every individual. Our statistical result appears to be new. People looking at population changes should find the study of these data useful.”
“We suggest that mean values of atmospheric CO2 taken at frequent intervals should usefully supplement, or even replace, inaccurate census compilations for estimating the global growth of human population and some of its consequences…”
Broadlands, that’s a good one, hadn’t heard that before. What makes you think people haven’t learned something since 1987?
The question should’ve been ‘What makes Mauna Loa the best place to measure CO2?’, to which the answer is extremely revealing: proximity to the Nino regions, specifically Nino3. Why?
Henry’s Law of CO2 Solubility can be derived from the region’s data to obtain a CO2 outgassing temperature threshold that when applied to ocean data explains ML CO2 growth much better than MME (a spurious correlation).
The annual change in ML CO2 is driven by the annual insolation cycle warming effect on Nino3, and the trend in CO2 is established by the area of the ocean ≥25.6°C over time. The annual change in ML CO2 lags the annual change in ocean area ≥25.6°C by 5 months, ie CO2 doesn’t provide any feedback to ocean temperature.
As the ratio of the warm area to cold area defined at 25.6°C increases, cold area CO2 sinking decreases. The ocean area ≥25.6°C increased by ~50% since 1909, from 43% to 66%, while the average temperature of that area also increased, driving more outgassing and less sinking, causing atmospheric accumulation.
The application of the outgassing threshold to the changing warm/cold area ratio over time reveals the ocean surface acts like a temperature-controlled CO2 valve that sets the ML CO2 annual cycle, level, and trend – completely overwhelming MME.
https://i.postimg.cc/HnRtZKPP/Annual-CO2-Cycle-driven-by-Sun-and-Ocean.jpg
https://i.postimg.cc/m2pBSVdK/Nino3-4-and-Henry-s-Law.jpg
https://i.postimg.cc/P57YxCQP/ML-CO2-is-driven-by-Outgassing.jpg
The current outgassing boundary is just within the green area:
https://coralreefwatch.noaa.gov/data/5km/v3.1/current/daily/gif/cur_coraltemp5km_sst_large.gif
Law Dome CO2 also correlates with the southern ocean temperature:
https://i.postimg.cc/kMhLCggw/Ocean-Temperature-Profile.jpg
All the locations where CO2 is measured are good places for it, we just have to understand why and the limitations of the data. Mauna Loa is an ideal place for fleshing out natural outgassing as I demonstrated.
Human population grew among other reasons (coal/oil/gas energy and industrialization) because naturally outgassed CO2 (& CO2 from MME) produced more greening and higher crop yields.
https://i.postimg.cc/pX0xc9TZ/LASP-2020-Figs-51-and-52.jpg
It can go the other way too – CO2 was repeatedly drawn down to minimal levels for thousands of years by a colder ocean during ice ages.