By Kirye
and Pierre Gosselin
Today we look at the NASA temperature data from Ireland and compare the GHCN Version unadjusted to the plots of the GHCN Version 4 adjusted and homogenized.
Here’s how they compare:
Data: NASA GISS
Greece is another example
What follows next are side-by-side plots of two stations: V4 unadjusted and V4 adjusted-homogenized:
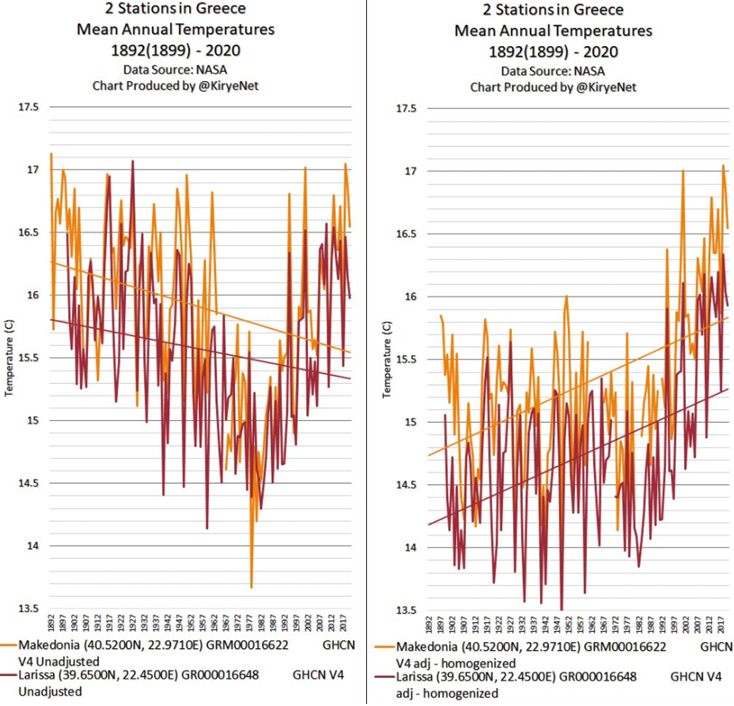
Data: NASA GISS
The two GHCN V4 unadjusted mean annual temperature data plots of the respective stations clearly show a cooling trend.
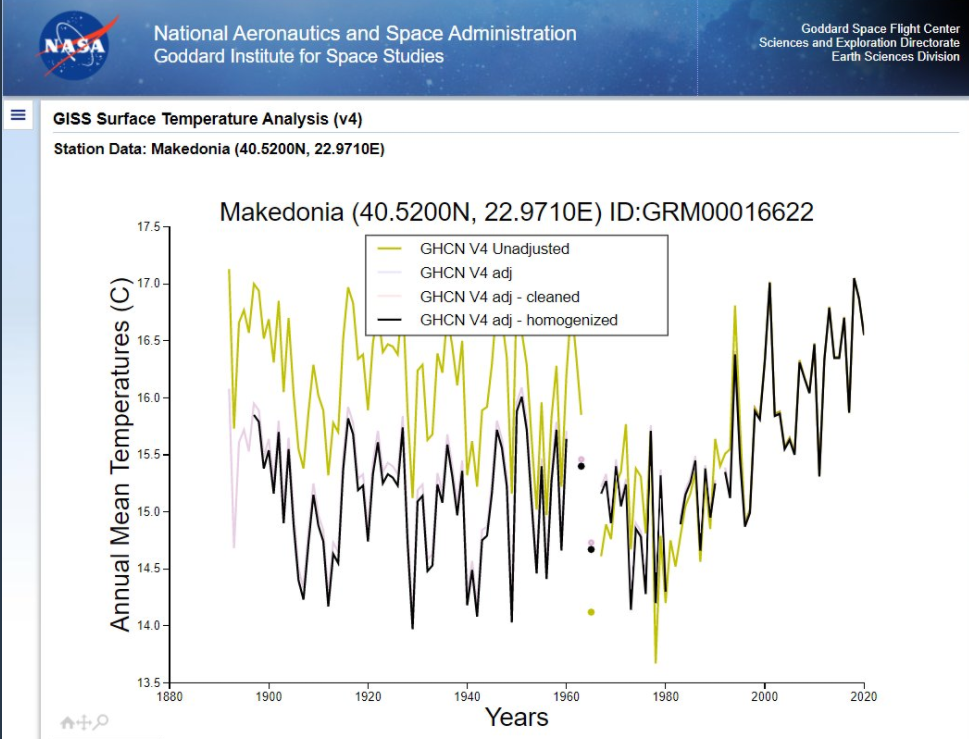
But then NASA altered the data for the two Greek stations and named the two new data sets “V4 adjusted-homogenized”.
Once again the adjustments produce warming. Every time the alterations lead to warming.
Makedonia:
Crisis fabrication
Recently one young British chap said it seems to be all about creating states of emergency in order to skirt the rules of law (click on video):
https://twitter.com/MKlarname/status/1429845991700697089
A state of emergency lets a government skirt the law. So if you want to skirt the law, then just create a state of emergency. With the climate emergency, this is easily done simply by rewriting the data.


“Once again the adjustments produce warming. Every time the alterations lead to warming”.
From time to time I have looked at various long-term station data on the NASA website and almost invariably the adjustments have converted falling or no trend to a rising trend.
The so-called ‘Covid crisis’ has brought into sharp focus what unopposed state power can and will do given a pretext , it’s the ‘nature of the beast’.
Keep up the good work, NASA. We need a warmer world.
If I had to deal with so much data I did not believe in as does the Climate Cult, I’d get spasms of the pyloric cylinder.
I wondered if those stations in Ireland had been chosen because they were the only ones that showed the change in trend so checked, and that’s all the stations in Ireland.
What is even meant by a graph of “mean annual temperature”? What is NASA fabricating – I mean measuring? It would appear to imply the average recorded temperature, 24 hours a day, 365 days per year. That begs the question of how many measurements per day, and whether or not they are evenly distributed in the 24 hour period. It surely cannot be (daily max + daily min) / 2. To have any meaning, the daily readings must be evenly distributed around the clock, and the mean calculated as the sum of the readings divided by the number of readings.
Even then, what does the “mean annual temperature” tell us? If the mean daily high temperatures at various times in the year are stable across the year range of the graph, but the mean overnight lows show in increasing trend, then the “mean annual temperature” will show an increase. That does not show that the daytime temperatures have been getting “hotter”, only that the overnight temperatures have been getting milder.
Looks to me like a more or less useless statistic on which to base a global panic.
I’ll second that. As I’ve said a few times before, a “temperature” is something that has meaning only at a three-dimensional point in space at a particular point in time; when you start “averaging” things, you’re deliberately (even if unknowingly) discarding much of the information content of the actual data.
Raw temperature measurements are all that should be used.
‘only that the overnight temperatures have been getting milder’ means it takes longer to cool at night from day temperatures.
AKA the Urban Heat Island Effect
There’s also the likelihood that that occurrence is due to their being more water vapor in the air due to long-term (centuries-long) ocean cycles being favorable for introducing more water vapor into the atmosphere at this time.
Most of the thermal behavior of “air” is due to water vapor (not that other tri-atomic molecule).
How can you put so much effort into one single task and still have nothing from it?
The climate snipe hunt never ends and must continue at all cost.
A colossal waste of time.
Wind speed, temperature, humidity, light is all that should matter at the macro level.
Water is the primary green house gas, not difficult to see why.
Although, molecules and elements do fill the void, rise to the occasion, lift the barge, tote the bale.
The most abundant element in rich soils is oxygen.
Carbon, nitrogen, potassium, phosphorus, sulfur, probably all 92 regenerative elements are present in soil. Can’t deplete the oxygen, always there, you can deplete the potassium and phosphorus.
Beans, alfalfa, clover will fix nitrogen into your soils, not a problem there. Pinto beans one year, barley the next, you’ll have a high yield of barley.
Photosynthesis is a natural phenomena, carbon dioxide is just there, whether it is of anthropogenic origin or not is not important. Was there in the beginning, probably replaced ten times over by now since hydrocarbon consumption began. All of the natural carbon dioxide in the atmosphere was replaced in the first hundred years of the Industrial Revolution.
Soil analysis is a good start into discovering what is there.
Those studies allow for the development of nutrient rich solutions used to grow lettuce in factory conditions, followed by planting of lettuce nascent shoots to grow in a field.
Lettuce is a crap shoot, deer and gophers will eat it all, once discovered.
You can plant lettuce sparingly in not so obvious places in the garden and achieve good results. Don’t ask me why, just what you observe. It is uncanny.
Didn’t rain for some 37 days, then an inch or so, then a week ago, there was a rainstorm that shed 4.8 inches of rain overnight. The heat wave gave way to cooler daytime temps and the heavy rainfall more of less ended the drought conditions.
The soybeans needed a serious break.
As do humans, remove the ridiculous mask that does no good at all and breathe, start living instead of being a good slave.
Governments have no power without the consent of the governed.
‘Go to hell’ tells it all in spades. The tyrants won’t stop until you make them stop, how it is in the real world. lol
Some rambling musings to date.
[…] A couple of days ago (August 24), Kirye had a post at NoTricksZone titled “Adjusting To Warm, NASA Data Alterations Change Cooling To Warming In Ireland, Greece.” […]
So Greece was nice and warm during the 1880-1890’s centennial solar minimum, you can bet that the Mediterranean was warmer then too.
[…] A couple of days ago (August 24), Kirye had a post at NoTricksZone titled “Adjusting To Warm, NASA Data Alterations Change Cooling To Warming In Ireland, Greece.” […]
[…] Adjusting To Warm, NASA Data Alterations Change Cooling To Warming In Ireland, Greece […]
[…] at the NoTricksZone site. A couple of days ago (August 24) Kirye had a post at NoTricksZone titled “Adjusting To Warm, NASA Data Alterations Change Cooling To Warming In Ireland, Greece.” Adding to Heller’s work, this post goes outside the U.S. to look at two European countries that […]
[…] Adjusting To Warm, NASA Data Alterations Change Cooling To Warming In Ireland, Greece […]