Data from the Danish Polar Portal shows Greenland ice melt slowing significantly over past 10 years. Increasingly rapid mass loss is a myth.
German climate site Die kalte Sonne here looks at whether Greenland is really melting faster or not in its 78th climate and energy video (3rd segment).
Satellite measurement has allowed accurate measurements over the years and so reliable trends are detectable.
Greenland has added mass since July
Over the past year, since September 2020, Greenland has seen a number of heavy snowfalls, as depicted by the solid blue line in the chart by the Danish polarportal.dk:
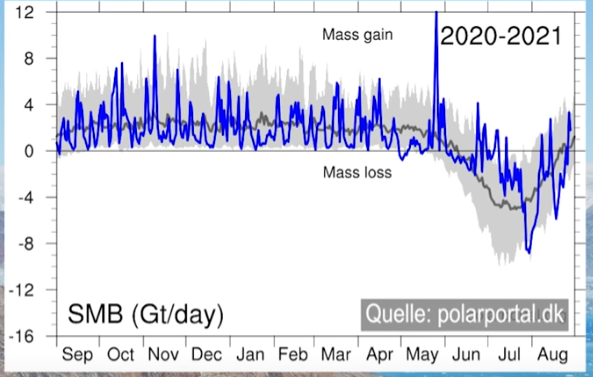
Image cropped: Die kalte Sonne.
When looking at the net gain or loss in billions of tonnes, we see a net gain since July (blue curve):
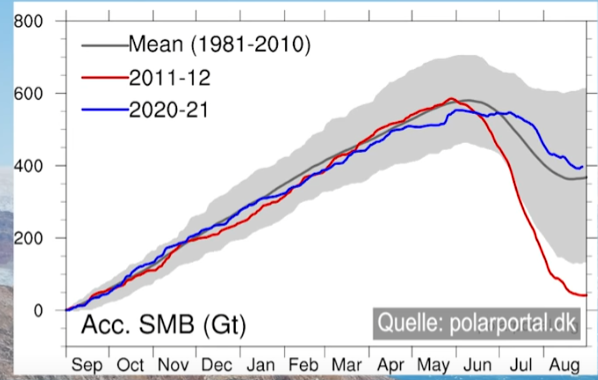
Image cropped: Die kalte Sonne.
The last months stand in stark contrast compared to the large net loss seen in 2012, depicted by the red curve.
Despite the recent 30 billion tonnes of net gain beginning in July, that didn’t stop media outlets like Der Spiegel from announcing doomsday warnings of runaway ice melt.
Greenland mass loss rate has declined significantly
Another important aspect of Greenland ice mass change are the data measurements of the ice edge and calving rates, in addition to the surface mass variations. Each year the Danish Polar Portal reports the sum both of these factors. “This determines whether Greenland ice is growing or shrinking,” says Die kalte Sonne.
The following chart plots the total mass balance changes since 1985:
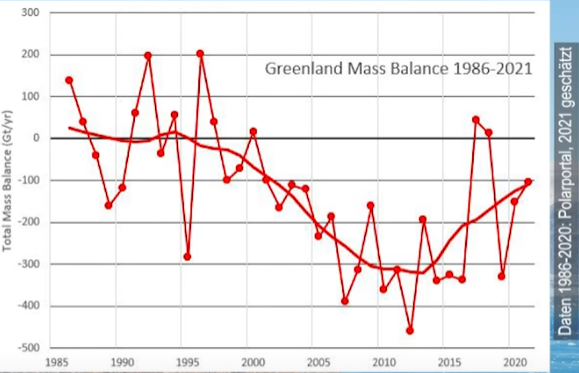
Image cropped: Die kalte Sonne.
Greenland ice mass change bottomed out in 2012, and has been seeing less and less loss for 15 years. Each year mass loss has been declining.
Currently Greenland mass balance change is at levels seen in 2000. The days of rapid mass loss are behind us, at least for now. The year 2021 is expected to come in at -100 gigatonnes. In 2017 and 2018 mass was actually added.
False media narrative
When it comes to Greenland ice mass, Die kalte Sonne summarizes: “The usual media narrative of an alleged increasingly rapid ice melt in Greenland is thus not correct.”


[…] Greenland Sees Significant Snow, Ice Mass Loss Slowdown Over Past Decade, Danish Data Show […]
Like almost all articles about Greenland,
this article is incomplete.
I am very disappointed this is true
at an otherwise fine website.
I hope this MAJOR omission
will be corrected immediately.
The last time I saw a number, in 2020,
the Greenland ice mass was
estimated at 2,700,000 gigatons
I’m not sure what the margin of error is.
This article talks about very tiny changes in ice mass
relative to the total ice mass. Annual changes may be
smaller than the margin of error in the total ice mass
estimate.
Nowhere in the article did I notice any mention
of how small the annual melt is as a percentage
of the total estimated Greenland ice mass.
Why not?
I’ve complained in these pages before about the use of the word “gigatons” by the warmists as being an intentionally misleading unit (much like the “Hiroshima bombs” unit) – since “giga” sounds really, really big. But methinks that your overall Greenland ice cap mass is correct; during one of those complaints a few years back, I noted that at whatever “loss in gigatons” for a couple years as a rate, it would take about 8,000 years (!) for the Greenland ice cap to disappear at that rate. Yawn.
The Greenland Mass Balance chart suffers from the problem of charting teeny-tiny changes all on their own – it gives you a curve that looks like it has real change. But if you look at those numbers as a total percentage of the ice cap, it barely qualifies as noise.
Sounds like we are both chronic complainers !
I believe cubic kilometers may have been used in the
past, but this article used gigatons, so I tried
to keep my complaint simple.
Only 8000 years of Greenland ice left ?
I’ll trust your math.
I thought our planet was doomed
from climate change in only 10 to 20 years.
I’ve been hearing that prediction
for many decades, and probably will be
hearing it for the rest of my
life. It’s nonsense, of course.
Everyone with a science education
knows real science requires at least
three decimal places. If they had
predicted climate doom in 20.658 years,
I would be worried !
Well, I wouldn’t call it chronic complaining – just getting the facts straight AND getting the IMPLICATIONS straight.
I dug out my notes, and the short summary is as follows.
The number I had when I did the calcs was 2.4E+15 tons of ice in the Greenland ice cap. During the “scare” that can be seen in that red-line figure above in the article, the annual mass loss briefly reached a big, scary **300 GIGATONS!!!!1!!!!*** But 300GT is 0.013% of the total ice cap – and so at that rate of ice loss, it would take about 8000 years for the Greenland ice cap to disappear.
Again, yawn.
The micro-analysis in that figure is correct, and it shows the amount of ice loss decreasing and probably fading away to nothing. But we shouldn’t get tangled up in playing their micro-analysis games. The macro-reality is that the changes they are trying to scare everyone with are absolutely trivial (0.013%). Pointing this out renders any argument of any kind based on annual changes of a few hundred GT irrelevant.
Basically, there’s no there there. Those are the scientific facts, and we shouldn’t play by their stilted rules.
___In Context___
I know I’ve seen that portrayed graphically somewhere, but can’t seem to find the link. Thanks fo supplying the numbers.
“… we shouldn’t play by their stilted rules.” ✅
The top two comments mention giga.
Fine, folks need a perspective.
Let’s also fix using truncated Celsius temperature charts.
We need to see charts in the full Kelvin scale.
Besides, K is a true zero ratio scale, something many wrongly assume of C and F.
So Greenland Ice was at a high from about 1985 through to 2000, then declined to the low of 2012. Remember 2012 and the low ice causing Mark Serreze headline making alarmism — “The Arctic is screaming,”. Since 2012 Greenland’s ice has been accumulating. How very cyclic!
From https://alarmistclaimresearch.files.wordpress.com/2019/02/amo-pdo-solar-and-arctic-v2.pdf by By Joe D’Aleo.
Also this video about ocean current affecting the Arctic https://youtu.be/KNT7oB53pRY .
Pierre my comment has hit the bin? I find this funny when the spam by Rio has remained on a few post on this site.
Watson river discharge showed a rise 2010-2012 but is now back to lower levels.(http://polarportal.dk/groenland/iskappens-overflade/)
A good sign for those who like ice and snow.
What happens to the Greenland SMB is primarily a function of the jetstreams. If they bring warm air up from the south, there is a lot of melt and sometimes even rain. If they bring cold dry air from the north west, it’s very cold but there is no snow. The northern jetstreams are still disorderly, and have been since well before the solar minimum two years ago. With the current state of the jetstreams Greenland isn’t really an indicator of anything very much, because there is a huge random component.
The same argument applies less strongly to the Arctic average temperature. Warm air dragged up from the south by jetstreams causes a big spike. Last winter we had a stream up from the Atlantic actually over the North Pole for 10 days.
[…] Related: Greenland Sees Significant Snow, Ice Mass Loss Slowdown Over Past Decade, Danish Data Show […]
[…] From The NoTricksZone […]
[…] From The NoTricksZone […]
[…] From The NoTricksZone […]
[…] From The NoTricksZone […]
O my word. It does appear as if all the “science” of the fearmongers is easily shot down or negated by good common sence and proper knowledge. It is not about the science but about driving the narative. Thanks for this article!