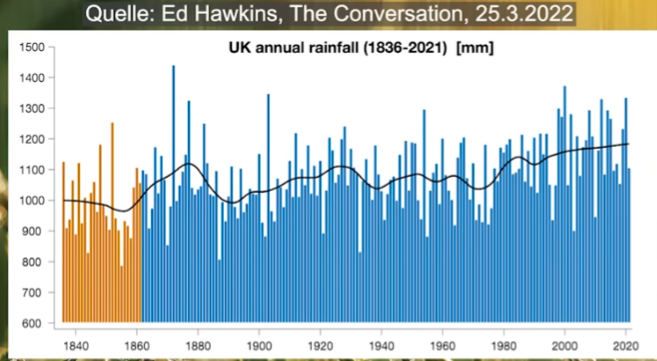
United Kingdom rainfall has been increasing over the past two centuries.
Europe saw a dry summer this year and global climate alarmists claimed that droughts are becoming more and more frequent. This is the new normal, they like to claim.
However, a treasure of hard data refute this completely. A recent paper by Hawkins et al published by the Royal Meteorological Society delivers astonishing results tabulated from old, meticulously hand-written observations going back over 300 years.
Hat-tip: Die kalte Sonne here.
What follows is the paper’s abstract. The key statements are emphasized:
Recovering additional historical weather observations from known archival sources will improve the understanding of how the climate is changing and enable detailed examination of unusual events within the historical record.
The UK National Meteorological Archive recently scanned more than 66,000 paper sheets containing 5.28 million hand-written monthly rainfall observations taken across the UK and Ireland between 1677 and 1960.
Only a small fraction of these observations were previously digitally available for climate scientists to analyse. More than 16,000 volunteer citizen scientists completed the transcription of these sheets of observations during early 2020 using the RainfallRescue.org website, built using the Zooniverse platform. A total of 3.34 million observations from more than 6000 locations have so far been quality controlled and made openly available. This has increased the total number of monthly rainfall observations that are available for this time period and region by a factor of six. The newly rescued observations will enable longer and much improved reconstructions of past variations in rainfall across the British and Irish Isles, including for periods of significant flooding and drought. Specifically, this data should allow the official gridded monthly rainfall reconstructions for the UK to be extended back to 1836, and even earlier for some regions.”
It is truly stunning that such a volume of precious data would go ignored for so long by research institutes that are publicly funded to the tune of tens millions of dollars annually to reconstruct historical climate.
Now that it has taken 16,000 volunteers to come in and do this work, we have since gained a much clearer picture of the UK’s past climate. Some of the results are interesting, if not surprising, especially in terms of all the doomsday drought claims having been made lately.
The driest year on record didn’t happen recently, but in the year 1855. Moreover, as the chart above shows, the trend has been wetter, and not drier. Rainfall has averaged 10% more than recently then in the mid 19thcentury.
The dry years seen since 1950 turn out to be nothing out of the ordinary.


What we need to understand is that for the Regime Media the news cycles are nowadays very short in Time. Also the available Time to spread the authorized PROPAGANDA during prime-time is also limited so they can’t possibly refer ALL FACTS and figures!
May I ask my fellow German Modern Modern Slaves if you guys miss her?!
https://uploads.disquscdn.com/images/6420b7472c1ede2337576cdfb6ac4cda5cdb9c0a44fed4302aafe6937a602b7a.jpg
Historical handwritten rainfall records cannot be manipulated without obvious and flat-out falsification.
Following the “1976-1977 Climate Shift” – you can search it up – there appears an uptick in the chart. From about 1986 the rainfall is about as fluctuating as any weather event.
There is a problem in that the further back you go, the less likely it is that extreme rainfall events will have been accurately captured. They didn’t have automated tipping rain gauges, and rain gauges were very small, at one time they didn’t believe you could get more than 20mm in a day! So you are reliant on the operator having noticed the gauge was full just as it reached full. Although multiple inches of rain in a day may be quite rare, missing most of the total on one day just once a year destroys any meaningful trend analysis since Victorian times.
Link do not works.
Worked fine for me Alex
Increasing rainfall is consistent with global warming.
As the troposphere warms, it holds more water vapor
More water vapor should lead to more clouds
More clouds should lead to more rain
That’s what the historical records show
I remember reading about this exercise a while ago. It’s good to see it come to fruition
1855 was right at the tail end of the Little Ice Age. So my question is: Did they take snowfall into consideration? Because the colder it gets the less rain you have, but you will have more snow for the exact same quantity of water over an entire year.
The only correct climate science is at https://ssrn.com/author=2627605
[…] From the NoTricksZone […]
[…] From the NoTricksZone […]
[…] From NoTricksZone […]
[…] From the NoTricksZone […]
[…] NoTricksZone에서 […]
[…] From the NoTricksZone […]
[…] From the NoTricksZone […]
[…] From NoTricksZone […]
[…] From the NoTricksZone […]
Why is the 1677-1836 data missing in the Graph?
Paper here https://rmets.onlinelibrary.wiley.com/doi/10.1002/gdj3.157
[…] or perhaps it’s the last 60-years of failed prophecies, or maybe it’s because none of the real data supports the narrative. Whatever it is, people are simply not scared, not like they were of Covid […]
[…] From the NoTricksZone […]