Charts by Kirye, using data from the Japan Meteorological Agency (JMA)
Extreme weather events, like tropical storms, are supposed to be intensifying and becoming more frequent as the world warms, the global warming alarmists like to claim as they try to spread panic and anxiety. This, they say, is robustly supported by science and so humanity is facing dire consequences unless it stops burning fossil fuels immediately.
Today let’s use the scientific data on Pacific typhoons to see if the alarmist claims are true. These data are provided by the renowned Japan Meteorological Agency (JMA). Surely typhoons must be increasing in frequency year by year since the temperature has risen over the 20th century.
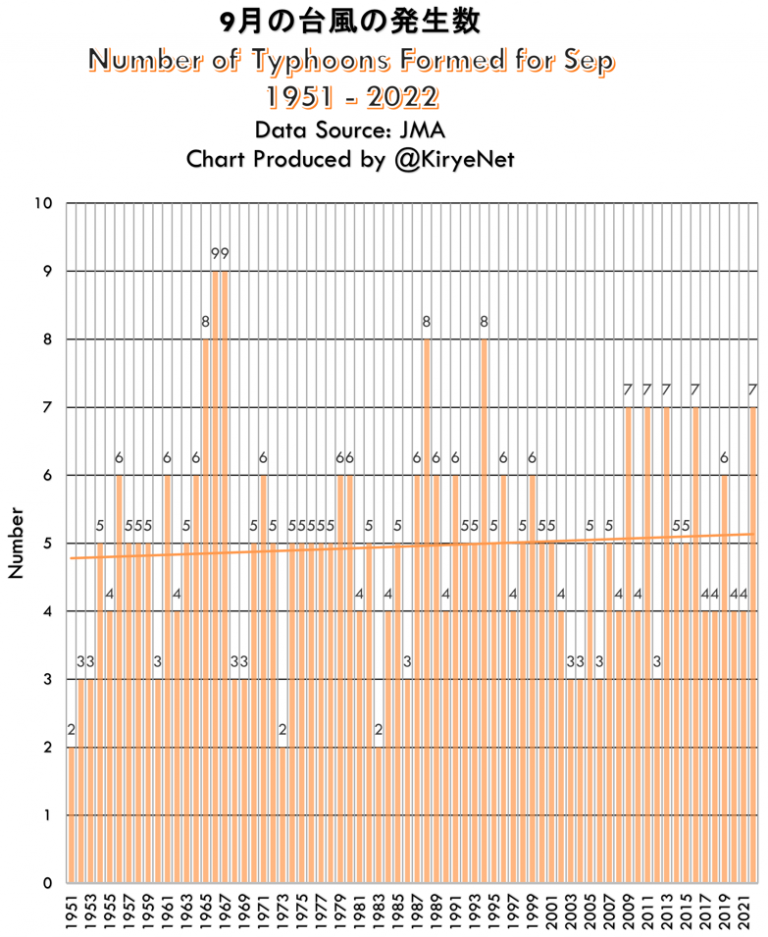
First we look at the number of typhoons occurring in September, since 1951:
Data source: JMA
Lo and behold, the trend in terms of typhoon frequency in September has been upward and so the alarmists must be correct. The science is settled!
But not so fast. Firstly, if we ignore the 1950s, the above trend would be pretty much flat, if not slightly declining. Secondly, examining only one month doesn’t really tell much at all.
Trending downward
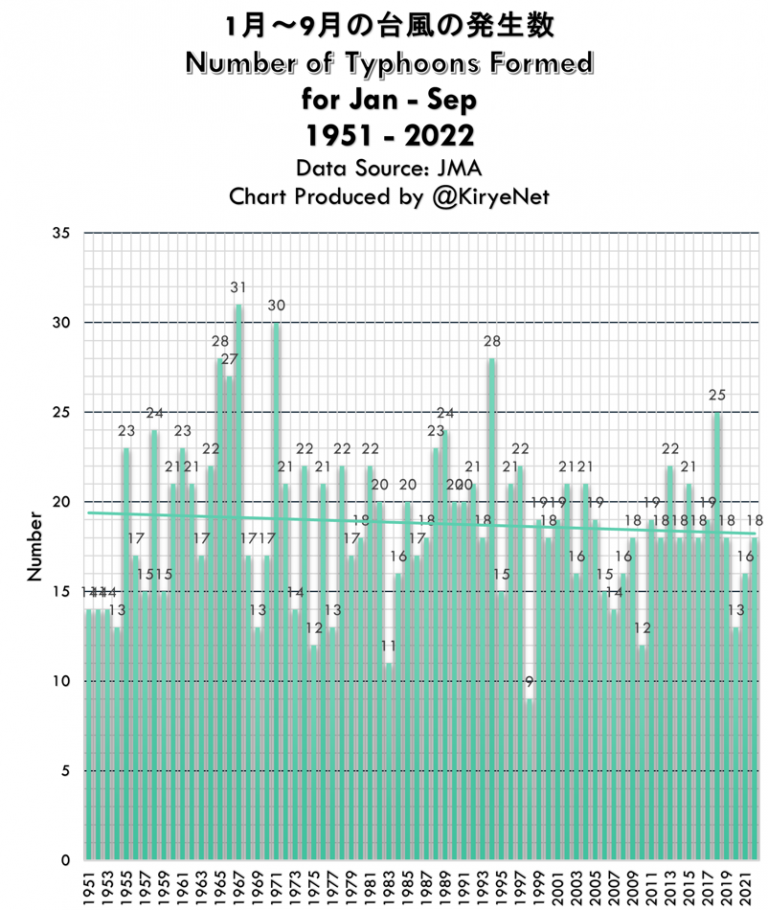
So next we look at the data that accounts for the entire January-September period for each year since 1951:
Data source: JMA
Accounting for the entire 9-month period each year, we see that the number of typhoons occurring has been trending downward for the past 7+ decades. The warming the planet has seen over this particular period has not led to more Pacific typhoon activity. To the contrary, warming seems to be putting the brakes on storm brewing in the Pacific.
That’s good news, but you’ll never hear it from the alarmist climate hoaxers. They only want you to believe their fantasies and to not look at the real, hard data.
The typhoon trend is just more “Inconvenient Truth” that the climate scamming alarmists don’t want the public to know.


1967 must have been a fun year.
Pre-1980, before there were lots of weather satellites, I suspect the Typhoons Formed numbers may be undercounted.
What a world, in which “beancounters” determine climate ups and downs.
Unbelievable.
[…] From the NoTricksZone […]
[…] From NoTricksZone […]
Shoddy work leaving out the other months which do contain typhoons according to the data from JMA.
Especially poor to not mention why those months and typhoons were left out of the analysis.
That is the fav trick of warmistas. Please don’t do it here.
In January, 2023, when all data for 2022 are available, we will plot the chart for all the months (Jan – Dec). Here’s up to 2020: https://notrickszone.com/2021/08/13/hot-air-coming-from-ipcc-at-tropical-storm-levels-typhoons-trending-down-since-1951/
[…] Link: https://notrickszone.com/2022/10/18/typhoon-frequency-has-fallen-since-1950-contradicting-alarmist-g… […]
[…] Typhoon Frequency Has Fallen Since 1950, Contradicting Alarmist Global Warming Claims […]