Charts by Tony Heller’s wife, Kirye
The January-2023 mean temperature data from the Japan Meteorological Agency (JMA) for Tokyo and its Hachijō-jima island in the Pacific have just been released.
Not surprisingly honest institutes that don’t rewrite history like the the JMA show temperature trends that are not unusual.
First we look at the JMA temperature data and linear trend since 1985 for the megacity of Tokyo:
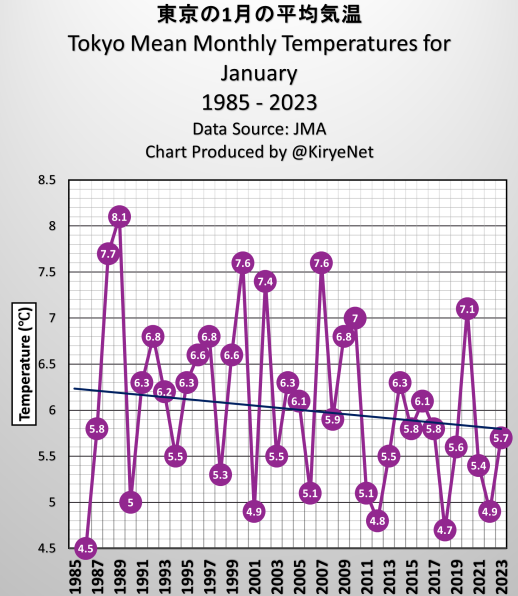
Data source: JMA.
Mid winter (January) in Tokyo has been cooling over the past 38 years! No warming – winter seems to be getting harsher.
Hachijō-jima
Next we look at the mean January temperature of the Tokyo offshore island of Hachijō-jima, going back to 1945. Due to its rural location, the urban heat island effects allow cleaner temperature readings than what we find in the middle of Tokyo’s sea of concrete, asphalt, steel and waste heat from heating and automobiles:
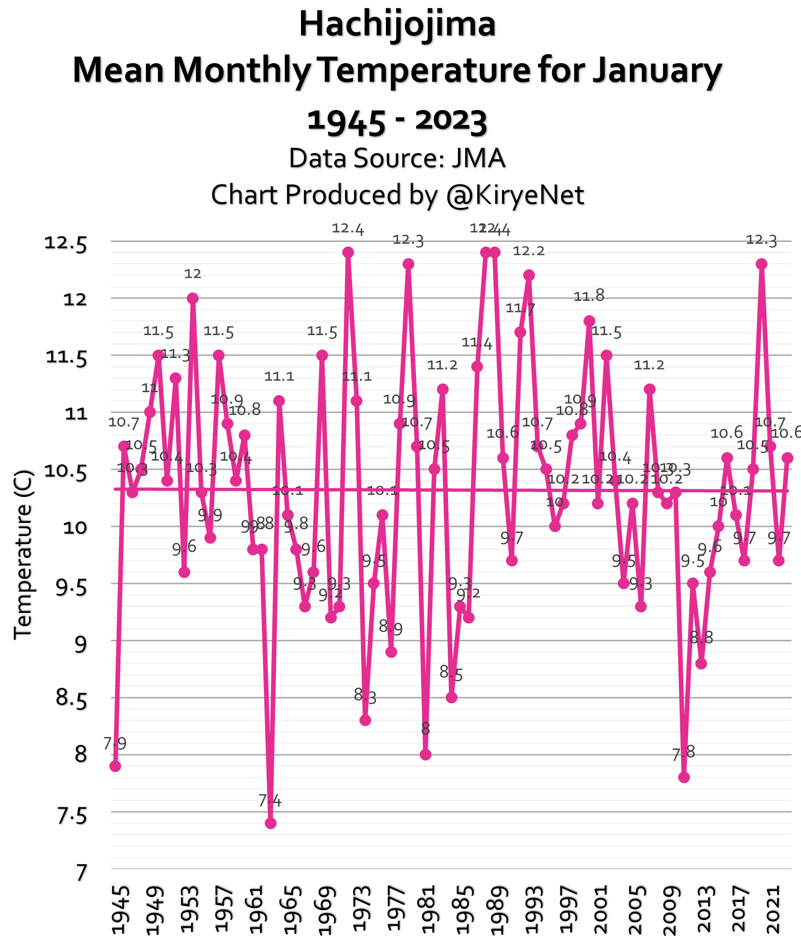
Data source: JMA.
Hachijō-jima island is located 287 kilometers south of Tokyo, in the Pacific Ocean. Here as well the January mean temperature trend hasn’t risen in nearly 80 years. It too has cooled since 1985, linear trend.


Hey Tony…Kirye is not only beautiful but smart…damn fine combination.
Keep her.
I send these articles ( electroverse.co realclimatescience.com NTZ ) out everyday and people ARE waking up to the AGW crap…slowly.
Ya’ll keep doing your part and I will get it out to as many people as I can…thanks!
Does this analysis undermine alarmist claims about warming oceans? Almost certainly, Tokyo’s air temperature is profoundly influenced by the Pacific Ocean’s surface temperature. Thus, might Tokyo’s long-run COOLING trend imply a cooling of the western Pacific Ocean?
[…] From NoTricksZone […]
These graphs are looking at January-only temperatures. For the whole year, the trend for Tokyo is positive over this period:
https://i.imgur.com/1gn7kdX.png
However, the trend at this station is incongruent with the station’s two closest neighbors, Yokohama (29km away), and Chiba (31km):
https://i.imgur.com/tyH8Hlk.png
So there is unquestionably spurious non-climatic artifacts in the Tokyo station record. Indeed, that is exactly what pairwise homogenization algorithms identify:
http://berkeleyearth.lbl.gov/auto/Stations/TAVG/Figures/156164-TAVG-Alignment.png
There are numerous breakpoints, documented and otherwise, in the Tokyo station record that are introducing non-climatic trend biases, including a station move ca. 2005 or so. When those are accounted for the station trend is very much in line with the surrounding region and shows considerable warming for the past 40 years:
https://i.imgur.com/pHEj854.png
It’s very important to actually understand the data you are working with, which the author of these graphs does not. Station records will contain a signal related to the climate as well as a signal related to station specific artifacts, such as instrumentation changes or site moves, and you cannot simply assume that the observed trend represents only a climate signal without additional analysis.