Carbon Dioxide Will Cease To Be a Problem
By Ed Caryl
We do have the real world measurements of CO2, resolved to a monthly measurement with a well established seasonality that I will not describe here. We also know fairly accurately how much carbon we are injecting into the atmosphere from fossil sources.
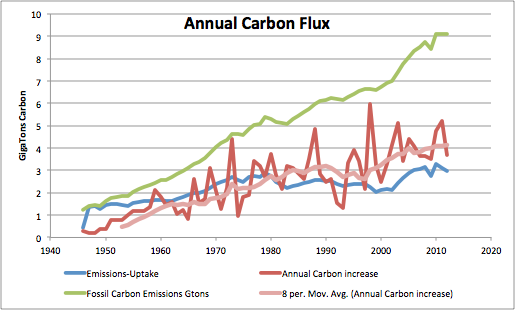
Figure 1 is a plot of annual fossil carbon emissions (green trace), the annual atmospheric carbon increase (red trace) computed from Mauna Loa CO2 figures, and emissions minus the ocean and biosphere flux.
In Figure 1, the blue trace (fossil carbon emissions with all the biospheric carbon uptake subtracted) should equal the red trace, and in the long term average (pink trace), it comes close, so our simple model is reflecting the real world in that half the carbon emissions are being taken up by the ocean and the biosphere. The other half is contributing to the atmospheric CO2 increase. The difference between the pink and the green curves in 1977 is about 2.5 Gigatons and is increasing at an ever faster rate. The current difference is about 5 Gigatons. An increasing amount of CO2 is disappearing into the biosphere.
The part that remains is called the “air-borne fraction”. If this part is charted as a percentage you get a plot that looks like this (from James Hansen’s paper here. His Figure 3, is my Figure 2. Hansen’s caption is quoted.
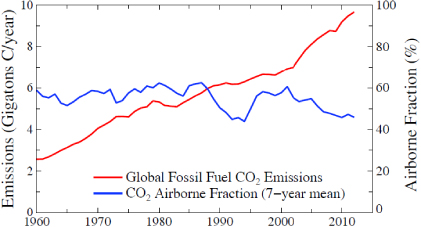
Figure 2: Hansen’s Figure 3 “Fossil fuel CO2 emissions (left scale) and airborne fraction, i.e., the ratio of observed atmospheric CO2 increase to fossil fuel CO2 emissions. Final three points are 5-, 3- and 1-year means.”
I duplicated Hansen’s figure in the next figure, extended, and showed the un-averaged data. The heavy red trace is Hansen’s blue trace above:
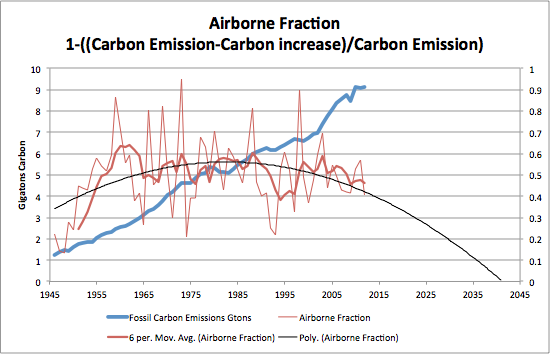
Figure 3 above duplicates Hansen’s Figure 3 using the original data. The narrow red trace is the un-averaged computation. The black trace is a 2nd order polynomial trend line.
Note in Figure 3 that the airborne fraction of fossil-fuel carbon polynomial trend line goes to zero in about 30 years. When this happens, atmospheric CO2 will stop increasing. This roughly agrees with the atmospheric CO2 increase ceasing in mid-century as found in the previous article.


Overall all the extra CO2 getting absorbed by the biosphere tells me we are really greening up the planet. But that should not be a surprise because anyone with a bit of competence in biology knows that CO2 is fertilizer for plants.
Another point is how do you know that the behavior is really polynomial in Figure 3?
The blue trace in figure 1 is fossil carbon emissions with all the biospheric carbon uptake subtracted. That part is simply dissolved in the oceans.
The figure 3 polynomial is because the biosphere is growing polynomially.
Thanks Ed, I’ve added the changes. And makes sense if the biosphere is growing polynomially. Will be interesting to see Figure 3 again in 5 – 10 years.
Be very wary of using polynomial fits to make projections. They can look spectacular, but I would not generally expect to take them very seriously.
I agree – especially in climate science. Too many scientists think trends in a chaotic system keep going on and on. Arctic sea ice and global temperature trends are examples. But they never do. the system has built in correction mechanisms that work to balance an imbalance.
If atmospheric CO2 concentrations peak at 430 or 440 or so, then all the talk about doubling is for nothing.
I’ve asked a couple of times on posts dealing with CO2 about how humans could manage to double the concentration more than about once. We are maintaining and using a lot of fuel but increasingly in a more efficient manner and with a different mix. Can we burn more. Sure. How much? Someone needs to show some numbers. As Ed’s post makes clear there are countervailing forces at work. So, it depends on where one starts; if at 280 then maybe once. But I don’t see it happening – only partly because of the theme of this current post. (It could go higher – it has. Humans did not do it, however.)
My reasoning is this: Just as urban society in the late 1800s could not sustain the use and maintenance of horses as the main transport mode there was already the beginnings of the replacement technology. We never had (and do not now) have a shortage of horses. Likewise, things continue to change. A simple idea is that many young urban folks are less interested in owning an auto. In the late 1950s and thru the 1960s there was a big deal when new cars hit the showroom floors. First the cars appeared under a tarp and young folks, many knowing they could not afford one, would look and talk about the “new look” until the unveiling. And a new look sold cars. Many of those got about 12 miles per gallon. Now, with wind tunnel design, there is a sameness. Also, gas mileage now is easily found between 30 to 40 mpg. Have you seen any teens in an auto showroom recently?
Mixed-use developments can contribute to a move away from cars, as will be the case in NYC with Hudson Yards.
http://www.hydc.org/html/home/home.shtml
Lots of other things at work too – another time perhaps. But don’t miss the main change that is in the desires of young folks. And population change – demographics is destiny.
If the CO2 increasingly gets absorbed by the biosphere, then atmospheric concentrations should start slowing down. But right now there is no sign of that: http://en.wikipedia.org/wiki/Keeling_Curve. Still looks like linear growth.
Before 10 years ago it wasn’t linear. It was increasing at an ever faster rate until Pinatubo. The volcano slowed the rate down for 7 years until the 1998 El Niño. It now is linear. Look at the differential in figure 1. The Keeling curve disguises the rate information. Besides, the CO2 concentration is a function of temperature, primarily ocean temperature, not our emissions. (Next article)
Small quibble: I think your Fig1 & 3 Y-axes are Gt/year.
Yes.
Thanks Ed.
A while back I had a discussion on EIKE about the fact you show in fig. 1, as I had noticed this graph after putting the data in a spreadsheet. I had also pointed out the fact that the emission of CO2 is of course increasing every year. This means that the additional CO2 has to go into the sea.
It’s quite amazing when it’s compared to the temperature. Especially the peak in 1998 and then the drop in 1999 & 2000 are standing out.
The person I had the discussion with didn’t understand what I’ve seen.
The next time I have a discussion about this I can refer to you article.
Perhaps you can ask EIKE to translate and post Ed’s article. Would be interesting to see the German reaction.
Could we end up in conflict with the biosphere?
Where we need to keep warm and the bios keep “stealing” the CO2 we have worked hard to put into the atmosphere?:-)
Do you think that CO2 keeps you warm? What gives you that idea?
It just doesn’t work that way in the atmosphere – obviously – if it did, we would have measured warming in the past 16 years.
Ed, you have fallen for the language degradition of the IPPC and green followers. Carbon is an element. It comes in the physical pure crystal forms of diamond and graphite. There is also an amorphorus carbon form which on microscopic inspection has many different compounds and crystal forms. The element carbon occurs in tens of thousands of compounds including the skin, flesh and bones of the human body.
Carbon dioxide is a molecule containing the elements carbon and oxygen and having the formula CO2. It is a colorless non-toxic gas. Carbon monoxide is another gaseous molecule composed of the elements carbon and oxygen with the formula CO. It is a toxic gas (above a very low threshold) resulting from incomplete combustion of any material or compound containing the element carbon. It can occur in very minute quantities in the breath of animals (including humans)
Calculations of supposed emissions from the combustion of fuels include assumptions which may well exaggerate the quantity of CO2 produced. While on the otherhand very little is known about the absorption of CO2 by water surfaces (including clouds) and plant matter (incuding algae in the oceans)
You should at least stick to facts (eg CO2 rather than carbon C) and mention assumptions when presenting data.
What a hilarious piece of utter nonsense!
Some people were already cautiously hinting of issues with a “polynomial” fit, only to the hear that the biosphere is “growing polynomially”. Darn. How do you know? And what polynome? There is an infinite number of polynomials, from linear, to quadratic, to cubic, to infinite power, and they behave very differently.
No reason is given why a quadratic polynomial MUST be used. As it stands, it is done because you can do it numerically. Not a problem up to this point, but then taking a period of some 60 years of data, and projecting some 40 years beyond the end of the data set, and then concluding that the point where the polynomial goes through zero has any scientific relevance, it just hilarious! You never, ever interpret polynomial fits much beyond the end of the data set, unless you have a firm model established for such behaviour. And even then, great caution is advised!
Why don’t you take a third order polynomial, which you can just as easily fit to the same data, and then conclude from the rebounding curve some years later that the fraction (actually a value with an upper limit of 1) will go to infiniti, because the polynomial goes to infiniti?
Sorry, but while the data may warrant some analysis in the direction you point out here, that part of polynomial fit with the conclusion drawn from it, is utter nonsense. This will leave a poor impression on this blog; consider deleting it!
Agree with you about polynomials. They are a last resort in fitting. If nothing fits, a polynomial with enough terms trivially does. It is a kind of putty. They belong to the most ugly formulas in mathematics, but that is about esthetics. Ed’s article does not stand or fall however with this issue.
I wouldn’t go that far. They can be useful for fitting a curve. You just have to be real careful using them for extrapolating.
PeterF
6. Oktober 2013 at 10:37 | Permalink | Reply
“This will leave a poor impression on this blog; consider deleting it!”
Deleting mistakes is the IPCC climate scientists’ pastime, not ours. Every time they churn out their latest temperature history revision or sea level rise adjustment they delete the older versions. Winston Smith science. You recommend we do the same? I think we are all grown ups here; not government scientist stand-ins.
Polynomial fit? It’s no worse than the Hocky Stick.
Were that curve crosses zero is just where the CO2 growth rate reaches zero. It is probably a few years early, but not much. CO2 growth will stop in mid century at less than 450 ppm. We will see the CO2 growth rate begin to slow in the next ten years.
I use Carbon in these charts so that they can be compared to the warmist charts that use carbon. Much of the source data is in carbon units, especially the ocean data. Temperature change and carbon is close to a ten to one ratio, where the CO2 ratio is 35 to 37, a confusing ratio on the charts.
Where that curve… Obviously.
AR5 did delete the Hocky Stick.
The discussion should not target carbon flux, as what is being discussed is CO2, but it should also be made clear that the CO2 emissions that are being discussed are only the four percent of total annual CO2 emissions that are man-made.
The vastly largest portion, 96 percent, of all annual CO2 emissions that wind up in the atmosphere are from natural sources.
It would be great to see the discussion expanded to cover all of the atmospheric CO2, and not just the tiny, man-made fraction of it.
As a layperson and relative “latecomer” (i.e. approx. 10 days BC [Before Climategate]) to the battlefield of the climate wars, this particular fact was, indeed, a “tipping point” (you should pardon my use of the phrase!) which set my feet firmly in the skeptic camp.
It never ceases to amaze me that – within my own circle of friends, family and acquaintances – whenever I ask those who assure me that “thousands of scientists cannot be wrong” if they know:
a) how much CO2 is in our atmosphere and/or
b) how much of that C02 is actually “human generated”
They don’t have a clue! And their guesses aren’t even close!
But as Dr. Norman Page cogently summarized elsewhere a few days ago:
But speaking of the biosphere and “biodiversity”, from everything I’ve read this is quite likely to be UNEP (manufacturer and promulgator of scary stories since 1972)’s next greatest threat to the future of the planet.
It’s been waiting in the wings for a few years, now, but it comes with its very own UN blessed “Platform” IPBES [modelled on the IPCC], and a “new testament” for the climate bible: TEEB, with provision for all kinds of “mechanisms” for putting “nature on the balance sheet” (read: send oodles of money now!)
I agree, up to a point. The problem is that there is a complex movement of CO2 on an annual basis, with sources and sinks in a complex dance that makes amounts exceedingly difficult to measure.
http://www.esrl.noaa.gov/gmd/ccgg/carbontracker/
It is much easier to measure the year to year balance. Even the month to month balance is a very noisy signal with large seasonal swings. Globally, the seasonal swing in and out of the atmosphere is 25 to 35 Gtons of CO2. The total in and out from all the various sources and sinks on an annual basis is not known to within even 25%, but may be close to 1000 GTons.
(I use GigaTons [GTons]. NOAA uses Petagrams [Pg]. They are equivalent.)
Ed, you stated, “(I use GigaTons [GTons]. NOAA uses Petagrams [Pg]. They are equivalent.)”. That is true, but the orders of magnitudes are not equivalent. They are not in the same ball park. That is because your calculations address not all global CO2 emissions but only the four percent that are man made.
Walter, thank you for pointing out that error of 10^3. I fixed that in the other post.
The calculations address all CO2 emissions because they are based on the change, the delta, in the Mauna Loa CO2 measurements. I have always maintained that the changes we see in the CO2 in the atmosphere is due to nature, not man. I can find no evidence that fossil carbon emissions have anything to do with changes in atmospheric CO2.