Why ‘Hide The Decline’?
There Has Been No Net NH Warming Since The 1940s
In the press release for a newly published and controversial peer-reviewed scientific paper, Australian scientist Dr. Jennifer Marohasy unveiled one of climate science’s better-kept secrets.
She and her colleagues are well aware that the post-1940s Northern Hemisphere (NH) proxy evidence from tree-rings, bore holes, pollen, etc., consistently fails to affirm sharply rising temperatures from the late 20th century onwards.
In fact, Marohasy points out that a lack of rising temperatures for recent decades is so common in paleoclimate reconstructions that tendentious climate scientists have necessarily added heavily adjusted, hockey-stick-shaped instrumental records (e.g., from NASA GISS, HadCRUT) on to the end of the trend so as to maintain the visualization of an ongoing dangerous warming.
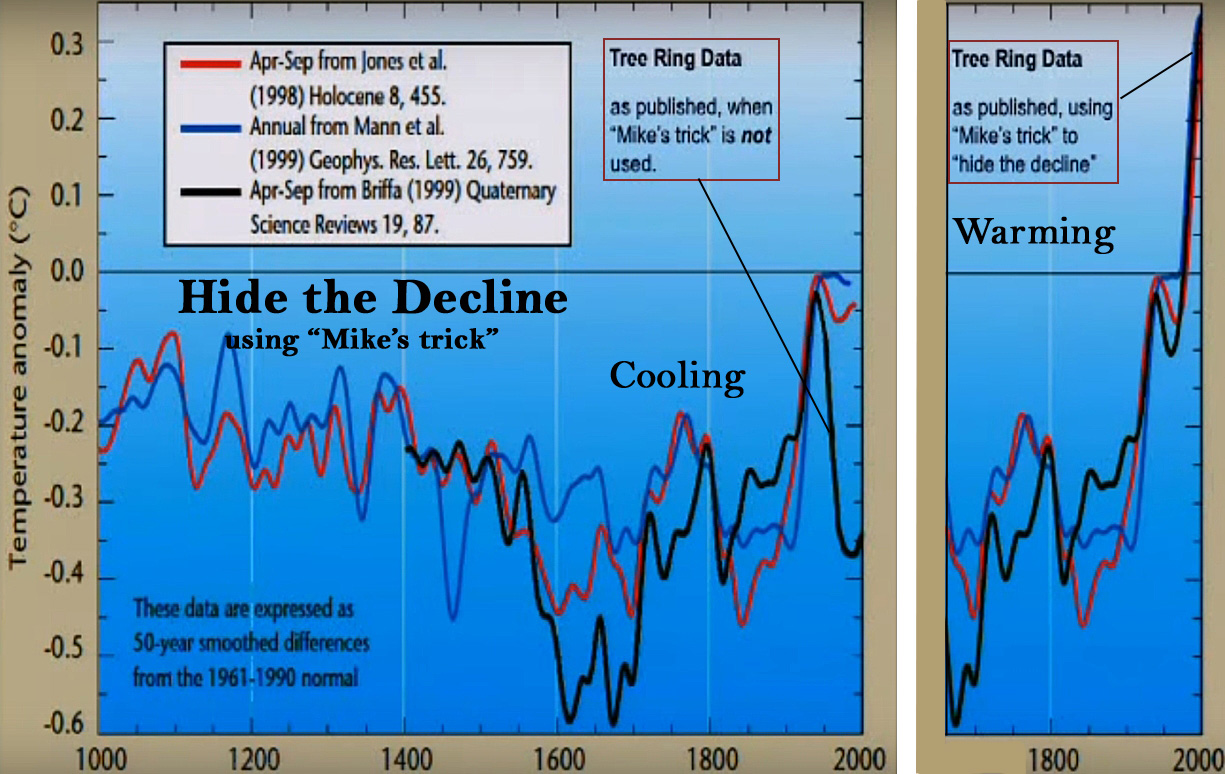
The lack of recently rising temperatures in proxy evidence is somewhat furtively referred to as the “divergence problem”, and the “trick” of adding instrumental records is utilized to “hide the decline”.
Dr. Jennifer Marohasy, The Spectator (Australia):
Marohasy’s conclusions about proxy temperatures are routinely verified in the scientific literature.
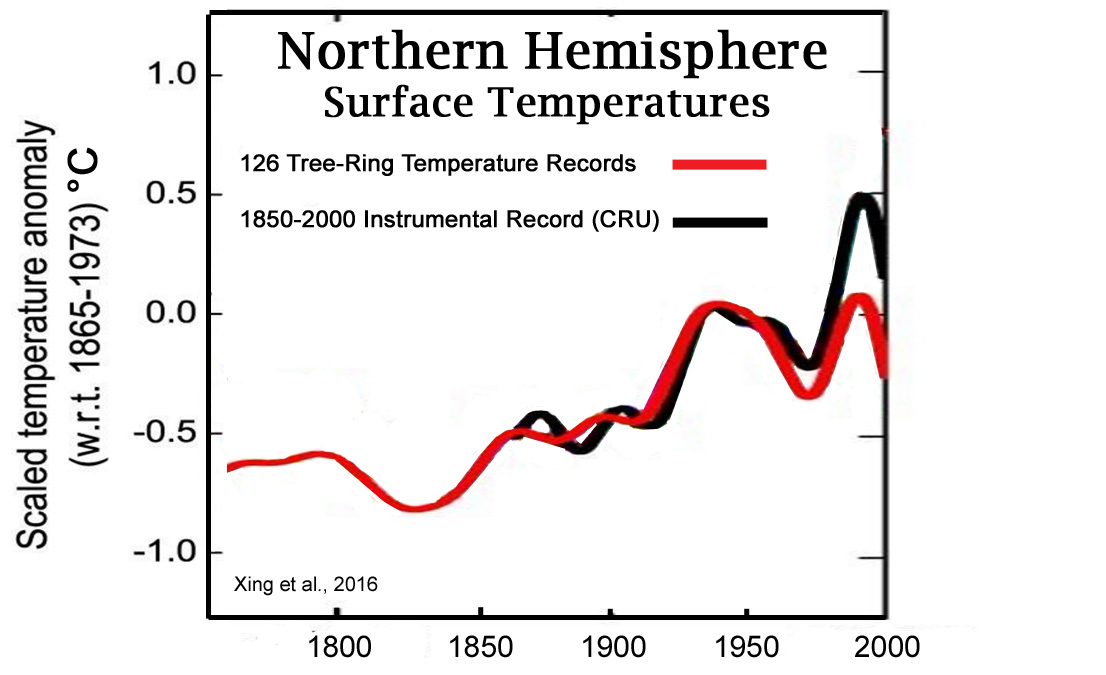
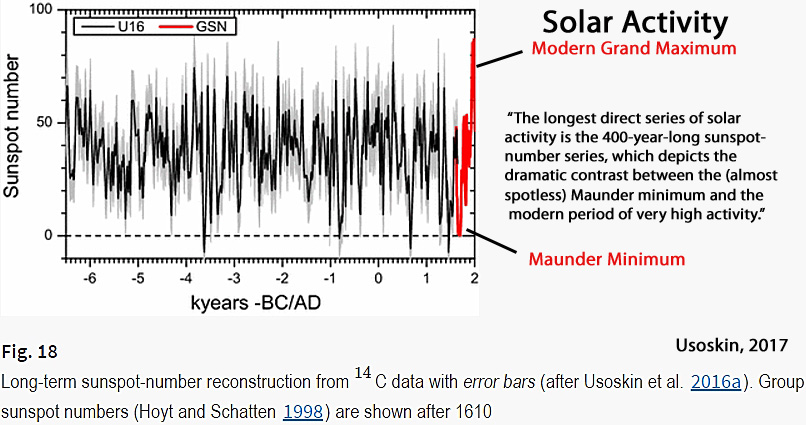
Last year, for example, Dr. Pei Xing and co-authors unveiled a new method (MVDM) for calibrating low-frequency NH tree-ring data for the last 1,200 years in The Extratropical Northern Hemisphere Temperature Reconstruction during the Last Millennium Based on a Novel Method. Using a large volume of 126 proxy temperature records from the Northern Hemisphere, they found (1) a clearly discernible Medieval Warm Period (MWP) (950-1150) and Little Ice Age (LIA) (1450-1850), (2) “likely unprecedented” modern temperatures (relative to the last 1,000 years), as well as a (3) “significant” link between the high temperatures of the MWP and recent times and the high solar activity that characterized both periods (the Medieval Maximum and the Modern Grand Maximum).
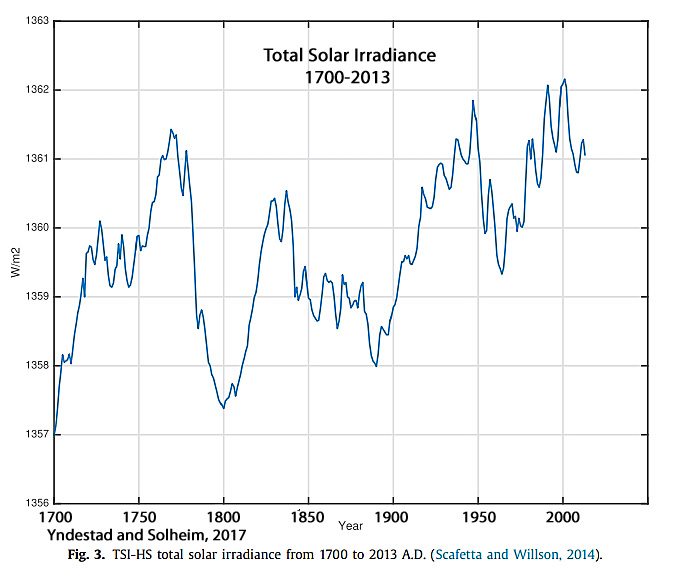
“The smoothed MDVM reconstruction exhibited a general agreement with the variation of the reconstructed total solar irradiance (TSI), and the correlation between the two series during the common period 849–2000 AD was significant (r = 0.498). Specially, the records shared high correlation coefficients in the epochs of the solar maximum (i.e. during the Medieval and Modern age)“
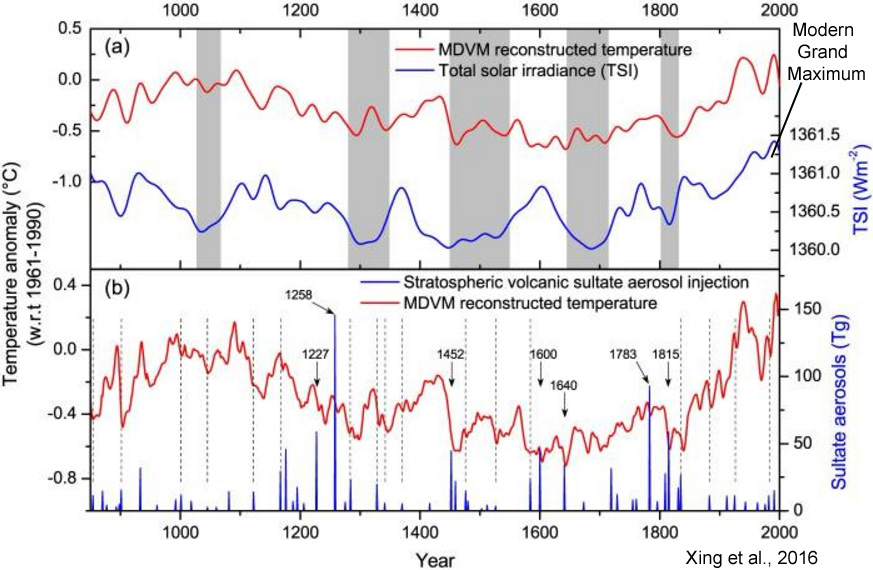
Interestingly, when examining the Xing et al. (2016) reconstruction of the Northern Hemisphere from Figure 7, the lack of sustained proxy temperature warming for the more recent decades is clearly detectable. There is a very noticeable temperature decline after 1980. The Xing et al. (2016) reconstruction also documents a lack of any net NH warming for the 60 years following the 1930s and 1940s peak.
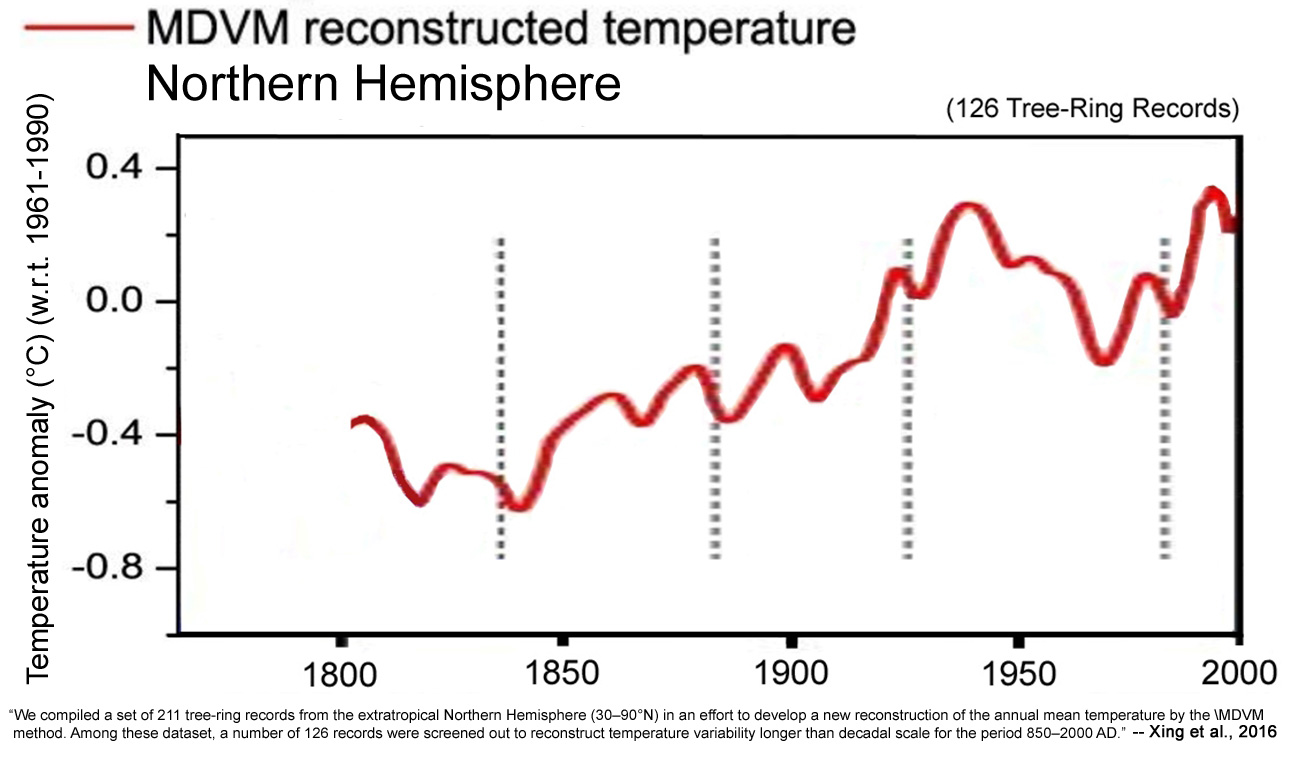
Image Source: Xing et al., 2016 (MDVM Reconstructed NH Temperature)
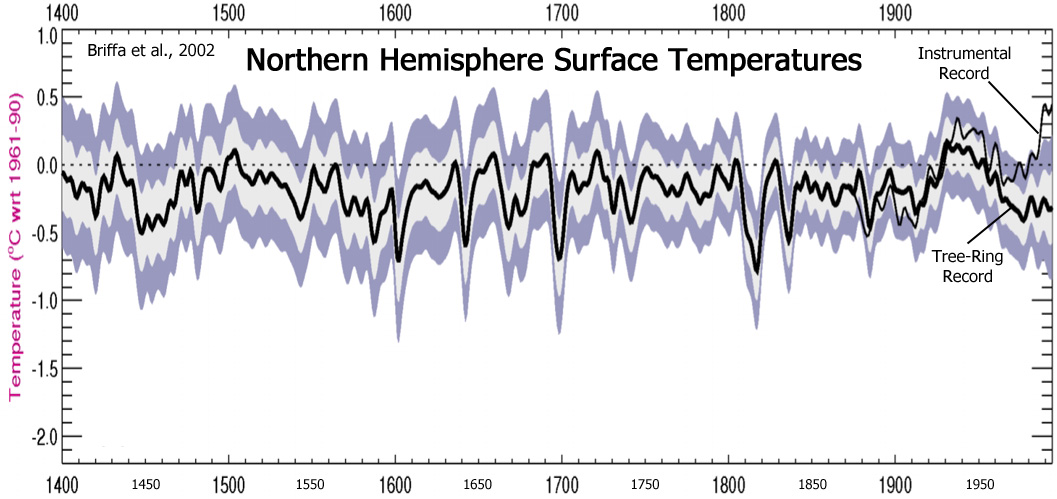
Now consider the instrumental record and its conducivity to hiding the post-1980s decline. Notice the amplitude of the HadCRUT data not only raises the 1980s temperatures well above the tree-ring data, it reduces the 1960s cooling by a few tenths of a degree too. A similar divergence can be found in Briffa et al., 2002, who used 387 NH proxy records in showing that temperatures cooled as instrumental temperatures showed abrupt warming after the 1960s. It’s the illustrated version of “Mike’s Nature Trick”.
Flashback: The leaked Hide the Decline conversations with temperature data overseers…
“…you really ought to replace the values from 1961 onwards with observed [instrumental] temperatures due to the decline.”
“I’ve just completed Mike’s Nature trick of adding in the real temps to each series for the last 20 years (ie from 1981 onwards) amd from 1961 for Keith’s to hide the decline.”
“Also we have applied a completely artificial adjustment to the data after 1960, so they look closer to observed temperatures than the tree-ring data actually were” …. “Also, we set all post-1960 values to missing in the MXD data set (due to decline), and the method will infill these, estimating them from the real temperatures – another way of ‘correcting’ for the decline, though may be not defensible!”
Climategate ‘hide the decline’ explained by Berkeley professor Richard A. Muller
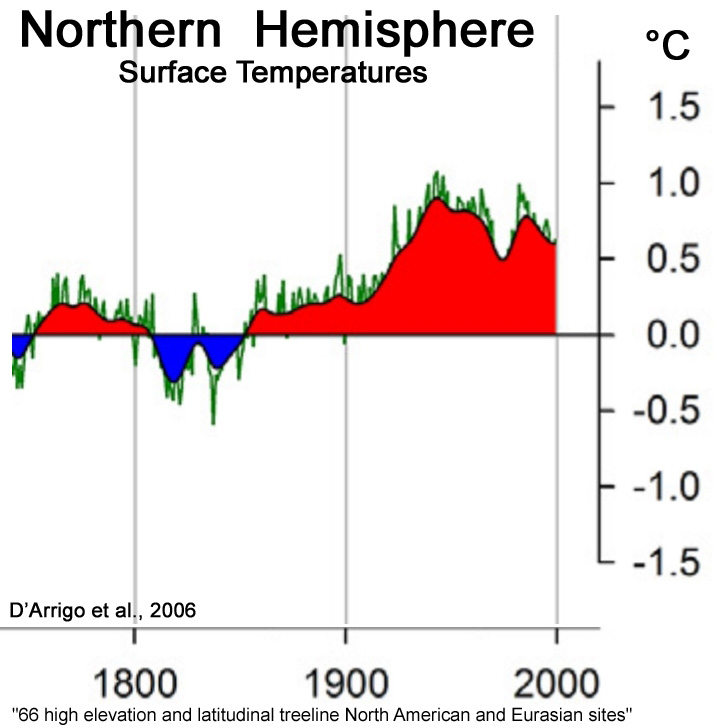
The D’Arrigo et al. (2006) Northern Hemisphere reconstruction derived from “66 high elevation and latitudinal treeline North American and Eurasian sites” also reveals a NH temperature decline after the 1940s and again after the 1980s.
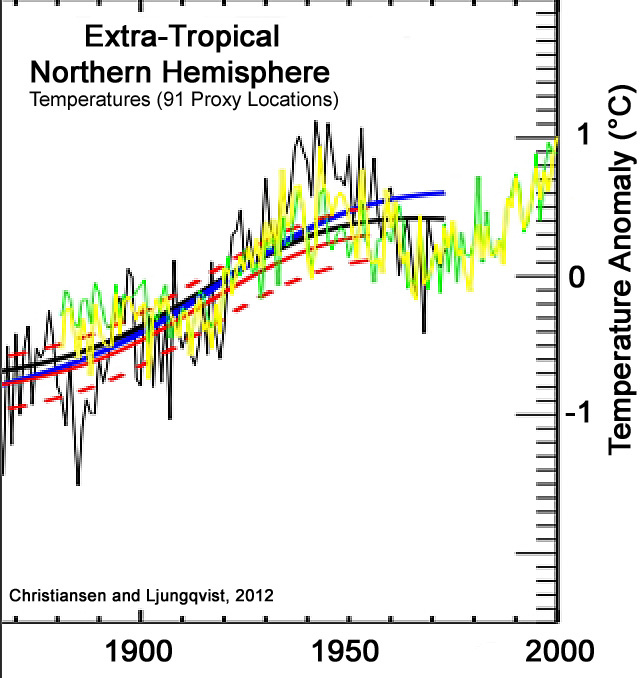
Christiansen and Lungqvist (2012) utilize proxies from 91 locations across the extra-tropical Northern Hemisphere to reveal no net warming since the 1940s.
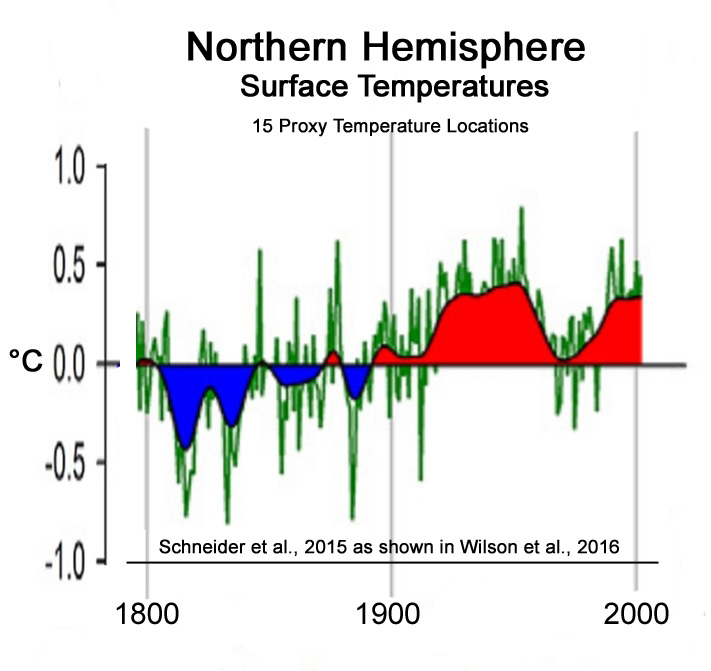
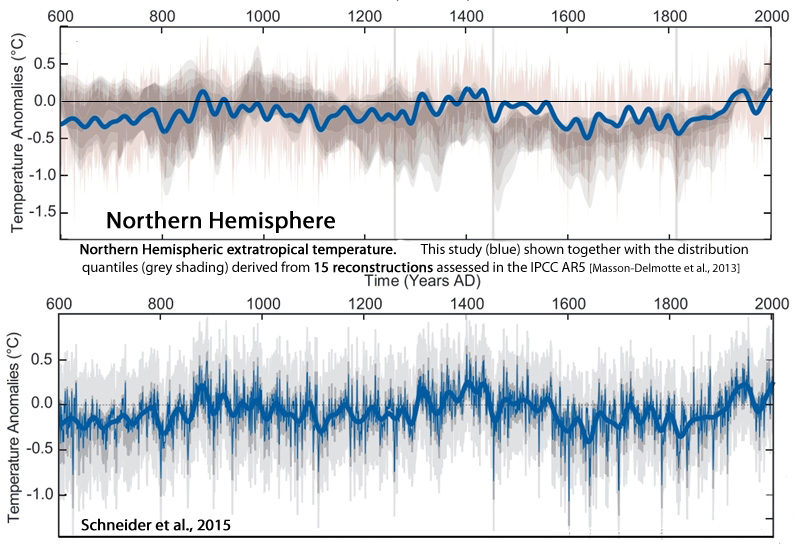
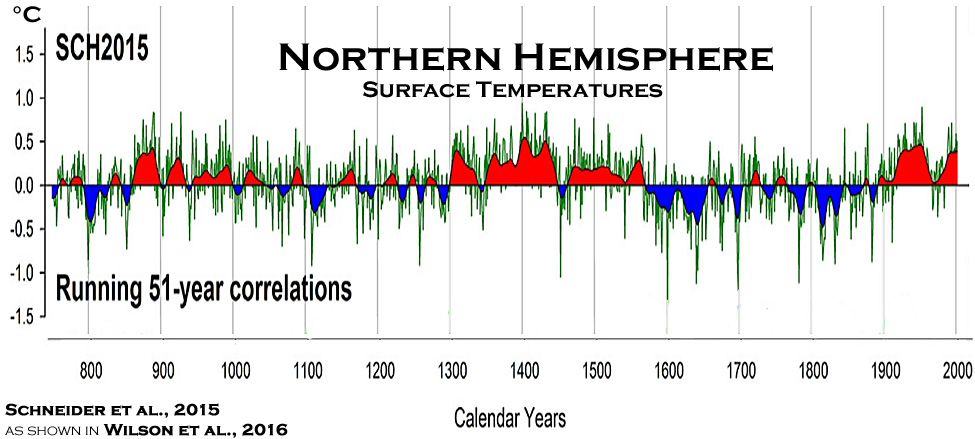
Schneider et al., 2015 use proxy evidence from 15 IPCC-referenced locations in the Northern Hemisphere to document no net warming since the 1940s and a flattening after the 1980s.
Wilson et al., 2016
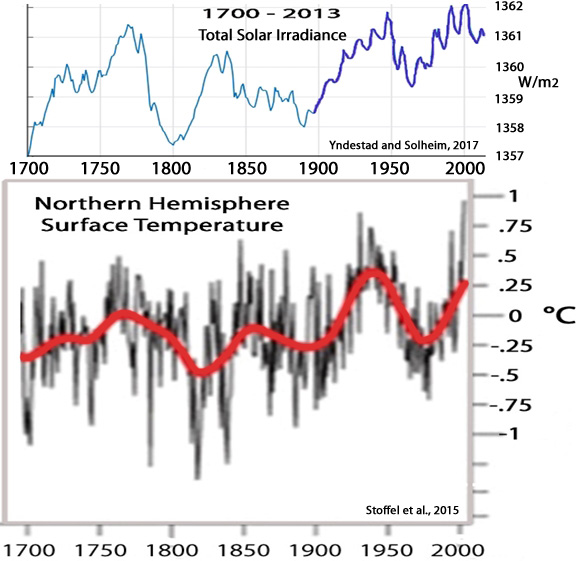
Stoffel et al., 2015 used proxy data from 22 Northern Hemisphere locations to illustrate there has been no net warming since the 1940s.

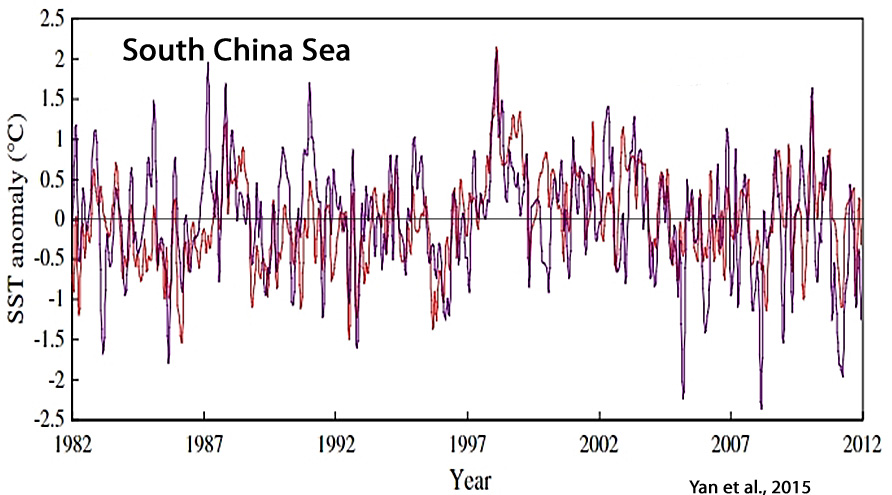
Of note, consider how closely the Stoffel et al. (2015) NH reconstruction resembles the trends in total solar irradiance since the 18th century, including almost identical timings and amplitudes for the 20th century.
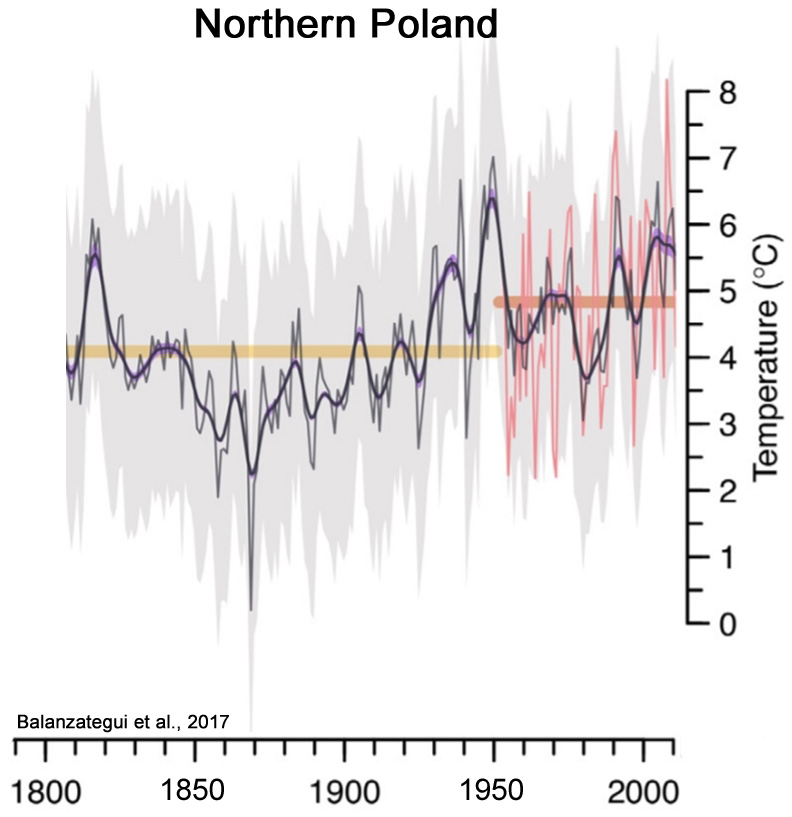
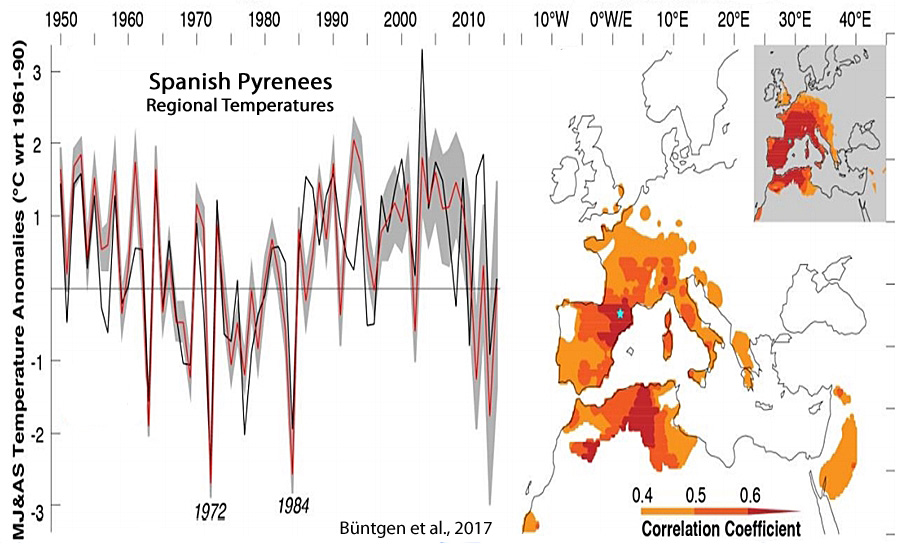
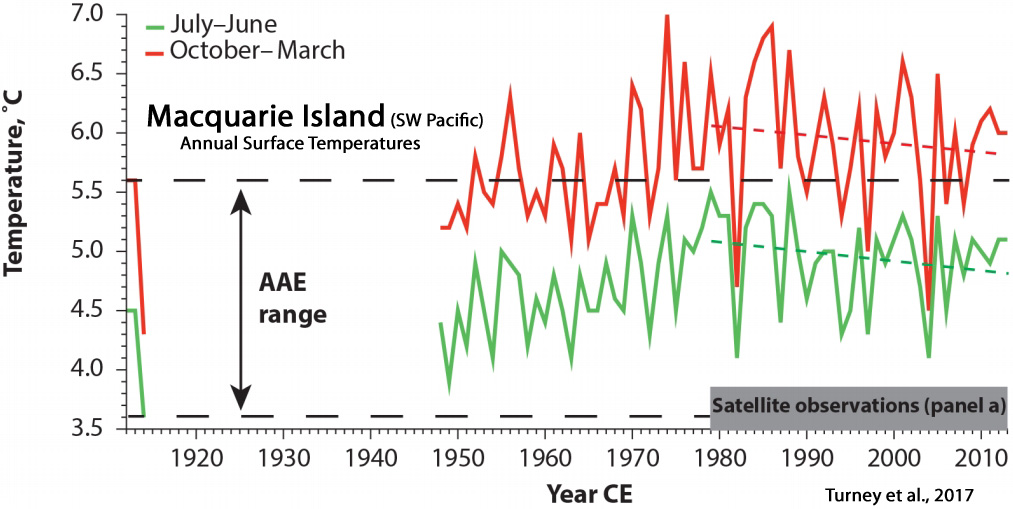
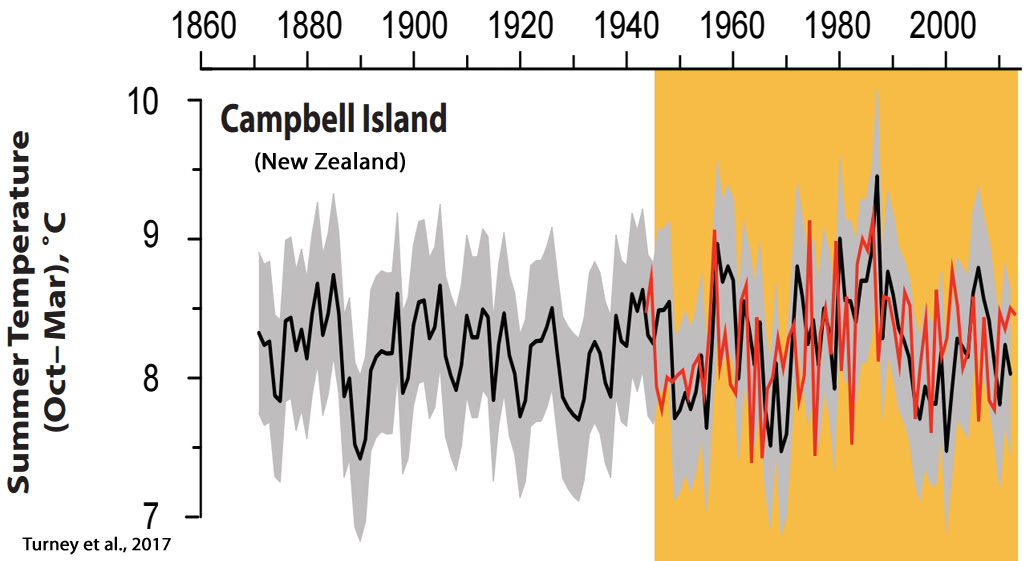
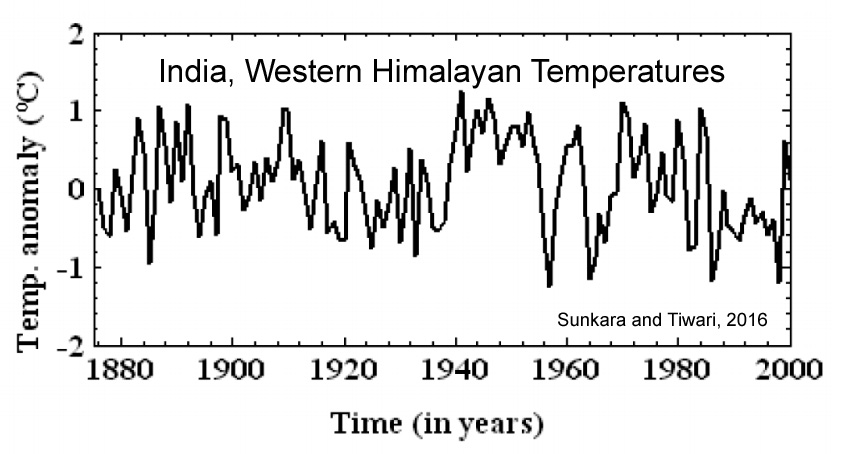
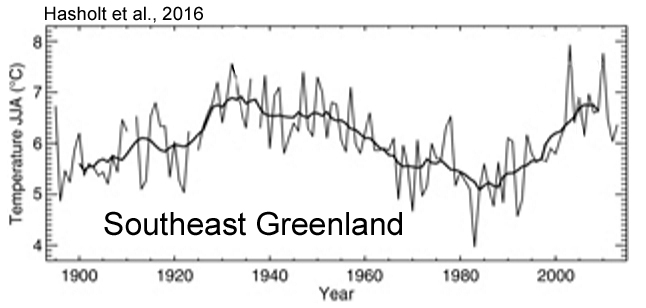
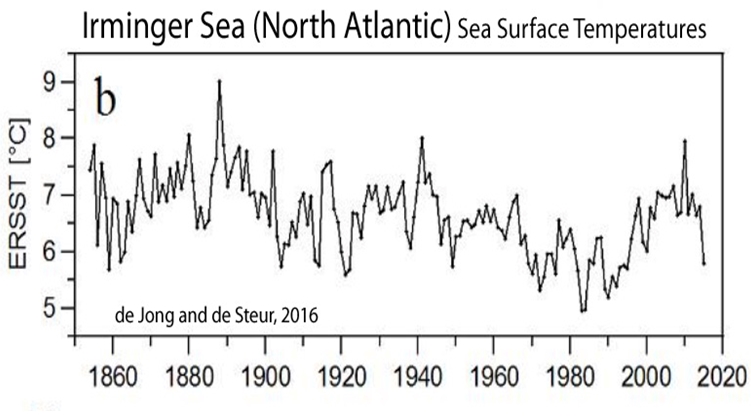
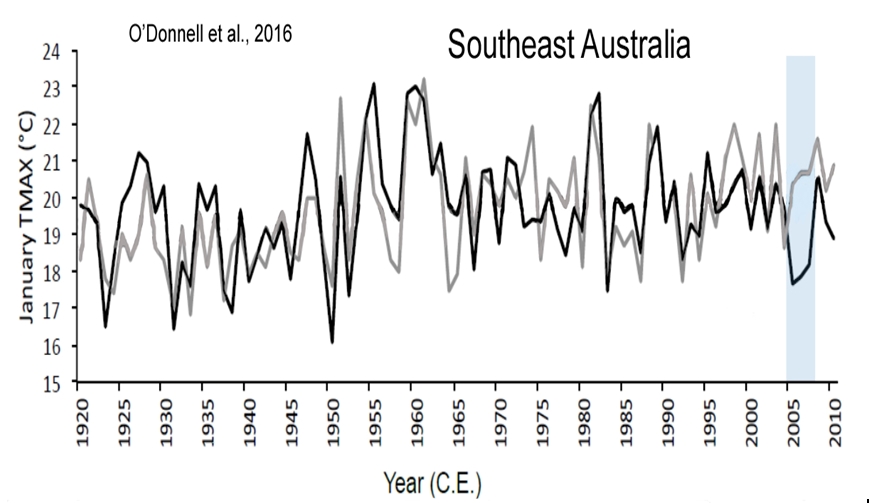
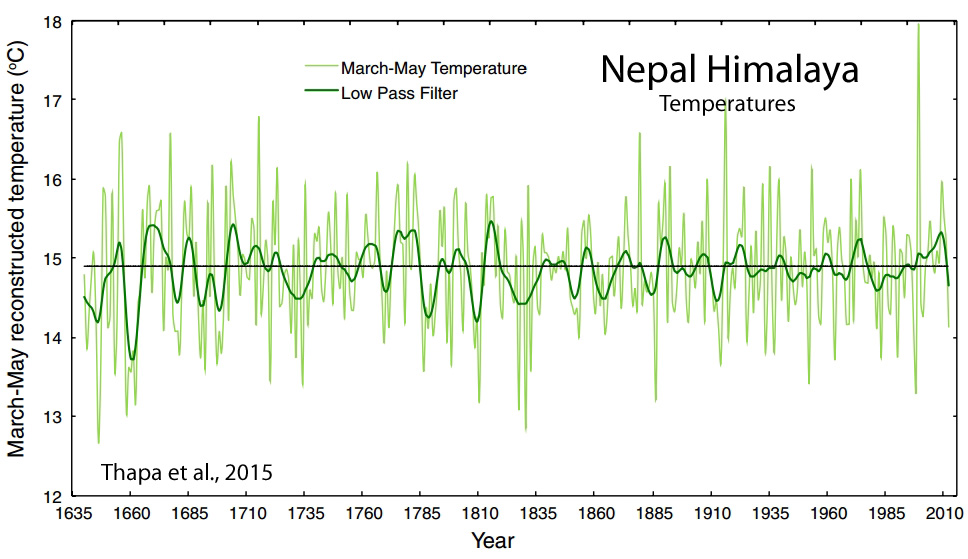
Below are selections from a much larger collection of graphs taken from recently published papers that also document a lack of any net warming since the mid-20th century…from both hemispheres.
With the large and growing discrepancy between the instrumental record that hides the decline and the proxy evidence from tree-rings and ice cores that doesn’t, one wonders how much longer the illusion of a linearly warming Earth may continue to be promulgated.
Balanzategui et al., 2017
Büntgen et al., 2017
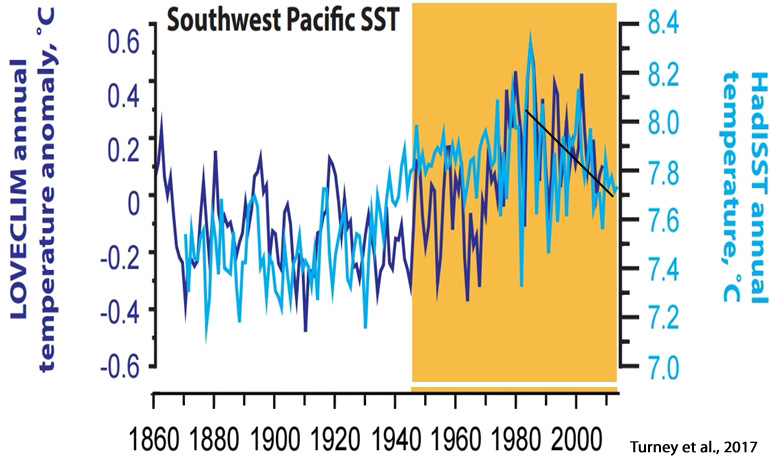
Turney et al., 2017
“Occupying about 14% of the world’s surface, the Southern Ocean […] … a cooling trend since 1979.”
Zywiec et al., 2017
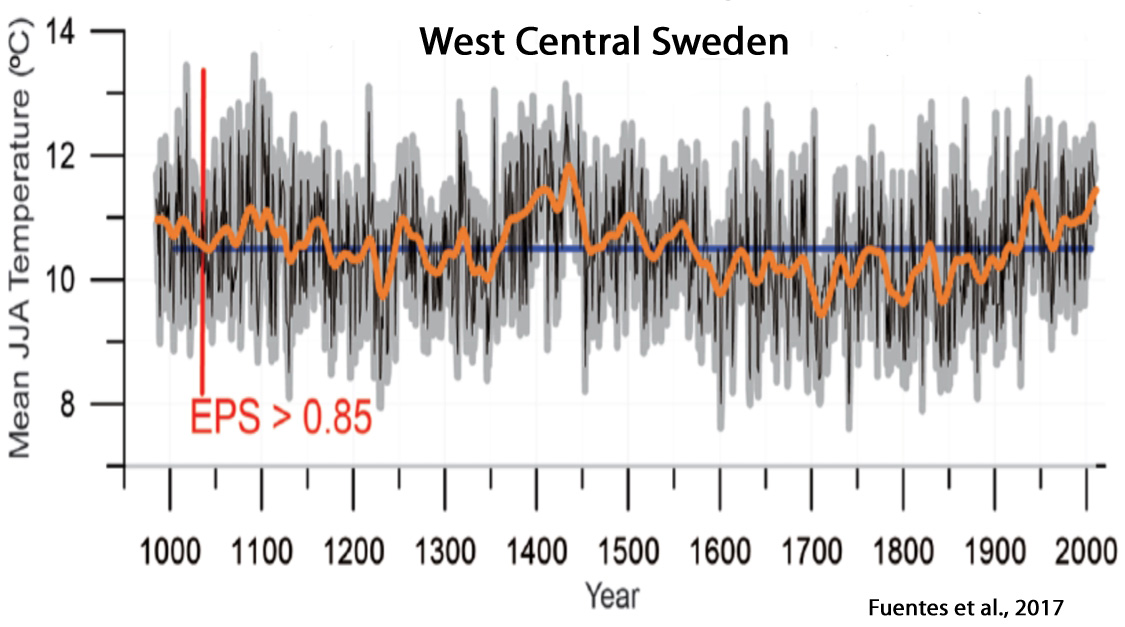
Fuentes et al., 2017
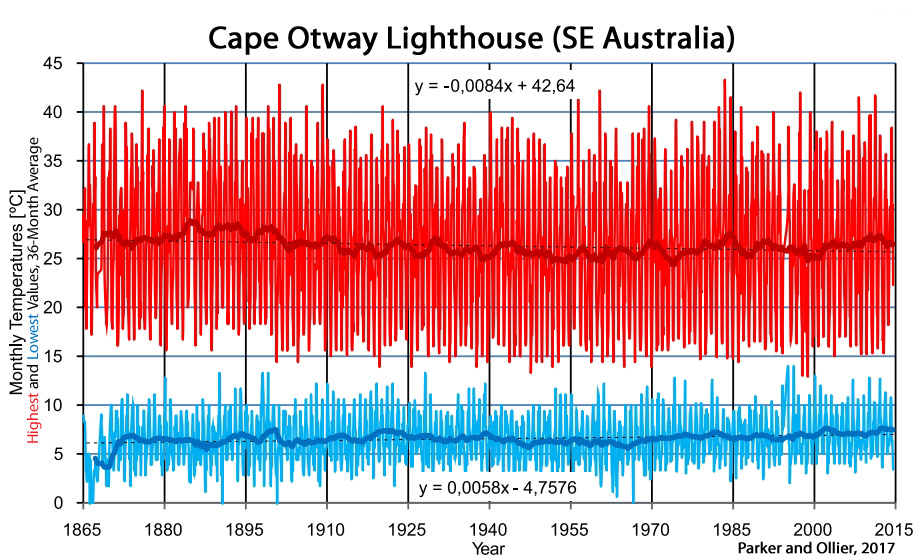
Parker and Ollier, 2017

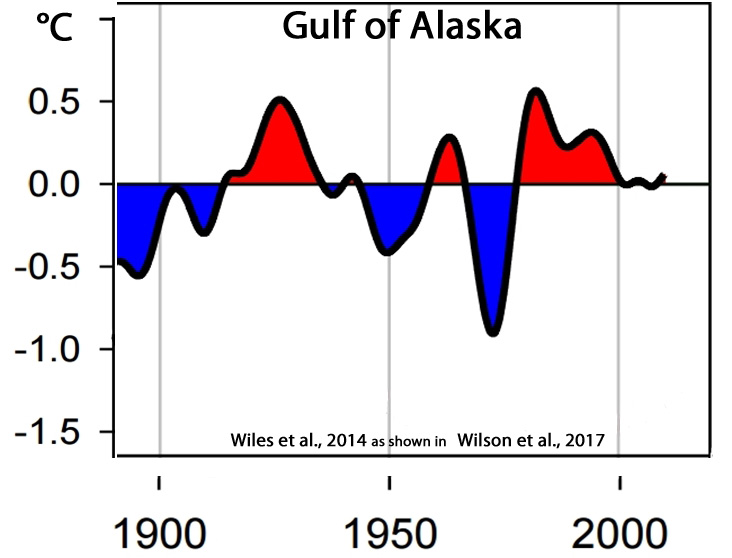
Wilson et al., 2017

Tejedor et al., 2017

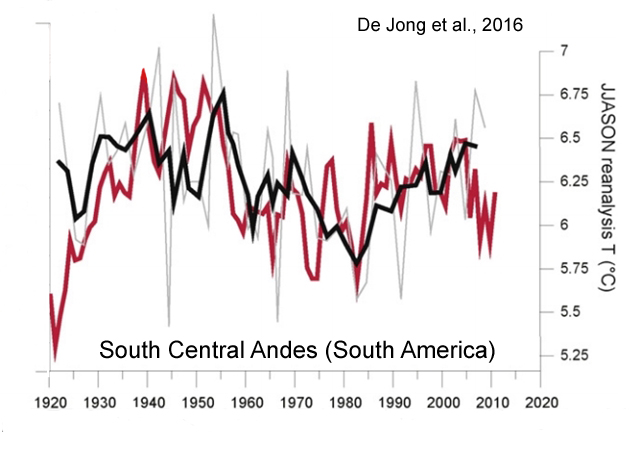
De Jong et al., 2016
“[T]he reconstruction…shows that recent warming (until AD 2009) is not exceptional in the context of the past century. For example, the periods around AD 1940 and from AD 1950–1955 were warmer..”
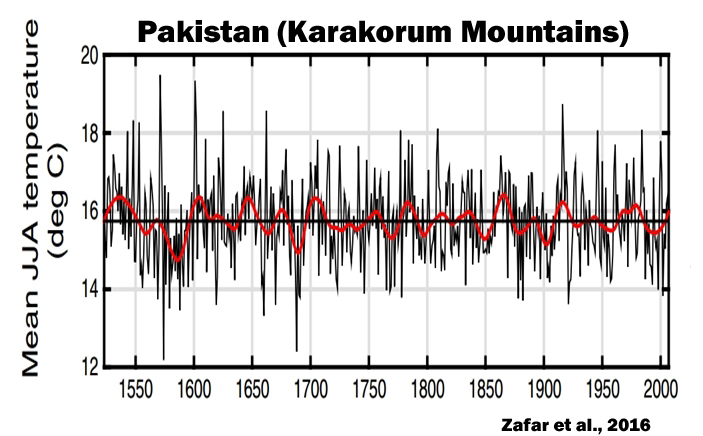
Zafar et al., 2016
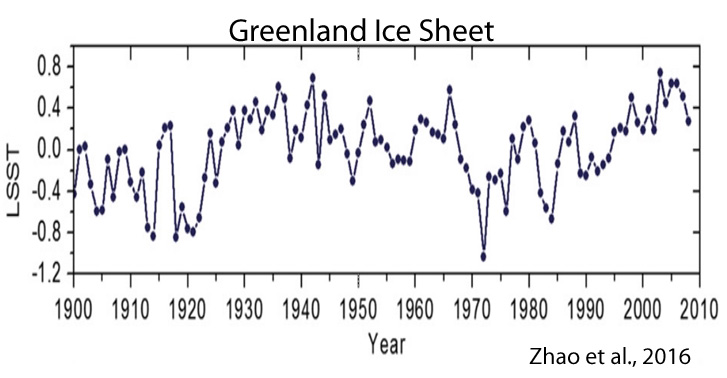
Zhao et al., 2016
Sunkara and Tiwari, 2016
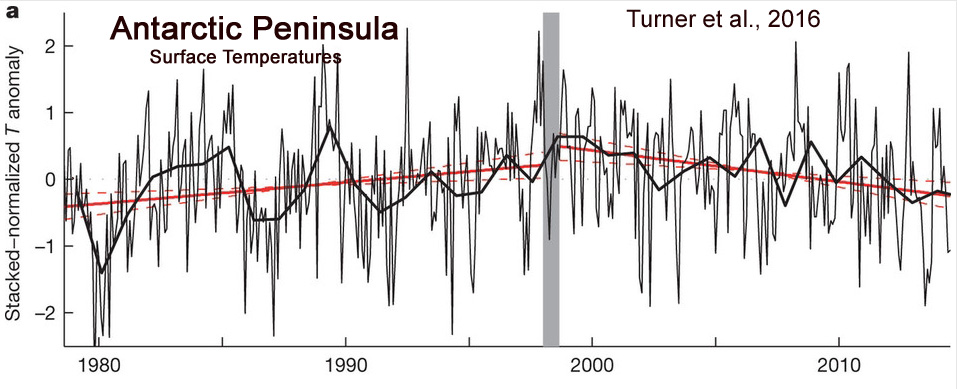
Turner et al., 2016
“Absence of 21st century warming on Antarctic Peninsula consistent with natural variability”
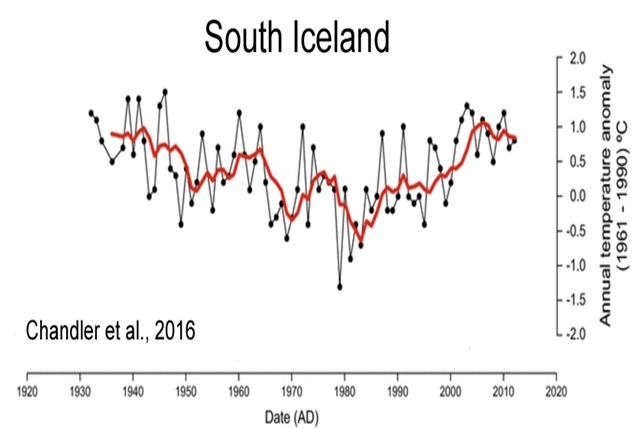
Chandler et al., 2016
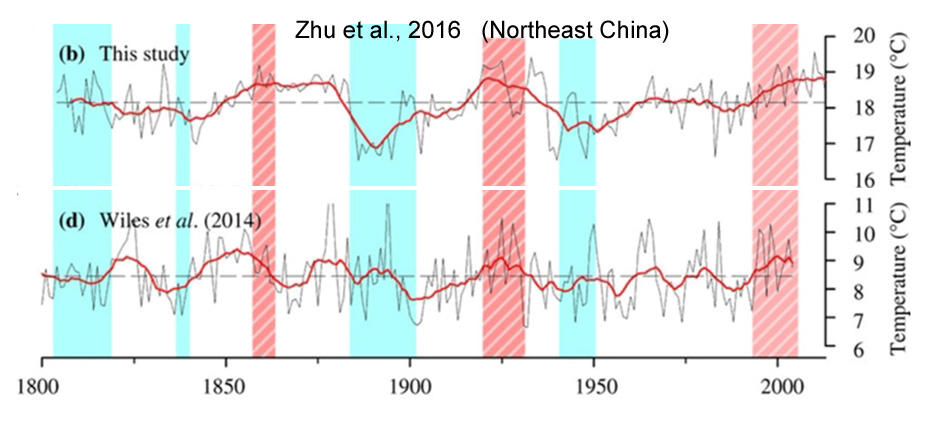
Zhu et al., 2016
Hasholt et al., 2016
de Jong and de Steur, 2016
O’Donnell et al., 2016
Christy and McNider, 2016

Thapa et al., 2015
“[T]emperature in Central Asia and northern Hemisphere revert back towards cooling trends in the late twentieth century.”
Yan et al., 2015
Wei et al., 2015


You know you want to watch it…
https://www.youtube.com/watch?v=dul_hYde0nk
(-;|
And there’s a simple graphic to explain the Mannian method.
https://co2islife.files.wordpress.com/2017/07/adjustocene_scr.jpg
🙂
Very good compilation of indisputable facts. Well, indisputable as long as you are a sentient reasoning being.
And they show that Mann’s hockey stick nonsense is just that, utter undeniable nonsense!
Unbelievable, you still believe their proxy record actually goes to the year 2000 because they say it is.
You have seen the overlay of the Moberg proxy data over the Marohasy proxy data and should have noticed that both are identical, except that the Moberg data needs to be scaled by 10% and shifted/stretched to the present by 35 years to correctly “match” their graph.
What more evidence do you need that Marohasy made a mistake?
Then you show us other graphs and claim they are similar to that Marohasy proxy. They are not. I combined their proxy with the Schneider 2015 proxy: http://imgur.com/a/RiCKO
Do you think they look similar? They aren’t …
What does Moberg (2005)data have to do with the proxy data used by Marohasy and Abbot in 2017? As shown above, other data sets that use 126, 91, 66, 22, 15…different proxy temperature records from across the NH also devise curves that go through to the year 2000 that don’t look like Moberg’s 2005 reconstruction either. Should we assume that all those hundreds of reconstructions got it wrong every time too?
You keep claiming that they somehow composed their own NH proxy data record. In their paper, they state that they digitized proxy data and it is obvious which proxy data they digitized … only they made a mistake while doing that and thus their resulting graph is stretched/shifted.
And don’t get me started on the other graphs you present here as if they would show a peak in 1980 and then a decline. They don’t.
You write (regarding Xing 2016):
Either you are blind or you are seeing a different graph than this one: https://notrickszone.com/wp-content/uploads/2017/08/Holocene-Cooling-Northern-Hemisphere-Xing-2016-Instrumental-.jpg
You write:
The green line is not proxy data and this graph (figure 8 in their paper) clearly demonstrates that their proxy data ends in 1960, too.
You write:
There is flattening after the 1980s in that reconstruction. Here is a closeup: http://imgur.com/a/RiCKO (red line is the instrumental record, the divergence problem is clearly visible). The Marohasy proxy doesn’t look like this reconstruction at all … you know why? Because it is stretched/shifted.
And it goes on like this …
The details? From their paper: “Published graphical temperature proxy reconstructions were digitized using UN-SCAN-IT software. Table 1 gives a summary of the temperature proxy reconstructions used for analysis.”
Since it is the same curve as Moberg (but stretched/shifted) they obviously made a mistake digitizing it.
Are you blind? (Honest question)
What do you see in this graph comparison?
http://imgur.com/a/3ZEZY
No, they didn’t “compose” their own proxies–and I have never claimed that. They used/compiled the proxies already available from among the hundreds on record. Some of those may have overlapped with the proxies used by Moberg (2005), but M05 is one of several dozen NH reconstructions drawn up in the last 15 years, so it’s highly likely didn’t limit themselves to the data from MO5, which is much older and less extensive than the evidence available from the last decade.
Considering there are hundreds of NH proxies that also show a decline in NH temperatures after ~1980 (i.e., consider Xing et al., 2016, who used 126 proxies alone and showed a dramatic temperature decline after 1980, or D’Arrigo et al., 2006, who also showed a decline after 1980 using 66 proxy locations), the conclusion that you and Gavin have reached about A & M (2017) making up their own proxy data or making a digitization “mistake” because the proxy evidence they use shows a decline after 1980 is rooted in no more than speculation and a desire to smear and discredit.
This is your version of an honest question? It’s sad you feel the need to so regularly slink off with ad hominems when you’ve been shown to be wrong.
Just one last try to convince you:
http://imgur.com/a/Yg5es
Do you notice the similarities between both proxy data graphs? Do you notice the horizontal offset of the A & M graphs?
How can you still claim that they haven’t made a mistake “digitizing” the data (despite it being available as an easy parseable table)?
Kenneth,
From Jennifer’s own blog —
No, the A & M graph of the NH is taken directly from a chart from a 2009 paper which improperly shifts the end year (2000) to the end of the proxy record from Moberg et al. (2005). Moberg’s proxy data ends in 1979, and then the hockey-stick shaped instrumental data is tendentiously grafted onto the end of the proxy record so as to hide the decline.
A & M would have been much better served had they used NH reconstructions that do NOT hide the decline with manipulated instrumental data. For example:
https://notrickszone.com/wp-content/uploads/2017/06/Holocene-Cooling-Northern-Hemisphere-Schneider-2015-Wilson-2016-Long.jpg
–
https://notrickszone.com/wp-content/uploads/2017/04/Holocene-Cooling-Northern-Hemisphere-Stoffel-2015.jpg
It was an oversight. A & M apparently just assumed the Geirsdottir et al. (2009) accurately represented the Moberg et al. (2005) reconstruction to 2000 (as it shows). They didn’t. They (Geirsdottir et al.) should have made the graph end in 1979, not 2000. So A & M pay the price with vicious criticisms that they “faked” their data when they were just copying the graph from another paper that they assumed was accurate.
Lost in all this? The point of the paper, which was that temperature variations naturally meet or exceed the variations observed since the 1800s, rendering the detection of an anthropogenic signal or a high sensitivity to CO2 concentration variations questionable at best.
Please remove (ignore) comment in moderation I see where Moberg et al. (2005) is embedded in the Aslaug Geirsdottir et al (2009) paper.
Yes, there are hundreds of NH proxies that do collectively show a decline after 1980. But the peak for the 20th century was in the 1940s. For example:
Schneider et al., 2015 as shown in Wilson et al., 2016 – peak warming in the 1940s, cooling to the 1970s, then warming until the 1980s and no warming after that.
https://notrickszone.com/wp-content/uploads/2017/08/Holocene-Cooling-Northern-Hemisphere-Schneider-2015-Wilson-2016.jpg
–
Xing et al., 2016 – peak warming in the 1940s, cooing after that until the 1970s, then cooling after the 1980s and into the 1990s.
https://notrickszone.com/wp-content/uploads/2017/08/Holocene-Cooling-Northern-Hemisphere-Xing-2016-Tree-Rings.jpg
–
D’Arrigo et al., 2006 – peak warming through the 1930s and 1940s, cooling after that, a slight warming until about 1980, and then cooling after that again.
https://notrickszone.com/wp-content/uploads/2017/08/Holocene-Cooling-Northern-Hemisphere-DArrigo-2006.jpg
–
Stoffel et al., 2015 – peak warming in the 1930s and 1940s, cooling through the 1970s, warming after that that doesn’t quite reach the amplitude of the pre-1950s warming
https://notrickszone.com/wp-content/uploads/2017/04/Holocene-Cooling-Northern-Hemisphere-Stoffel-2015.jpg
–
Christiansen and Lungqvist, 2012 – peak warming through the 1940s, cooling after that through the 1970s, then a warming through 2000 that doesn’t quite reach the amplitude of the 1940s.
https://notrickszone.com/wp-content/uploads/2017/08/Holocene-Cooling-Northern-Hemisphere-20th-Century-Christiansen-Ljungqvist-2012.jpg
You’re welcome to continue denying what is shown in these graphs taken from hundreds of proxy locations (the Arctic, North America, Europe, Greenland, Scandinavia, Russia, etc). They show a temperature decline after the 1940s that is highly inconsistent with the CO2 emissions rise from humans. I understand why you find this problematic.
CO2 emissions rose from 1 GtC/yr in the 1940s to 8 GtC/yr by 2000…and yet NH temperatures were higher in the 1940s than in 2000…or at least there was no net difference. This is incompatible with your side’s models. So what do they do? Change the data. Insert highly adjusted instrumental data to hide the decline with tricks that they hope to keep secret by telling one another to erase their e-mails to guard against FOIA confiscation. Why would they do that if they didn’t have something to hide?
Aren’t you the least bit suspicious as to why they tried to hide their “correction” tricks?
I am a bit curious why you moderators “hide my replies” …
By the way, SebastianH, why do you think it was so important for Phil Jones and Michael Mann to hide the decline in temperatures by inserting instrumental records (showing abrupt warming) into their post-1960s and post-1980s NH graphs?
Could it be because they recognized that tree-ring records show a decline in temperatures after the 1980s – just as Marohasy has noted in the press release for her paper?
If not, why else does the extensive proxy evidence from so many reconstructions (i.e., 126 locations, 66 locations, etc.) show temperatures leveling off or declining after 1980? Do you think it’s possible the tree ring data was correct up until about 1960-’80, and then the data somehow became wrong after that?
Or could it be that the temperature data set overseers didn’t want their reconstructions to depict declining temperatures after the 1960s-1980s period, and thus they hid the decline by grafting in their heavily adjusted instrumental records with “mostly made up” data for large regions of the globe (i.e., the SH sea surface temperatures)?
Because this is what it looks like they did.
Do you think it’s reasonable for skeptics to suspect that this is what happened, given the uncovered let’s-hide-the-decline conversations?
You mentioned the divergence problem in your post. Did you put it in quotes because you think it is some funny AGW invention?
A number of things are possible that makes tree rings proxies diverge from the instrumental record beginning in the 1960s. Global temperature decoupled from solar radiation in the 1960s (http://iopscience.iop.org/article/10.1088/1748-9326/7/3/034020/pdf), there was global dimming/brightening. Maybe tree rings aren’t just dependent on temperature alone. Etc … read up on the divergence problem and you can find many possible reasons.
Nope: http://rationalwiki.org/wiki/Climategate
No. It was put in quotes because that’s we writers do when we are distinguishing a particular word in a sentence. Dr. Marohasy also used quotes with “divergence problem”.
Isn’t it odd that the divergence didn’t seem to be problematic until the 1980s and 1990s, when global warming was all the rage? Prior to that, when global cooling was the concern, there was no divergence between the instrumental record and proxy evidence. It’s uncanny how the divergence just appeared, seemingly out of nowhere, at the same time that global warming first gained momentum as a monumental “problem”. Do you think it’s even possible that that the reason the instrumental record diverges from proxies in the 1980s is because the scientists are doing exactly what they’re saying they’re doing — hiding the decline? I mean, it stretches the bounds of credibility to think that it’s anything else.
“…you really ought to replace the values from 1961 onwards with observed [instrumental] temperatures due to the decline.”
What do you think it means to replace the proxy values from 1961 onwards with instrumental temperatures due to the decline? What’s the cover-up interpretation?
“I’ve just completed Mike’s Nature trick of adding in the real temps to each series for the last 20 years (ie from 1981 onwards) amd from 1961 for Keith’s to hide the decline.”
Why would they use Michael Mann’s Nature (the journal he published his trick in) to hide the decline in temperatures after 1961 and 1981?
“Also we have applied a completely artificial adjustment to the data after 1960, so they look closer to observed temperatures than the tree-ring data actually were” …. “Also, we set all post-1960 values to missing in the MXD data set (due to decline), and the method will infill these, estimating them from the real temperatures – another way of ‘correcting’ for the decline, though may be not defensible!”
Why would a “completely artificial” adjustment to the temperature after 1960 “due to decline” need to be made? Why would it possibly not be defensible to be “‘correcting’ for the decline?
Do you think that skeptics are going to fall for your defense of these damning conversations? Why are you not the least bit skeptical of comments like these?
Wow, now you go full conspiracy … don’t you think that is a bit weird for a skeptic who says he is agnostic?
I’ll just repeat the link: http://rationalwiki.org/wiki/Climategate
http://www.informationliberation.com/?id=28353
“If you want to know the truth about Climategate, definitely don’t use Wikipedia.”
“The guy who has been writing Wikipedia’s entry on Climategate (plus 5,000 others relating to ‘Climate Change’) is the bosom buddy of the Climategate scientists.”
Um, since I am unfamiliar with what you might be referring to when I point out what is common knowledge with regard to what Hide the Decline actually means…
https://notrickszone.com/wp-content/uploads/2017/08/Hide-the-Decline-Using-Mikes-Nature-Trick.jpg
…I’m curious as to what you expect me to think is “a bit weird” for skeptics. Even Dr. Muller, who is on your side of the aisle, addresses Hide the Decline in exactly the way we have here.
Climategate ‘hide the decline’ explained by Berkeley professor Richard A. Muller
It’s as if you are a badly written bot with insufficient language parsing that replies with canned answers.
That’s not a Wikipedia link.
It’s worse. It’s a RationalWiki link, a website that shamelessly extols Michael Mann and maintains a smear list of “Notable Deniers”. It’s a full-blown advocacy site that refers to anyone who questions the hockey stick graph as a “denier”.
Typical RationalWiki commentary: “Steve McIntyre and Ross McKitrick, neither one an actual climatologist (the former a crank blogger and the latter an economist, to be specific)…”
Do you honestly believe anyone here would regard a smear site like that as a neutral source of unbiased information? You’re so far immersed into that ideology that you probably view that advocacy site as unbiased and objective. Right?
Also Kenneth,
The paper “Harmonic Analysis of Worldwide Temperature Proxies for 2000 Years” by Horst-Joachim Lüdecke1 & Carl-Otto Weiss (https://benthamopen.com/FULLTEXT/TOASCJ-11-44).
Their aggregated temperature reconstructions to a global mean they call G7, and reconstruction from the teased out harmonic structure of the temperature variations from the proxy records, both shown in the graphic Figure 3, are very similar to Abbott & Marohasy’s.
https://benthamopen.com/contents/figures/TOASCJ/TOASCJ-11-44_F3.jpg
Yet another paper that does not support Mann’s hockey stick temperature uplift, and correctly shows the well documented MWP.
I think my comment is in the spam bin again…
It is more fundamental than you state.
In the climategate emails, they mention that the tree rings did not show the 1970 warming. It is not that they showed a decline in the 1980s, but rather that there was no recovery in the 1970s from the 1940 to 1970 cooling, whereas the adjusted thermometer record had by this stage (late 1990s) removed much of the cooling and showeed substatntial warming from the early 1970s and throughout the 1980s and continuing through the 1990s.
But of course, we know from the satellite data (which did not undergo the endless adjustments that the land based thermometer record underwent in the 1980s and 1990s) that there is no statistical warming between 1979 and the run up to the super El Nino of 1997/98, so that is why Mann could not use the tree ring data.
At the time of the Mann paper (this coincided with the Super El Nino but before the step change in temperature coincident with that event had taken place), the tree rings showed no warming from 1970 through to circa 1996/97 whereas the adjusted land thermometer record showed relentless warming.
Mann had discovered that the way in which the Team had adjusted the land based thermometer meant that it had significantly diverged from reality.
One must remember that prior to the endless adjustments to the land based thermometer record, both Phil Jones in 1980 and Hansen in 1981 accepted that the Northern hemisphere temperatures as at 1980 were some 0.3 to 0.4 degC cooler than they were in 1940.
If there was no warming between 1980 and say around 1996 (the last date for the tree rings) as the satellite data suggested then the paper should have concluded that the Northern Hemisphere was still some 0.2 to 0.4 degC cooler than it was in 1940.
The tree ring data would have supported that, but of course, this did not fit with the meme of cAGW, and hence the splice on of the adjusted land thermometer record which had been so heavily adjusted that it diverged significantly from reality.
Even with the step change coincident with the 1997/98 Super El nino, it is probable that the Northern hemisphere is no warmer today than it was in 1940.
There has been no significant warming after the 1920 to 1940 warming, merely multidecadal variations; some ups and some downs and we are now back where we were in 1940..
No warming between 1980 and 2000? http://images.remss.com/msu/msu_time_series.html
I guess there is no possible way to convince you that global warming is real, is there? We just have to wait 50 years and see what proxy data and instrumental data then shows us about this period of time.
According to large volumes of proxy evidence from the NH, yes, there was little to no warming — even cooling — between the 1980s and 2000s. Hence the need to hide the decline. This is referred to as the “divergence problem”, and it’s why Moberg et al. (2005) inserted instrumental data from 1980 to 2000 rather than continue using the proxy evidence. That way they could make the record show an abrupt warming occurred after 1980 rather than going with the proxy evidence that showed no warming or cooling during this time.
–
–387 NH proxies (cooling after the 1960s through the late 1990s)
https://notrickszone.com/wp-content/uploads/2017/08/Holocene-Cooling-Northern-Hemisphere-Briffa-2002-Divergence.jpg
–
126 NH proxies (cooling from the 1980s to 2000): https://notrickszone.com/wp-content/uploads/2017/08/Holocene-Cooling-Northern-Hemisphere-Xing-2016-Tree-Rings.jpg
–
66 NH proxies (cooling from the 1980s to 2000): https://notrickszone.com/wp-content/uploads/2017/08/Holocene-Cooling-Northern-Hemisphere-DArrigo-2006.jpg
–
15 NH proxies (no warming from the 1980s to 2000): https://notrickszone.com/wp-content/uploads/2017/08/Holocene-Cooling-Northern-Hemisphere-Schneider-2015-Wilson-2016.jpg
Much of the globe is warmer now than it was for much of the period between 1450 and 1900 known as the Little Ice Age, especially due to the 1920-’40 warming event. The LIA had centennial-scale records of solar minima and high volcanic activity, both of which contributed to the cooling. Since then, the 20th century Grand Solar Maximum and low volcanic activity have substantially contributed to the rise in temperatures for much of the Earth (some regions, such as Arctic Canada, have not warmed at all in the last 150 years, and Antarctica was warmer than now during the LIA, so it probably shouldn’t be called “global” warming). The reduction in cloud cover since the 1980s can easily explain any warming via radiation budget imbalances.
Your plot distorts the position, since it includes the step change coincident upon the Super El Nino of 1997/98, and therefore does not answer the point I made.
The point I made is that at the time of the Mann paper (MBH98) in the satellite data there was no statistically significant warming between 1979 and the run up to the Super El Nino of 1997/98.
If you look at your plot, my point is made out, since there is a slight positive trend of up to about 0.1degC in a period of about 17 years, and that is not statistically significant. You cannot increase the very slight positive trend by including the step change in temperature of about 0.3 degC coincident with the 1997/98 Super El Nino, since that event had yet to occur at the time when MBH98 was written!!!
It may have warmed by 0.1degC in those 17 years, or it may not have warmed at all during those 17 years, or indeed, it might have cooled very slightly. The fact is that we simply do not know. From a scientific perspective all we can conclude and say is that there is no statistically significant warming as from inception of the satellite record (1979) and the run up to the Super El Nino of 1997/98.
The Tree ring data of course agreed with the satellite, namely that there was no statistical warming between 1979 and about 1996 (the end date of the tree ring data), and we know from the climategate emails, that the tree ring data showed no 1970s warming at all. There being no warming during the 1970s is actually stated in those emails.
Mann had discovered that the relentless adjustments made to the land based thermometer record had caused that record to diverge from reality, and he had identified a need to re-examine the land based thermometer record and to consider the accuracy and efficacy of the numerous adjustments made to the record between 1980 and 1997 that had caused the land based thermometer record to diverge.
Shame he never acted like a genuine scientist and investigated that point. The MBH98 paper could have been an important scientific paper if only it had addressed and investigated the divergence and examined closely all the adjustments made to the land thermometer record as from about 1980 onwards.
That was a real missed opportunity, and one that would have genuinely enhanced his reputation. History is likely to judge him very badly on this missed opportunity.
Marohasy’s conclusions about proxy temperatures are routinely verified in the scientific literature.
The conclusions I was referring to was that there has been a temperature decline in both the 1960s and after the 1980s in large volumes of proxy evidence from the NH. This is why the data set overseers have to Hide the Decline to cover it up.
The source of the 1979 vs. 2000 scaling issue is from the paper by Geirsdottir et al., 2009, who wrongly demarcated the year 2000 as parallel to the end of the proxy record (see graph link below), which should have been 1979 (not 1965–no idea where that year came from) and not 2000. (Moberg et al. proxy records stop at 1979. Instrumental records are grafted on after that.)
The NH reconstruction for the Abbot and Marohasy (2017) paper was apparently taken directly from Geirsdottir et al. (2009) and re-colored to match the other graphs from Abbot and Marohasy (2017). A & M reference about 20 NH proxy location papers in their bibliography, so I wrongly made the assumption that perhaps the reason for the resemblance to Moberg et al. (2005) but not perfect match (years) was because they added several more proxies to the shape of their graph. In reality, it looks as though an honest mistake was made in using a graph with the end year in the wrong place from another source.
Moberg et al. (2005) is a notorious Hide the Decline paper in that they inappropriately inserted instrumental data for 1980 to 2000 onto the end of their proxy record (again, to hide the decline in temperatures that regularly appear after 1980 and thus need to be covered up to maintain the “rapid warming” illusion). It should not have been used for this paper because the authors were clearly decrying the practice of inserting instrumental data onto proxy graphs to conceal declining temperatures…and correctly noting that most proxy data shows cooling after 1980.
Had the authors used Schneider et al., 2015 or Stoffel et al., 2015 – reconstructions that don’t insert instrumental data onto the end of their records to hide the cooling – they could have clearly supported their case for a modern climate that still falls well within the range of natural variability.
Unfortunately, because they used a graph that hides the post-1980s decline (but didn’t know they were doing so?), this provided the opportunity for Gavin Schmidt and those like him to excoriate Dr. Marohasy for “faking” data – even though she and her co-author did no such thing.
The practice of tendentiously mixing instrumental data with proxy data is clearly inappropriate, but this is what must be done to hide the decline and maintain the linearly (and rapidly) warming narrative.
I have contacted Dr. Marohasy and we shall see what happens next.
https://notrickszone.com/wp-content/uploads/2017/08/NH-Scaled-Forward-From-1979-to-2000.jpg
See, that wasn’t so hard, was it?
Don’t gloat, chatbot. The mistakes you and your fellow warmist trolls make, and never admit or even bother to correct, far exceed any Kenneth has.
Surely you can list some mistake of a “warmist troll” or me that was never corrected?
It will be fun to watch what happens when Kenneth finally finds out that his assumptions about what contributes to the increase of the CO2 concentration and what not, is incorrect too. Or when he finds out how the oceans interact with the CO2 in the air. Or how the greenhouse effect actually works.
Will he become a skeptic of skepticism then and finally begin to question the motives (and knowledge) of his fellow skeptics? 😉 Him being an agnostic, I wouldn’t rule it out completely …
Almost everything you write.
1. Claiming that there is no energy poverty in Germany because welfare covers people’s heating bills. (6.9 million Germans live in energy poverty.)
2. Claiming that an “exponential” rise in solar and wind energy use will mean that wind and solar will supplant fossil fuel consumption sometime during the next 10-13 years (SebastianH:”‘takeover’ will happen in 2030 at current growth rates. In that year the entire (world wide) increase in energy consumption will be covered by renewable increase. 1-2 years before that more than half of the increase will be covered.“), not understanding that fossil fuels will need to actually be displaced by solar and wind (and not continue to grow along with them) for the consumption share to reach the proportions you have claimed.
3. Claiming that West Antarctica/Peninsula has been warming at 10 times the rate of the rest of the world…even though it’s been cooling at a rate of − 0.47 °C/decade during 1999–2014…to the extent that the trend is actually one of overall cooling dating back to 1979 (according to newly published science).
4. Refusing to acknowledge that there is no controlled scientific experiment involving both CO2 and water that affirms that CO2 causes water to cool when its concentration is decreased above a body of water (or the inverse), and if so, how much. In other words, you refuse to acknowledge that there are no real world physical measurements that affirm your views. Instead of acknowledging that you have no such evidence or any physical measurements from a real-world experiment, you falsely claim that your views about decreasing CO2 causing water to cool are “basic physics” anyway. You just can’t bring yourself to admit the obvious.
5. Refusing to acknowledge (and actually defending) the statistical malpractice of comparing an 8,000-year long-term trend line to a 50-year snapshot – a scam that Rosenthal et al. (2013, 2017) employed to claim that ocean temperatures (0-700 m) have changed more rapidly since the 1950s than at any time during the Holocene. When I pointed out the statistical malpractice involved, you refused to accept that this is inappropriate and even defended it. (SebastianH: “I’ve read the Rosenthal 2017 paper, did you? Because then you would know that the rate of change today is far higher than in any other time in the last 12000 years.”)
6. Defending the Michael Mann paper that is fraught with statistically illogical and unsupportable claims and fully debunked by a Ph.D. statistician. You cannot bring yourself to admit that that paper is junk science at its worst…because you agree with it.
http://wmbriggs.com/post/17849/
“The Four Errors in Mann et al’s “The Likelihood of Recent Record Warmth“
7. https://notrickszone.com/2017/06/29/evidence-review-suggests-humans-may-not-be-the-primary-drivers-of-co2-concentration-changes/#comment-1220640
“SebastianH ultimately relies repeatedly on the thoroughly discredited pseudo-mass balance argument, that says that if CO2 levels increase by less than the sum total of what we have put in over the years, then the increase is due to us. This is a fundamental misunderstanding of dynamic processes, in which outflow is proportional to all inflow. I.e., sink activity is stimulated by source activity.”
8. SebastianH: “If the ocean heat change is the result of an average forcing of X and we have such a forcing to attribute that to, then 100% of the change is caused by that forcing.”
No words.
Steve McIntyre exposes Mann’s deception.
https://www.youtube.com/watch?v=SqzcA7SsqSA
Warmists are scoundrels!
Not so much professional kriging of two groups of results together more like a ham-fisted and schoolboy attempt to staple the instrumental series over the inconvenient tree-ring data.
🙂
It is weird that you guys (again) argue that all the data is fake anyways and that there is no global warming (decline after 1980?) … why bother to argue against anything else when this is your core belief?
No one has written that “all the data [are] fake anyways”. Those are words you made up.
The proxy record (500+) clearly shows a temperature decline after the 1960s through to the 2000s. That’s why instrumental records have to be inserted onto the end of proxy graphs to “hide the decline” (i.e., Moberg et al., 2005), which is what “Mike’s Nature trick” is. That’s what “Hide the decline” means.
–
387 NH proxies (cooling after the 1960s through the late 1990s)
https://notrickszone.com/wp-content/uploads/2017/08/Holocene-Cooling-Northern-Hemisphere-Briffa-2002-Divergence.jpg
–
126 NH proxies (cooling from the 1980s to 2000): https://notrickszone.com/wp-content/uploads/2017/08/Holocene-Cooling-Northern-Hemisphere-Xing-2016-Tree-Rings.jpg
–
66 NH proxies (cooling from the 1980s to 2000): https://notrickszone.com/wp-content/uploads/2017/08/Holocene-Cooling-Northern-Hemisphere-DArrigo-2006.jpg
–
15 NH proxies (no warming from the 1980s to 2000): https://notrickszone.com/wp-content/uploads/2017/08/Holocene-Cooling-Northern-Hemisphere-Schneider-2015-Wilson-2016.jpg
Mann to this day refuses to release his data and methods even when ordered by a court to do so. https://www.spartareport.com/2017/07/michael-mann-refuses-hand-data-judge-climate-change-trial/
Thus Mann’s hockey stick is not science because the modern scientific method requires transparency so that outside researchers can test the hypothesis by reproducing results (or failing to) by experiment or their own review of the raw data and calculations and review of the methods used.
Mann’s hockey stick hypothesis cannot be tested because he refuses to release the information and data required to do so, and so is not science.
Really? Because it took like 20 seconds to find it: http://www.realclimate.org/index.php/data-sources/#Reconstructions
You guys should get over this “hockey stick isn’t real” idea. The instrumental record goes back far enough so one can combine it with proxy data. Both match pretty well until the 60s, then they deviate from each other suggesting it’s not temperature alone that determines the size of the tree rings.
Go on, test it! Here is the data and code for the 2009 paper: http://www.meteo.psu.edu/holocene/public_html/supplements/MultiproxySpatial09/
Here is the data for the 2008 paper:
http://www.meteo.psu.edu/holocene/public_html/supplements/MultiproxyMeans07/
Looks pretty complete and very transparent to me …
In the 320 graphs below, how many real hockey sticks do you see? I count…zero.
https://notrickszone.com/global-warming-disputed-300-graphs/
So are the non-hockey sticks real? Or are the only real reconstructions the ones that agree with your beliefs?
Correct. After 1960, proxy records show continued cooling, not warming. Since that doesn’t fit the narrative, it’s assumed that the proxies must suddenly be wrong – after 100s and 1,000s of years of ironically being right. So the proxies are right until they reveal what we, or the models, don’t agree with. When the data don’t agree with the models, it’s the data that are wrong. So the data must be hidden and the “right” temperatures (that agree with our modeled expectations) must replace the wrong data. Funny how your side operates with data.
They do the same thing with sea level rise. According to tide gauges, sea levels are currently only rising by about 1 to 1.5 mm/yr. Those rates are rather inconvenient to the cause, as they’re a deceleration relative to the 1920-1950 period, when sea levels were rising between 2 and 3 mm/yr according to tide gauges. So what should be done? Change the data. Instead of continuing to use tide gauges, use satellite altimetry modeling instead. Just like that, 1 to 1.5 mm/yr doubles to 3.4 mm/yr. Disagree that different measurements should be used rather than comparing apples to apples (tide gauges to tide gauges)? Then you’re a denier!
Ocean heat content changes? Your side does the same thing. Ocean data measurements said the oceans were cooling for the first 10 years after ARGO was deployed. That’s a problem. So what did they do? They “corrected” the cooling to make it show warming instead. Funny how that works.
And despite all this data tampering and moving the goal posts, you think it is we who have the problem because we don’t just shut up and accept that Hide the Decline was exactly what William Connolley and Wikipedia said it was – much ado about nothing.
Any of the more global graphs in your list becomes a hockey stick when you combine it with the actually measured temperatures. Are you complaining about the method this was done (in Mann’s paper) or are you complaining that this is somehow not real (science)?
If it is not ok to combine instrumental temperature data with proxy temperature data than you must assume that one of them is incorrect. Is that true? If proxies show us the real temperatures (going down after the 80s) then instruments must be wrong (none of them showing a downward trend) or vice versa. Which is it?
About satellite altimetry:
https://www.ipcc.ch/pdf/assessment-report/ar5/wg1/WG1AR5_Chapter13_FINAL.pdf (Figure 13.6). That’s what those satellites are measuring and can be obtained by other methods too. A combination of mass change (ice melt, etc) and temperature change (thermal expansion). Any objections? Do you think those measurements aren’t real and/or faked?
Nope, I expect you to do continue to believe in global warming conspiracy. What you don’t seem to realize is that this doesn’t make your other concern appear serious, especially when you routinely get the physics and math wrong. It’s the same as with those hardcore “there is no greenhouse effect” folks. Nobody will take their other concerns seriously when they argue like that.
And here’s the global graphs that we get when we don’t combine them, but only show the proxy evidence.
–
https://notrickszone.com/wp-content/uploads/2017/02/Temperatures-Global-Real-Proxy-Steiger-17.jpg
–
https://notrickszone.com/wp-content/uploads/2017/03/Holocene-Cooling-Global-Temps-1940-1970-2000-Gerhard-04-copy.jpg
——————————————————
And here’s what the proxies vs. the highly adjusted instrumental data that have been hopelessly corrupted by removing thousands of rural stations and keeping urban stations, moving rural sites to airports, “mostly made up” SH sea surface temperatures, cooling down the 1930s and 1940s artificially to remove 0.5 C from the early 20th century warming…look like.
–
https://notrickszone.com/wp-content/uploads/2017/02/Temperatures-Global-Ice-Core-vs-Instrumental.jpg
–
https://notrickszone.com/wp-content/uploads/2017/08/Holocene-Cooling-Northern-Hemisphere-Briffa-2002-Divergence.jpg
–
https://notrickszone.com/wp-content/uploads/2017/08/Hide-the-Decline-Using-Mikes-Nature-Trick.jpg
—————————————————–
Which data set is more reliable: the apples-to-apples one that uses continuous records throughout the measured time period (i.e., proxy evidence, tide gauges), or the apples-to-oranges data set that has been spliced and combined and changed to fit biases and models? Obviously you think the latter is more reliable…because it conforms to your views.
With all the rural station removal and “made up” sea surface temperatures and 1,000s of km of land with no thermometers that are artificially in-filled with computer models that just add warming, why do you trust that the temperature data from NOAA is the “right” one, and the proxy evidence is wrong…starting in about 1960? If proxy evidence is right when it agrees with our expectations and models, but wrong when it doesn’t (and therefore it most be hidden), what’s the point of using proxy evidence at all? Why not just claim that the past doesn’t really matter? Wait. That’s exactly what you and your side does! Dismiss the past when it doesn’t conform to the narrative, and embrace it when devices can be used to make the modern record appear unusual and dangerous. It’s the double standard that only people (like yourself) who are immersed in the ideology cannot detect.
According to tide gauges, global sea level is currently rising at about 1 to 1.5 mm/yr, with about half the world’s gauges showing no rise at all (or declining sea levels). Not only that, but since the 1980s, more land area is above water than below it, indicating that tectonics and subsidence/uplift have much more to do with long-term relative sea level than climate or changes in water temperatures do.
According to satellite altimetry modeling (which was introduced in the early 2000s), global sea levels are rising at a rate of 3.4 mm/yr. Why the discrepancy? And why are tide gauges accurate up to 1993, but then not as accurate as satellite altimetry after that such that they need to be replaced and the data must not be allowed to be continuous? Could it be that the overseers of climate alarm had to change the uncooperative data? Because that’s sure what it looks like.
So you have no problem at all with what Michael Mann did here?
https://notrickszone.com/wp-content/uploads/2017/08/Hide-the-Decline-Using-Mikes-Nature-Trick.jpg
NOAA isn’t the only agency measuring temperatures. Proxies diverging is a problem and someone has to find the reason for this problem. But arguing that the whole instrumental record is wrong because it doesn’t match the proxy data in the last decades … it makes you a conspiracy theorist. You desperately want this to be true so you can declare global warming to be not occurring at all (or something similar). Which would be convenient, wouldn’t it?
Proxies are good for those times we don’t have actual temperature measurements. Why do you think that those proxy temperatures are of better quality than actual measurements?
Nope. Bad quality data gets discarded all the time. He could have included that data in the graphs similar to the Christiansen and Lungqvist graph in the article or the D’Arrigo et al. graph from figure 5 in their paper. I see no problem in combining actual measured data with proxy data, especially since they match quite well in the past and it’s therefore no guessing game as of how to combine them.
Their measurements come from one source, SebastianH. And they make-up/in-fill temperatures using models where thermometers don’t exist.
“There are three main global temperature histories: the combined CRU-Hadley record (HADCRU), the NASA-GISS (GISTEMP) record, and the NOAA record. All three global averages depend on the same underlying land data archive, the Global Historical Climatology Network (GHCN). Because of this reliance on GHCN, its quality deficiencies will constrain the quality of all derived products.”
“The number of weather stations providing data to GHCN plunged in 1990 and again in 2005. The sample size has fallen by over 75% from its peak in the early 1970s, and is now smaller than at any time since 1919.”
https://notrickszone.com/wp-content/uploads/2017/02/NOAA-Data-Manipulation-Station-Removal-Small.jpg
–
https://notrickszone.com/wp-content/uploads/2017/02/NOAA-Data-Manipulation-USA-Temperature-Station-Removal-Since-1979.jpg
–
“The collapse in sample size has increased the relative fraction of data coming from airports to about 50 percent (up from about 30 percent in the 1970s). … The change in the sample was not uniform with respect to source type. For instance it has biased the sample towards airport locations. GHCN had already been heavily-weighted towards airports, which, for many reasons, are not suitable for climatic monitoring. A problem with airports is that they are often in urban or suburban locations that have been built up in the past few decades, and the increase in global air travel has led to increased traffic, pavement, buildings and waste heat, all of which are difficult to remove from the temperature record. … [A]t the global level, as of 2009 49% of all GHCN data came from airports (46% NH, 59% SH), up from just over 20 percent in the late 1920s.”
–
https://link.springer.com/article/10.1007%2FBF00140159?LI=true
“Karl et al., 1988) has shown that at some ‘sun belt’ cities in the West, the rise of temperature that can be attributed to the urban heat island is as much as 0.3 to 0.4°C per decade. In the East, the rise is over 0.1°C per decade. … The artificial warming in the primary station network, relative to the climate division data, is nearly 0.17°C over the past 34 years [since ~1950]. Such trends are at least as large as any of the observed trends over the United States (Karl, 1988) or the globe (Jones and Wigley, 1987).”
I see, so you don’t trust the source? In the comment before you only mentioned NOAA, so I assumed you don’t trust the data coming from them. Do you think the whole instrumental record is made-up? Is that the/your conclusion?
I don’t think the instrumental record as it existed in the mid-1970s was intentionally modified to satisfy an agenda. That’s when it was shown that the Northern Hemisphere warmed by nearly 1 degree between 1880 and 1940, then cooled by nearly -0.6 C between 1940 and 1970, as shown here: https://notrickszone.com/wp-content/uploads/2017/01/Northern-Hemisphere-1881-1975.jpg
After that, the agenda took over, meaning that thousands of rural temperature stations were removed or moved to urban areas (airports) to cause artificial warming and support the models that said the planet should be warming. The proxy evidence consistently showed cooling continued after 1975, but internal conversations revealed that scientists were intentionally hiding the decline in temperatures by using artificially-warmed instrumental temperatures that were tacked onto the proxies.
Not only that, but the scientists have admitted that they do just “make up” temperatures where no data exist, which they still do today for most of the globe.
Furthermore, the scientists actually talk about just removing 0.15 C from the “1940s blip” to make the warmer period cooler. So yes, they do just make up temperature data to suit their purposes. They’ve been caught doing so.
Of course, to you, this fabrication and data manipulation and station removal and relocation means nothing. It satisfies your desire to see hockey sticks. Just provide another link to RationalWiki and it’s covered, right?
Either tree rings are a sufficiently good proxy for temperatures, or they are not. There is no fudged middle ground.
When Mann in around 1996/97 discovered the divergence problem, he had a choice. He could have concluded that tree rings are not sufficiently good temperature proxies and therefore thrown out the tree ring study on that basis, and never had the MBH98 paper published. That would be one legitimate conclusion.
The other choice was to accept the tree ring data as a sufficiently good proxy for temperature and then investigated the divergence problem, ie., what had caused the temperature record post the 1960s to so significantly diverge.
He would then have seen that the problem was caused by the manner in which the land based thermometer record had been adjusted throughout the 1980s and 1990s. As we know these adjustments have cooled the past and warmed the present. They have have sought to render the 1940s less warm so as to compress the 1920s to 1940s warming, they have warmed the period between 1940 and 1970 thereby reducing the amount of the 1940s to 1970s cooling (in accordance with the Team’s declared intention, to eradicate or at any rate reduce the 1940s blip), and they have increased the post 1970s warming exaggerating the trend. It is this trend of adjustment that has brought about the divergence problem.
Now Mann should either have stuck to the tree rings and presented his findings through to circa 1996 (the end date of the tree ring data). This would have shown that the 1940s was the warmest period of the 20th century, and that there had been very slight cooling post the 1940s. This conclusion would have fitted well alongside the Jones and Wigley 1980 paper, and the Hansen 1981 paper which suggested that as at 1980, the Northern Hemisphere was some 0.3 to 0.4degC cooler than 1940. Thus the tree ring data would have suggested that the NH as around 1996 was about 0.2 to 0.3 degC cooler than 1940. That is very probably correct.
Alternatively, Mann should have confronted the divergence problem head on, and shown how the trend in the adjustments to the thermometer record had brought about the divergence. He could then also have compared it with the satellite data that suggested no statistical warming between 1979 and the date of his study. He would have commented that according to the GHE, it is a top down warming theory such that the atmosphere should show the effect of warming before the land, and the atmosphere should show a greater amount of warming than is seen with the land.
Thus even if the satellite data showed say nearly 0.1 degC warming between 1979 to about 1996/7 (which is not statistically significant) then one would expect to see less than this amount of warming in the land based thermometer record if the warming is due to the GHE. thus if the adjusted land based thermometer record was showing more than about 0.07degC of warming between 1979 to 1996 there is a problem with the adjustments.
One of the problems is that if the land is warming faster and to a greater extent than the atmosphere, then the warming pattern is not consistent with the GHE and there must be some other explanation for the land warming. The most likely explanation being that teh land based thermometer record has become inaccurate due to station drop out, particularly high latitude drop out, a biasing towards airport stations, poor station siting and a failure to properly allow for UHI which is having an ever increasing impact upon post 1960s temperatures because of not simply an increase in urbanisation but also the drop out of rural stations and the ever increasing percentage of airport stations and airports have so greatly changed during the 1970s and 1980s. The package holiday revolution of the mid to late 1970s has had a huge impact on the temperature record especially during the period covered by the MBH98 study.
MBH98 could have been a very interesting paper if only proper science had been conducted.
Summary, visuals, references here:
https://notrickszone.com/2017/02/13/more-data-manipulation-by-noaa-nasa-hadcrut-cooling-the-past-warming-the-present/
So you believe the instrumental record is incorrect and tree ring proxies are correct?
I find it likely that both are incorrect (as if there were such thing as a “correct” when it comes to Earth’s temperature), as the uncertainty is quite high with both. Mixing land and sea temperatures together is a dubious exercise, especially since much of the SH ocean temperatures have just been admittedly “made up” by those in charge of the instrumental record. There are no temperature data available in most of the land area on Earth, and so those in charge of the instrumental record just in-fill their guesses (based on computer models) of what they think the temperatures might be.
On the other hand, we do have relatively clear evidence that Vikings were farming on Greenland during the Medieval Warm Period where farming cannot be practiced today, or that grapes were grown in regions of the world during Roman times where they cannot be grown today, or when sea levels were “2 miles” further inland than they are today. So while we don’t know precisely how warm central Rome was in the the year 43 C.E., we can make a pretty good assumption that it was substantially warmer than today.
Reply in spam?
Here is the data and code … wasn’t hard to find:
http://www.meteo.psu.edu/holocene/public_html/supplements/MultiproxySpatial09/
http://www.meteo.psu.edu/holocene/public_html/supplements/MultiproxyMeans07/
Have fun “testing the hypothesis”.
If that is what is necessary to recreate Mann’s hockey stick and validate his findings then he would not be facing possible contempt of court for refusing to release his computer codes and all his data.
http://principia-scientific.org/breaking-fatal-courtroom-act-ruins-michael-hockey-stick-mann/
“Michael Mann, who chose to file what many consider to be a cynical SLAPP (Strategic Lawsuit Against Public Participation) libel suit in the British Columbia Supreme Court, Vancouver six long years ago, has astonished legal experts by refusing to comply with the court direction to hand over all his disputed graph’s data. Mann’s iconic hockey stick has been relied upon by the UN’s IPCC and western governments as crucial evidence for the science of ‘man-made global warming.’”
Face it. It’s not science. The man will not comply and provide ALL the information necessary to replicate his results.
This despite the fact that he produced it as a member of the faculty of publicly funded university. IOW tax dollars were used to produce the hockey stick.
His refusal to release computer codes and data needed is indefensible. His hockey stick is not science.
Don’t believe the fake news that is principia scientific …
What is missing from the linked data?
Sebastian, he has never come clean with his bogus paper:
“Mann and his co-authors created a temperature reconstruction of the past 1,000 years (of the northern hemisphere) which had the shape of a “hockey stick.” It showed relatively flat temperatures for approximately 900 years followed by a sharp increase in temperatures over the last hundred. This gave the impression modern temperatures were unprecedented in the last millennium, strongly suggesting humans were the cause. Critics of the hockey stick say this shape, and thus the implication, can exist solely by giving undue weight to a small amount of data. For all the disagreements and technical issues which have arisen, that point is what everything comes down to.
Mann’s original reconstruction was created in two parts. The first part went back to 1,400 AD, and it was published in 1998. In this paper, that central criticism was dismissed prior to ever being raised when the authors said:
the long-term trend in NH is relatively robust to the inclusion of dendroclimatic indicators in the network, suggesting that potential tree growth trend biases are not influential in the multiproxy climate reconstructions.
The next year, Mann and his co-authors published a second paper, extending their reconstruction back to 1,000 AD. Prior to this, Mann did an analysis, the results of which he describes on page 51 of his book:
The tests revealed that not all of the records were playing an equal role in our reconstructions. Certain proxy data appeared to be of critical importance in establishing the reliability of the reconstruction–in particular, one set of tree ring records spanning the boreal tree line of North America published by dendroclimatologists Gordon Jacoby and Rosanne D’Arrigo.
Amazingly enough, Mann now admits his original hockey stick existed solely because of “one set of tree ring records,” directly contradicting his 1998 paper which said the reconstruction was “relatively robust to the inclusion of dendroclimatic indicators” (dendroclimatic indicators are tree ring data). Despite admitting he knew this, he has never corrected his original paper. Instead, he built upon that paper and never told people his conclusions were based on only a tiny fraction of the data he used.”
https://wattsupwiththat.com/2012/03/07/a-detailed-review-of-manns-book-the-hockey-stick-and-the-climate-wars-as-it-relates-to-the-wegman-report-to-congress/
============================================
The NAS stated that Bristlcone pine tree rings should not be used in temperature reconstructions. Not only that they say his paper is WORTHLESS!
There He Goes Again, Version 4.0: Mann Claims His Hockey Stick was Affirmed by the NAS
1. The NAS indicated that the hockey stick method systematically underestimated the uncertainties in the data (p. 107).
2. In subtle wording, the NAS agreed with the M&M assertion that the hockey stick had no statistical significance, and was no more informative about the distant past than a table of random numbers. The NAS found that Mann’s methods had no validation (CE) skill significantly different from zero. In the past, however, it has always been claimed that the method has a significant nonzero validation skill. Methods without a validation skill are usually considered useless. Mann’s data set does not have enough information to verify its ‘skill’ at resolving the past, and has such wide uncertainty bounds as to be no better than the simple mean of the data (p. 91). M&M said that the appearance of significance was created by ignoring all but one type of test score, thereby failing to quantify all the relevant uncertainties. The NAS agreed (p. 110), but, again, did so in subtle wording.
3. M&M argued that the hockey stick relied for its shape on the inclusion of a small set of invalid proxy data (called bristlecone, or “strip-bark” records). If they are removed, the conclusion that the 20th century is unusually warm compared to the pre-1450 interval is reversed. Hence the conclusion of unique late 20th century warmth is not robust—in other word it does not hold up under minor variations in data or methods. The NAS panel agreed, saying Mann’s results are “strongly dependent” on the strip-bark data (pp. 106-107), and they went further, warning that strip-bark data should not be used in this type of research (p. 50).
4. The NAS said ” Mann et al. used a type of principal component analysis that tends to bias the shape of the reconstructions”, i.e. produce hockey sticks from baseball statistics, telephone book numbers, and monte carlo random numbers.
5. The NAS said Mann downplayed the “uncertainties of the published reconstructions…Even less confidence can be placed in the original conclusions by Mann et al. (1999) that ‘the 1990s are likely the warmest decade, and 1998 the warmest year, in at least a millennium.’
Mann never mentions that a subsequent House Energy and Commerce Committee report chaired by Edward Wegman totally destroyed the credibility of the ‘hockey stick’ and devastatingly ripped apart Mann’s methodology as ‘bad mathematics’. Furthermore, when Gerald North, the chairman of the NAS panel — which Mann claims ‘vindicated him’ – was asked at the House Committee hearings whether or not they agreed with Wegman’s harsh criticisms, he said they did:
CHAIRMAN BARTON: Dr. North, do you dispute the conclusions or the methodology of Dr. Wegman’s report?
DR. NORTH [Head of the NAS panel]: No, we don’t. We don’t disagree with their criticism. In fact, pretty much the same thing is said in our report.
DR. BLOOMFIELD [of the Royal Statistical Society]: Our committee reviewed the methodology used by Dr. Mann and his co-workers and we felt that some of the choices they made were inappropriate. We had much the same misgivings about his work that was documented at much greater length by Dr. Wegman.
WALLACE [of the American Statistical Association]: ‘the two reports [Wegman’s and NAS] were complementary, and to the extent that they overlapped, the conclusions were quite consistent.’”
http://hockeyschtick.blogspot.com/2011/09/there-he-goes-again-version-40-mann.html
=================================================
Since his bogus paper was published,new papers comes out to take down part of his crap,here is one:
“New paper finds bristlecone pines (used for Mann’s hockey stick) grow at significantly different rates & often not related to temperature
A paper published today in Environmental Research Letters has very important implications for tree-ring paleoclimate research [dendrochronology], including Michael Mann’s debunked hockey sticks. The paper finds that growth of bristlecone pines varies significantly depending on altitude, and also depending on whether the trees are located on the North or South side of a mountain. According to the authors, such differences are often not temperature-related and thus could contaminate tree-ring datasets for which the false assumption is made that tree-rings accurately reconstruct temperature variations.”
http://hockeyschtick.blogspot.com/2014/11/new-paper-finds-bristlecone-pines-used.html
=====================================================
Only bogus researchers create bogus papers.
There is probably no use trying to explain hide the decline and the hockey stick corruption to SebastianH. He likely won’t do more than glance at it and/or ignore it. If you’ve noticed, when asked to explain what Jones and Mann were talking about when they referred to using Mike’s trick to hide the decline in temperatures, he has nothing to say himself, so he just links to a smear-the-deniers site that extols Michael Mann (RationalWiki) and refers to us as “conspiracy theorists”. That’s all he’s got.
You are conspiracy theorists.
How effective.
Fake news are news contradicting your opinions ?
That’s the reason for “inventing” “Fake News”.
“You are conspiracy theorists.” – Chatbot_troll_SebH
After what was exposed in the emails of climate-gate, it was no longer “theory” but established fact.
Without releasing the data and methods it can be legitimately said what Michael E. Mann has done was not science. Michael E. Mann (as lead author of a paper produced in 1998 with co-authors Raymond S. Bradley and Malcolm K. Hughes) has deliberately mislead people in to thinking that the results given in his infamous ‘hockey-stick’ paper is anything but a fiction.
To say it was a science paper is wrong, it is not, it was a paper deliberately crafted fabrication, with a high probability it was intended to mislead. It is just junk. It should never be quoted in other scientific papers, as it has no scientific bona fides.
If Michael E. Mann says it is scientific as it stands then he is wrong. Science relies on verification and validation. Michael E. Mann acts to block such checks on his work, and thus shows he is NOT a scientist, or at least not acting as someone who understands what it is to be scientific.
Thankfully many other papers show what is really happening as listed by Kenneth above and many others. Their papers can be subjected to validations and verifications. A such these paper show that Michael E. Mann 1998 paper was wrong. Pain and simple.
AGW advocates should be upset over this, but until Michael E. Mann can man-up and reveal what is required, then what he has done was not by any stretch of the imagination science.
Is something missing from the data I linked to?
Speaking of data and code. Where can I find the data and code used by Abbot&Marohasy again?
Why is combining the instrumental record with proxy data unscientific? Don’t you want to know if both match?
Sebastian H your church teaches you, that green house gases warm the planet. Green House Gases refract to space 20% of total otherwise available warming firelight from the sun, so it never warms the Earth.
Your church teaches you that each time green house gases refract additional percentage light from the sun to space, instruments on earth detect and depict more light from the sun, reaching and warming the planet.
When insulation mixed into a bath that is conduction chilling a sun-warmed rock, causes less and less light to reach the rock, instruments cannot detect and depict, more light reaching and warming it, with every percent less reaching and warming it.
Your church’s teachings are therefore in direct violation of conservation of energy.
Furthermore when I was a young man my first career was as an atmospheric and environmental chemist.
Your church can not correctly calculate the proper temperature of the planet’s average global atmospheric temperature.
Since your church cannot attain the actual global atmospheric temperature through it’s calculations, this leads me to believe you, personally, are probably incapable of even naming the law of thermodynamics responsible for calculation of global average atmospheric temperature.
1) What is the name of that law of thermodynamics?
2) What is the equation of that law?
You’re in here arguing that you’re an expert on analysis of temperature records, so you should be able to tell me the name of the law, for calculating the temperature of a volume of gas or atmospheric air.
3) What do each of the factors in the equation of the Law stand for?
4) Which of those factors leads you to believe it is possible to place insulating refractive gases, between a fire and rock the fire is warming, and have the gases cause instruments to detect and depict more light warming the rock, each time more insulation makes less light warm the rock?
Be specific.
5) Tell me why there has to BE another law, for calculation of temperature of atmospheric air, than for calculation of the temperature of sand, or water or ice on a beach, the air that you can’t name the law of thermodynamics governing temperature of, sits over?
If you can’t answer these fundamental questions, then you’re what’s called a posing, fraudulent fake, too stupid to realize there’s no such thing as insulation that can be placed between fires and rocks they warm, that causes sensors to depict more light warming rocks, the insulation is causing less light to warm.
I’ll wait, and you tell me the name of the law of physics even governing all your ridiculous claims, and we’ll see if you’re as stupid as I’m telling everyone here, you are.
SebastianH will not be able to answer these questions. So he will likely use some variation of the argument from authority and toss a few personal insults your way…if he responds at all.
This is not how the greenhouse effect works. You don’t seem to know the difference between SW radiation and LW radiation, as this and the fire few paragraphs show us.
As for the laws of thermodynamics, they would be violated by most of what skeptics (on this blog) say is true and they don’t seem to care. It’s not violated by the existence of the greenhouse effect.
seb asks in reply to my observation
“Is something missing from the data I linked to?”
the answer, of course is, YES!
Now seb go back and read what I said and when asking a question please directly quote me, otherwise don’t bother.
So you won’t bother to tell us what is missing and why you can’t replicate the results from what is provided in code and data at those links? Hmm …
I still don’t quite understand the problem you have with hockey sticks. It combines the data from two different temperate time series which happen to deviate somewhere around the 1960s. Is the argument you guys are making really that the instrumental record after 1960 is wrong and that it should look like what the proxies are showing?
What’s missing from these two “reconstructions”, SebastianH? Is this unclear to you what the justification is for hiding the decline?
https://notrickszone.com/wp-content/uploads/2017/08/Hide-the-Decline-Using-Mikes-Nature-Trick.jpg
I’ll ask once more: do you think the instrumental record is incorrect to the extent that it should look exactly like that decline visible in tree ring proxy records?
Mods
I have tried to post a comment but it appears to have been lost.
Please look out for it, and please indent the first paragraph. i failed to properly close the blockquote
STILL A STEAMING PILE OF YKW
Already in 2005 Michael Mann’s work was known to be garbage. I can’t believe anyone still gives it any credibility. Michael Crichton here reveals a few not so minor problems, some of which I hadn’t been aware of.
https://www.youtube.com/watch?v=cecmvYq_91A&t=6
[…] Link: https://notrickszone.com/2017/08/31/scientists-expose-data-manipulation-hide-the-decline-and-the-post… […]
@SebastianH
” It combines the data from two different temperate time series which happen to deviate somewhere around the 1960s”
If proxies ans measurements are combined in a scientific paper, it has at least to be declared. If not, it’s not scientific at all, it’s fraud.
We are talking about the Mann 2008 paper, right? Have you even read it?
The whole paper ist about proxies and how to combine them with the instrumental record to show that the warming in the recent decades is likely an anomaly.
I speak about P.Jones – using the mentioned “trick” without declaration and wrote that proudly to Mann and col.