Brand new scientific findings in a just published paper by Lansner and Pepke Pedersen appearing in the journal of Energy and Environment cast global warming science into more uncertainty.
The findings tell us that ocean cycles and their impacts have not been adequately accounted for in computing global temperatures.
BEST approach “flat wrong”
The paper would mean that the entire approach of, for example, BEST and others to present global temperature data is “flat wrong”, claims coauthor Frank Lansner.
These approaches use one temperature trend for each area that they call “expected regional trend” and then they adjust all data to resemble this trend. But Lansner points out this is inadequate and that TWO trends need to be accepted instead – depending on the topography: one for stations exposed to ocean air affects (OAA), and one for stations sheltered from oceanic air affects (OAS). “In fact between the two extremes of temperature trends we have a grey zone of temperature trends that also are fully valid,” Lansner wrote in an e-mail response to an inquiry from NoTricksZone.
“Moreover, any dataset used to evaluate climate related changes in the heat balance over the earth should strive to use only OAS temperature data trends,” Lansner wrote. “It’s necessary to reduce noise from ocean temperature trends as much as possible if we want to read the signal from changing heat balances over the Earth. Go to the valleys and read the thermometers if you want to learn about the actual changes in the heat balance over the Earth.”
Ultimately this gets right to the heart of the whole CO2 vs natural factors debate.
The paper’s abstract:
Temperature data 1900–2010 from meteorological stations across the world have been analyzed and it has been found that all land areas generally have two different valid temperature trends. Coastal stations and hill stations facing ocean winds are normally more warm-trended than the valley stations that are sheltered from dominant oceans winds.
Thus, we found that in any area with variation in the topography, we can divide the stations into the more warm trended ocean air-affected OAA] stations, and the more cold-trended ocean air-sheltered [OAS] stations. We find that the distinction between ocean air-affected and ocean air-sheltered stations can be used to identify the influence of the oceans on land surface. We can then use this knowledge as a tool to better study climate variability on the land surface without the moderating effects of the ocean.
We find a lack of warming in the ocean air sheltered temperature data – with less impact of ocean temperature trends – after 1950. The lack of warming in the ocean air sheltered temperature trends after 1950 should be considered when evaluating the climatic effects of changes in the Earth’s atmospheric trace amounts of greenhouse gasses as well as variations in solar conditions.
Figure 19 of the paper:
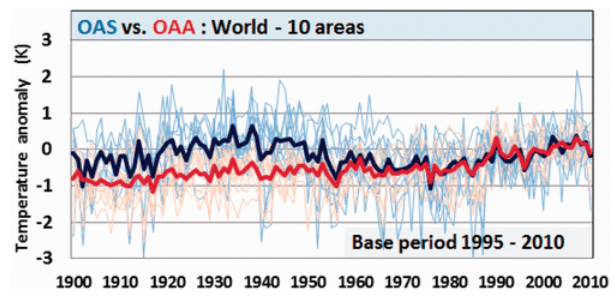
Figure 19. Ocean air sheltered (OAS) and ocean air affected (OAA) temperatures, all regions.
This all means that when the ocean effects are minimized as well as possible, the heat trend from worldwide temperature station data diminishes.
Lansner wrote: “CO2 theory apparently does not work in valleys. Rather, we need ocean-trends to affect temperature data to see alarming temperature rise after 1950. Areas without ocean noise in data show that the heat balance over the Earth today resembles 1930-50.”
Lansner informed NoTricksZone by e-mail: “This goes right in the heart of the whole Sun vs. CO2 debate.” He added:
The little ice-age centuries led to a very cold ocean around 1900-1920 and so ocean and ocean-affected stations were not able to show the warming around 1920-30 so well. The ocean kept the warming hidden to some degree. Ocean temperature rise was somewhat delayed for decades it appears. That’s why ocean temperatures do not well reflect the heat balance over the Earth 1920-50 – unlike OAS areas valleys that reflected the change in heat balance rapidly. Thus it appears OAS data are the data best suited for evaluating the heat balance over the Earth.”
This spells more potential trouble for the suspicion that CO2 has been the main driver of the global temperature over the past century.
==============================
Frank Lansner, civil engineer from the Danish Technical University, 1998. Main areas are Microbiology and Biochemistry and has worked as a software developer since 1998.
Jens Olaf Pepke Pedersen has a PhD in physics from the University of Aarhus, Denmark. He worked at the Danish Center for Earth System Science from 1998-2003 and since 2003 has worked at the Danish National Space Institute. His main focus is climate change and Earth System modelling of both past and future climate.


“CO2 theory apparently does not work in valleys. Rather, we need ocean-trends to affect temperature data to see alarming temperature rise after 1950. Areas without ocean noise in data show that the heat balance over the Earth today resembles 1930-50.”
This echoes what the IPCC has had to say about temperature changes in the Arctic, where urbanization has not corrupted temperature:
“Arctic temperature anomalies in the 1930s were apparently as large as those in the 1990s and 2000s. There is still considerable discussion of the ultimate causes of the warm temperature anomalies that occurred in the Arctic in the 1920s and 1930s.” – IPCC AR5 Chapter 10
It also matches the global-scale sea level rise trends, which reached into the 3 mm/yr during the 1930s and 1940s.
“Rather, we need ocean-trends to affect temperature data”
Which basically discounts CO2 as a warming agent completely.
All we see is the slight, gradual build-up of ocean heat from the increased solar activity since the LIA.
What is the percentage of the surface that is covered by Oceans again? Why should the warming of Oceans not come from the increase in GHGs? It’s not a land-only effect.
Secondly, I must be blind, but the graph above shows no different trend between OAS and OAA starting from the 50s/60s despite the author claiming that only the OAA shows a warming trend. Strange.
Because:
1. The energy in the oceans is many orders of magnitude greater than that contained in the air above it, such that warmer air above the oceans cannot effectively heat the oceans. It is the energy in the oceans that constantly heats the air above it. That is why the air temperature above the blue ocean (ie, non coastal areas) is very similar to the ocean temperature itself, and why there is so little diurnal range in (still) air temperature above the blue oceans. The position is slightly different when there is wind, and wind further complexes the matter since the rate of evaporation is dependent upon windspeed and evaporation of course cools the very top surface microns of the oceans.
2. Due to the wavelength of Down Welling LWIR, it can only penetrate the ocean by a few microns. Downwelling LWIR cannot therefore effectively heat the oceans, especially since the energy flow in the top millimetres of the oceans is upwards, ie., the very surface microns are colder than the millimetres below it, and heat energy cannot be conducted in a direction against which the energy flux is flowing.
Do you really believe that is what climate science says is happening? Downwelling LWIR directly heating the oceans as if it were a second source of energy next to the Sun?
There is ZERO SCIENCE that allows GHGs to warm oceans.
End of story.
No mechanism, no measurements,..
NADA, NOTHING !!
If you think there empirical scientific proof
… THEN PRODUCE IT.
“Why should the warming of Oceans not come from the increase in GHGs? It’s not a land-only effect.”
Its not any PROVEN warming effect at all.
There is ZERO empirical evidence that enhanced atmospheric CO2 causes warming.
End of story.
You have still been TOTALLY INCAPABLE of providing any such evidence, and have instead come up with every excuse under the SUN for avoiding producing any evidence.
“What is the percentage of the surface that is covered by Oceans again?”
That is irrelevant to the paper. The paper looked at 2% of the weather stations located on land bordering oceans, then compared that tiny subset of the data to itself, looking at prevailing wind. The paper’s authors clearly stated Earth is warming sharply and anomalously due to human-produced greenhouse gases.
I must confess, I didn’t read the paper. Thanks for pointing out how skeptics tend to misinterpret papers …
This is so amusing. So you didn’t read the paper, but you’re taking another commentator’s word for it that Pierre – who did read the paper, and who corresponded with the lead author via e-mail – misinterpreted the paper? This is exactly why your comments here are of such limited worth, SebastianH.
I have read the entire paper, not just the abstract. Twice. Let me know what it is you think has been misinterpreted here. Or is saying “It’s been misinterpreted” all that you need to read and write to confirm your presuppositions?
You seem to just believe anything that you think confirms what you already believe to be true.
I can produce backing for the AR5 comment “Arctic temperature anomalies in the 1930s were apparently as large as those in the 1990s and 2000s. ” From the HADCRUT4 data I have compiled zonal temperature anomalies, the used a 7 year moving average to show the trends.
The early twentieth-century warming in the Arctic (or more exactly for an area slightly larger than the Arctic of 65-90N) is pretty much the same in magnitude as the late twentieth-century warming, with significant cooling in between. What is more, the Arctic warming is more than twice that of the global average.
https://manicbeancounter.files.wordpress.com/2018/03/hadcrut4-zonal-7yr-mav.png
A good review of one of the most sane papers about atmospheric temperature I have ever read. So refreshing for a climate view that understands that the local topography must be considered when assessing temperature variation around the globe.
If more papers like this gets some traction then the Mann, Trenberth, Schmidt, Hansen, et al can consider most of their research junk, as the real world determinants overrule the hypothetical nonsense of CO2 warming.
Sun and ocean currents are what determines the vast majority of our weather, and therefore the climate. CO2 is at best an ‘also ran’ that some people asserted and inspired to be a great conditioner of the climate but it has never happened. Their hypothesis about atmospheric CO2 warming is a big a phony as the ‘phlogiston theory’ of heat, and as measurable as ‘cold fusion’.
But you need to remember that the demonisation of CO2 has essentially nothing to do with climate or science. Its purpose is to halt further development by the human race by the (ultimate) ban on the use of cheap, reliable, on-demand energy.
Which is why our “little green men” are as opposed to nuclear energy as they are to coal and gas and why they are more than happy to put up with the rape of the countryside. They are not genuine environmentalists; that is merely a cover for their ambition to return us (but presumably not them) to a life of penury, hardship, and early death. Their idea of a pre-industrial “golden age”.
Edenhofer and Figueres keep giving the game away but our leaders keep not listening.
“A good review of one of the most sane papers about atmospheric temperature I have ever read.”
Darn shame you did not read the paper: it states the exact opposite of what this blog entry claims it states. Why didn’t you notice that, if you claim you read papers on the subject?
[…] h/t No Tricks Zone […]
Lansner comment:
“The little ice-age centuries led to a very cold ocean around 1900-1920 and so ocean and ocean-affected stations were not able to show the warming around 1920-30 so well.”
This is consistent with the oceans providing thermal damping. In fact the thermohaline circulation has the ability to transport energy at an estimated rate of 1.2PW based on spot measurements of current flow. So a surface heat imbalance of 1W/sq.m represents about a quarter of this transport mechanism meaning any small ocean surface heat imbalance gets transported to deep ocean before is affects ocean surface temperature. It takes at least decades for any imbalance to show up in the deep ocean temperature.
The charted OAA shows a warming trend over its 110 year period. The question is whether that trend is due to heat input from natural causes or from increasing CO2 in the atmosphere.
Fundamentally, the oceans hold the energy that drive the climate trends. Temperature changes over land is best described as weather. Way too much noise to be used to determine climate trends.
A sane comment and no one from the usual crowd insulting you?
Of course it is the Oceans that hold most of Earth’s heat content. But skeptics are trying to ignore the GHE for reasons unknown.
Only from SOLAR energy, seb,
Everyone knows that except you.
But keep up the wilful ignorance, its your life.
There is NO mechanism for CO2 to warm the ocean.. period.
There are NO measurements that show CO2 warm the ocean.
It is an EMPTY anti-science thought-bubble from the rear end of a donkey. !
Honest question: are you under the impression that the CO2 GHE would be somehow adding energy on top of that provided by the Sun? Of course it is only solar energy, where should additional energy even come from?
The GHE does what insulation does, it prevents heat/energy from escaping, thus the heat content of whatever is insulated increases until high enough for incoming energy to equal outgoing energy. This increase in heat content doesn’t require an additional source of energy.
ROFLMAO..
Next you will be using the “blanket” analogy again.. so funny.
H2O cools the planet, that is how it gets into the atmosphere.
You really have one heck of a lot to learn about how anything works , don’t you seb. !!!
You need to UN-LEARN all the AGW brain-hosing first though.
There is NO EVIDENCE that enhanced atmospheric CO2 has any effect except making plants grow better.
There is no evidence that CO2 provides any “insulating” effect whatsoever, quite the contrary, actually.
It acts purely as another conduit for surface cooling, all control by the gravity thermal gradient.
You are, as always, just regurgitating the anti-science AGW mantra.
Its all you have.
When the Earth’s surface gets warmer than the gravity induced temperature gradient can sustain, the atmosphere ACTS TO COOL THE SURFACE.
Funny sort of “insulator” 😉
One that deliberately COOLS the surface. WOW !!
A new FANTASY definition. !!
” The question is whether that trend is due to heat input from natural causes or from increasing CO2 in the atmosphere.”
Indeed, and that question was answered more than 80 years ago.
Another good article based on real data, not gigo models. However, to change the tide on the CAGW myth, IMO what we need is more articles highlighting the gulf between what the IPCC AR chapters say about the science, and what the Summary for Policy Makers say. I’m sure that most of the world’s politicians, CAGW advocates and the MSM only read the SPMs and assume that they reflect the underlying science, but they don’t.
Great News for plant life, and life in general…
Global CO2 emissions went UP by 1.4% in 2017.
https://notalotofpeopleknowthat.wordpress.com/2018/03/23/global-emissions-up-1-4-in-2017/
I’d like to see the alarmists say about this. Seems at all levels so fundamentally correct
At ALL levels, alarmists are fundaMENTALLY INCORRECT.
There is actually very little real science backing up even the most basic of their conjectures/scams. !!
Warming from enhance atmospheric CO2?
… ZERO EMPIRICAL EVIDENCE
Pierre, you did a good job! (^-^)
Thanks, that’s very kind of you. But here definitely the two authors of the paper deserve all the credit for ushering in this whole new perspective. 🙂
Although it is good to see this paper, the underlying logic has long been recognized. In the mid and sub-polar latitudes, fresh water bodies are the last to freeze in fall and the last to thaw in spring. Hence lake-effect snow. I also have witnessed farmers planting crops on adjacent land to still frozen lakes (Cdn prairies). On a larger scale, Koppen’s climate regions were defined by terms such as “continentality” and “maritime” as basic divisions. The air masses that originate over large land or ocean areas are what move around with pressure/wind fields and create “weather”. Where I live the annual temp range is about 70C (+35 to -35C). You can’t find that anywhere at the same latitude over an ocean or areas subject to onshore ocean air flow. The oceans, being more than 70% of the earth’s surface, absolutely rule global temps.
This is an off topic suggestion:
The article ( link here ) may be of interest. Dated 30 January 2012.
” . . .volcanic eruptions triggered the multiple-century cool spell known as the Little Ice Age, and pinpoints the start of the climate shift to the final decades of the 13th century.”
“. . . 50-year-long episode of four massive tropical volcanic eruptions”
And last part:
“The researchers set the solar radiation at a constant level in the simulations, and Miller said the Little Ice Age likely would have occurred without decreased summer solar radiation at the time. “Estimates of the sun’s variability over time are getting smaller; it’s now thought by some scientists to have varied little more in the last millennium than during a standard 11-year solar cycle,” he said.
Yes, there are several “scientists” trying to take solar variability out of the picture.
Doing everything they can to level out the past.
Looking at Figure 19, the trend in the last 30 years for OAS is about +2 deg/century. That should make the alarmists happy.
[…] https://notrickszone.com/2018/03/23/uncertainty-mounts-global-temperature-data-presentation-flat-wron… […]
More generally, the paper’s authors are saying that over fairly short distances temperature stations will show different climatic trends. This has a profound implication for temperature homogenization. From Venema et al 2012.
Lansner and Pederson are, by implication, demonstrating that the principle assumption on which homogenization is based (that nearby temperature stations are exposed to almost the same climatic signal) is not valid. As a result data homogenization will not only eliminate biases in the temperature data (such a measurement biases, impacts of station moves and the urban heat island effect where it impacts a minority of stations) but will also adjust out actual climatic trends. Where the climatic trends are localized and not replicated in surrounding areas, they will be eliminated by homogenization. What I found in early 2015 (following the examples of Paul Homewood, Euan Mearns and others) is that there are examples from all over the world where the data suggests that nearby temperature stations are exposed to different climatic signals. Data homogenization will, therefore, cause quite weird and unstable results. But what I also found is that those who support AGW theory not only do not question their assumptions but have strong shared beliefs in what the data ought to look like. Homogenize a number of times, and evaluating the unstable results in the context of strongly-held beliefs will bring the trends evermore into line with those beliefs.
https://manicbeancounter.com/2015/06/27/defining-temperature-homogenisation/
Er, the paper states the exact opposite of what you claim it does. Did you bother to read it? Good gods you people are spooky.
The main conclusion above is
“The paper would mean that the entire approach of, for example, BEST and others to present global temperature data is “flat wrong”, claims coauthor Frank Lansner.”
So, David Rice, are you saying the paper is not saying this? Or are you just practising your motto “Subvert the Subversives”?