Accurately measuring the sea level with a satellite is highly complex and fraught with uncertainty. Even the slightest equipment miscalibrations can produce inaccurate results.
Huge discrepancy exists between satellite measurements and observed coastal tide gauge readings. Source: CSIRO.
For sea level rise, the figures that are often cited come from namely two sources: satellite measurement, which go back 25 years and so do not properly account for multidecadal variations, and tide gauges placed along the coastlines where people actually live.
Satellite data may be overstating sea level rise
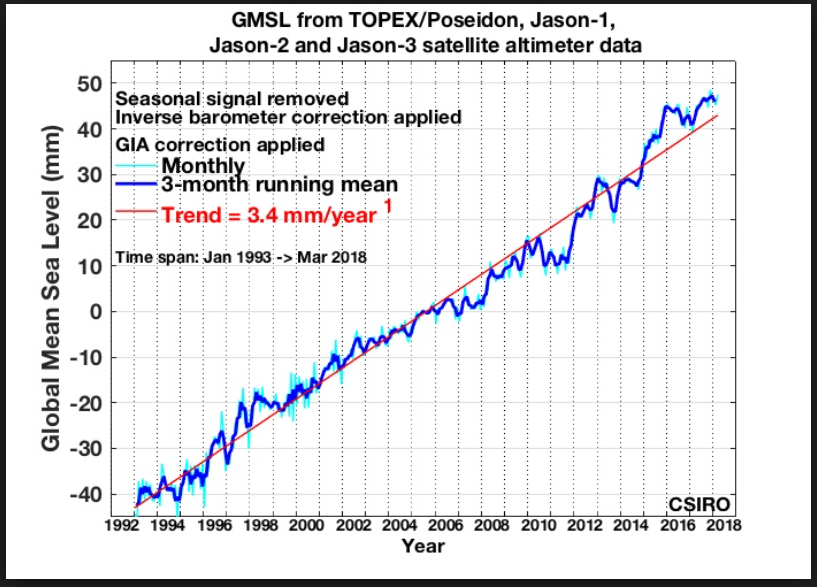
The assumed current global sea level rise from the satellite data TOPEX/Poseidon spacecraft and its successors, which began collecting data in late 1992, is reported by NASA’s Jet Propulsion Laboratory (JPL) to be 2.8 inches (7 centimeters).
Some experts recently warned however — after having made adjustments to the satellite measurements — that sea level rise has accelerated and thus could rise some 75 centimetres over the century, which would be in line with projections made by the Intergovernmental Panel on Climate Change (IPCC) in 2013.
Other sources say that sea level rise could be as much as 3.4 mm per year, and thus accelerating (e.g. see chart above).
Indeed if these high-end projections were accurate, then coastal areas would be facing serious challenges. But those alarmist claims have been met critically, and at times even with derision.
There remains lots of uncertainty, and so the question today is: How much are coastal areas (where it really matters) at risk really?
Tide gauges: “most extensive, accurate and significant” datasets
One way to check what’s really going on is to examine the tide gauges along the coasts worldwide. Since the early 1800’s, NOAA and its predecessor organizations have been measuring tide levels.
According to the NOAA, “This database has become one of the most extensive, accurate and significant geophysical data sets in existence.”
To do this the NOAA keeps a coastal station tide list for tracking global linear relative sea level (RSL). Manually I counted 358 stations. A number of them stopped measurement some years ago, while others were put in operation in the 20th century. The list appears not to include the US tide gauges.
The data and charts can be looked at country-by-country here.
Less than 1% on track to meet IPCC’s 75 cm sea level rise by 2100
Examining the data to get a general idea how the sea level is behaving at these tide stations. A number of points were observed:
1) Only 3 stations show a RSL rise of 7.5 mm/year or more, meaning that only three stations (0.08%) are on track to reach the IPCC’s alarmist 75 cm sea level rise projection by 2100. And if we use the more conservative 60 cm rise, only 5 stations (1.4%) are on track!
Only 14% show a rise equal to or greater than satellite global rate
2) Only 51 tide gauges (14%) are measuring 3.2 mm/year or more, which is approximately equivalent to about what the satellites are said to be measuring globally. That figure would need to be near 50% if the satellites were true.
3) 54 coastal tide gauges (15%) show that relative sea level has in in fact been falling.
4) The mean relative sea level rise as to the tide gauges is about one third less than what is measured by the satellites, i.e. approx. 2.3 mm per year, or less than 10 inches per century.
This is only a rough overview. Naturally a more detailed look recent tide gauge trends of the last 2 or 3 decades would tell us more about accelerating sea level rise. Or maybe not: rate changes over such short time periods have more to do with natural variations.
So in general? If you’re living and working at the institutes who operate the satellites, then you might be showing concern about the figures from your getting (it’ll help with funding, in any case).
But if you’re the average person living near the coast, then in most places there’s not much to be alarmed about. There’s a good chance the satellites are overstating sea level rise just a bit and so you can better rely on what your local tide gauge has been showing.
=============================================
Follow NTZ at Twitter.


The Union of Concerned Scientists have mounted a media blitz to frighten people holding real estate on US coastlines. As usual, the projections of flooding are models all the way down. For example, San Francisco historical trend compared to model projected sea level rise:
https://rclutz.files.wordpress.com/2018/06/sf-ca-past-projected.png
More at https://rclutz.wordpress.com/2018/06/21/uscs-warnings-of-coastal-floodings/
Some US coastlines will see significant relative sea level rise, but likely nothing near the scare stories some like to spread. People interested in moving near the coast simply need to consult here. https://tidesandcurrents.noaa.gov/sltrends/mslGlobalTrendsTable.html
Start at 2010, there is your sudden acceleration. Question is, what happened in 2010? Data sources, satellite change?
Something.
El Niño.
The link I’m going to give is little bit dated, but I had it in my file because it explains about the adjustments made to the satellite data. Also it’s very detailed.
SATELLITE:
1992-2016 Global 74.4mm = 2.9 inches (3.1mm/yr)
Pacific (2.9mm/yr)
Dec ’92 – Dec 2003 Atlantic 3.51mm/yr
Jan 2004 – July 2016 Atlantic 2.63mm/yr
The satellite SLR is greater than the global tide gauge SLR because the University of Colorado adds a dubious 0.9 mm/yr adjustment to the raw satellite measurements, which they claim is due to sensor drift.
The graph shows the average monthly sea level of 10 tide gauge stations on the West coast of Canada. The black line is the linear best fit to the data. Over the period 1973 to 2013 the average sea level has declined at 0.55 mm/year, in this subset of gauges.
The Envisat is the newest and most sophisticated satellite to measure global sea level. Launched in 2002, Envisat is the largest Earth Observation spacecraft ever built. The data shows there has been no global sea level rise since the end of 2003.
https://www.friendsofscience.org/index.php?id=712#Sea_Level
I forgot to say that Envisat is now “inactive.” It was certainly not giving the desired data, but whether this has anything to do w its reported “silence” is anyone’s guess.
Here is a graph you might like Penelope.
Shows the “adjustments™” made some time around 2002.
https://s19.postimg.cc/p42wgwtir/comparison.jpg
Thanks! 🙂
Local changes in sea level are important.
If you’re in Sweden, then Glacial Isostatic Rebound, means local sea levels are falling, because the land’s rising.
Lots of tidal gauge measurements here, http://www.sealevel.info/, under the “Data” tab.
As NOAA states in their Tides and currents “The graphs give an indication of the differing rates of vertical land motion, given that the absolute global sea level rise is believed to be 1.7-1.8 millimeters/year”
Adam, yes local changes in sea level are important to those affected by them. And a Glacial Isostatic Adjustment must be allowed for in global SLR calculations. Satellite measurements add .3mm/yr for GIA.
Australia has a 30 year old high accuracy monitoring project for sea level around the Australian coastline. The trends even on this small geographic scale range from 2.7 to 7.4mm/yr. This is the latest report:
http://www.bom.gov.au/ntc/IDO60201/IDO60201.201805.pdf
Table 1 on page 8 list the rate of rise at each station.
[…] See also here […]
Four years ago I wrote a series of articles here on sea level. Here is the link to the one that is most appropriate to this article. GIA must be taken into account at every tide gauge for all the data to make sense.
https://notrickszone.com/2014/04/18/long-term-tide-gauge-data-show-21st-century-sea-level-rise-will-be-approximately-as-much-as-the-20th-century/#sthash.LWrIrODI.dpbs
Thanks. I recognize a data source or methodology change from my technical work. Few do, however.
Looking at the global temp data source changes and the correlated warming increases, I say the changes in source (and station numbers) is causitive, not just correlative. The dropout by itself says post-90s trends are not reliably compared to the pre-90s trends.
I would be very interested in a temp history using the SAME stations. But – any bets the post-90s no longer include many pre-90s stations?
Call me suspicious, but I bet the later data stream is statistically not equivalent to the previous.
I’d bet on that, as well, based on the data tampering shenanigans the warmist “scientists” have been indulging in.
[…] ONLY 0.8% Of Coastal Tide Gauges Show Sea Level Rise On Track To Reach IPCC Year 2100 Projection! Source […]
[…] Read more at No Tricks Zone […]
[…] https://notrickszone.com/2018/06/23/only-0-8-of-coastal-tide-gauges-show-sea-level-rise-on-track-to-r… […]
[…] https://notrickszone.com/2018/06/23/only-0-8-of-coastal-tide-gauges-show-sea-level-rise-on-track-to-r… […]