Brimstone and fire predictions of an ice-free Arctic made 10 years ago by leading scientists, politicians and media outlets are emerging today as preposterous.
Recently climate catastrophe non-believers have been pointing out that Arctic sea ice volume has been gaining over the past years and has not trended downward for some dozen years now.

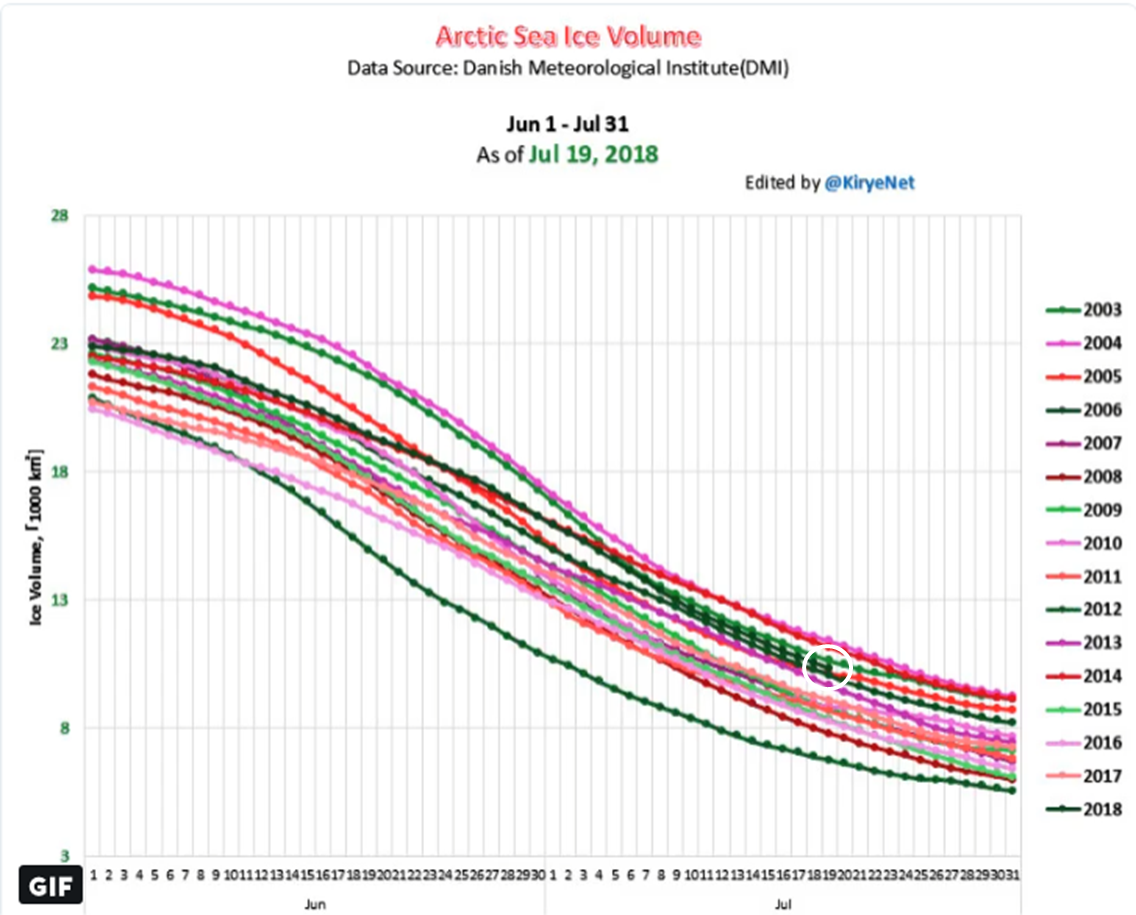
Image source unknown, Fair Use.
And global warming alarmists have been very silent on the subject of climate change now that global surface temperatures have cooled and Arctic and Greenland snow and ice have rebounded.
Embarrassed, they don’t want to be reminded of all the absurd predictions they made 10 years ago, with some as recently as just five years ago.
Now is a good time to remind them and ourselves once more of these preposterous, charlatan-quality predictions.
Germany’s Die Welt: “Ice-free” by 2013
For example in 2007, German online national daily Die Welt here warned that “an team of international climate scientists and researchers at NASA claimed the Arctic summer would be ice-free already in 2013.
According to Die Welt, NASA’s “climate expert” Wieslaw Maslowski of the Naval Postgraduate School in Monterey made the claim at a meeting of the American Geophysical Union.
Al Gore warned in 2007, 2008 and 2009
At about the same time, climate crusader Al Gore also preached of an imminent Arctic sea ice doomsday. The New American here wrote:
In 2007, 2008 and 2009, Gore publicly and very hysterically warned that the North Pole would be ‘ice-free’ by around 2013 because of alleged ‘man-made global warming.’ Citing ‘climate’ experts, the government-funded BBC hyped the mass hysteria, running a now-embarrassing article under the headline: ‘Arctic summers ice-free ‘by 2013’.’ Other establishment media outlets did the same.”
Sereeze on CNN Fake News: “50-50 chance” of ice-free Arctic
Not only rabid activists or hysterically mad NASA scientists were seeing visions of the end of the Arctic, but also a lead scientist at the National Snow and Ice Data Center (NSIDC). Mark Sereeze announced on CNN in June 2008 that there was a 50-50 chance the Arctic would be ice-free by the end of the summer.
Well, at least give Sereeze credit for admitting to some uncertainty.
Hansen: Arctic ice-free in 2018 at the latest
Not long ago Tony Heller at Real Science here reported that NASA’s James Hansen said on June 23, 2008: “We’re toast if we don’t get on a very different path,” and that Hansen and his fellow scientists saw a tipping point occurring right before their eyes and that the Arctic was melting exactly the way they said it would.
Hansen added that the Arctic would be ice-free in 5 to 10 years. It never happened.
Spiegel: sailboats in an open Arctic in 2008
On June 27, 2008, Germany’s Der Spiegel cited scientists when it reported that the Arctic was “melting at a brutal speed”.
The German flagship weekly also quoted researcher Olav Orheim of the Norwegian Research Council: “Already last October I was predicting that the Arctic could be ice-free this summer” and “In August or September we will be seeing people cruising in sailboats up there.”
NASA’s Jay Zwally: Nearly ice-free by end of summer 2012.
NASA climate scientist Jay Zwally was also cited by the National Geographic, which reported: “…after reviewing his own new data, NASA climate scientist Jay Zwally said: ‘At this rate, the Arctic Ocean could be nearly ice-free at the end of summer by 2012, much faster than previous predictions’.”
John Kerry: Ice-free in 2013, not 2050
On October 16, 2009, Senator John Kerry at the Huffington Post here called climate change a “national security threat” and wrote:
It is already upon us and its effects are being felt worldwide, right now. Scientists project that the Arctic will be ice-free in the summer of 2013. Not in 2050, but four years from now.”
Sierra Club Canada, 2013: “Ice-free this year”
The Sierra Club Canada reported in 2013 that the Arctic would be ice-free that year.
However readers will notice that the link no longer functions. Maybe the story simply became too embarrassing and so it was taken down.
The Wadhams debacle
Finally, Peter Wadhams, Professor of Ocean Physics, Head of the Polar Ocean Physics Group in the Department of Applied Mathematics and Theoretical Physics at the University of Cambridge, said in 2007 that Arctic sea ice would be lost by 2013. Recall that Wadhams was a renowned expert.
Six years later — in 2013 — the sea ice instead had grown by 25%! In 2012 Prof. Wadhams changed his prediction to 2016. That too never happened.
And climate alarmists are still baffled that there are skeptics out there?
Reality: today Arctic 3rd highest sea ice volume in 16 years
Today Arctic sea ice shows no signs of melting away, and in reality it recently reached its third highest volume for a few days since 2003, according to Japanese climate blogger, Kirye at Twitter:


” the link no longer functions “
A good analogy for Gore, Kerry, and all the others mentioned.
Now if we could make them disappear too, life would be good.
50/50 chance we’re ice free 5 years from now. Trust me, I’m a (social) scientist.
Warmists have quieted down a lot in recent weeks, not just over Sea Ice either.
The headless chook is still running hard, though.
Except at weekends. 😉
I posted this article at a forum yesterday, the result is hilarious warmist replies.
They are IGNORING the Prediction failures, to push the boring the ice pack is shrinking babble instead, which doesn’t help their case anyway.
http://www.usmessageboard.com/threads/charlatans-of-the-arctic-laughing-stock-ice-free-arctic-predictions-fake-science-at-its-best.698555/#post-20438023
From that forum, you wrote:
I’d really like to have your level of imagination … wow! You are really seeing the world with different eyes than the rest of us, aren’t you?
If you want to know about real failed predictions you need not look further than the person who writes the most articles on this blog 😉
If you think Kenneth’s quotes have any merrit I challenge you to become a little bit more skeptical of what he writes. You are a skeptic, right? So why not apply that “skill” towards what “your side” is posting? You’d be surprised what you’ll find …
Who is “the rest of us”? Who are you imagining is reading your posts and agreeing with you?
I have been in this debate since 1990, I am well aware of what YOU represent, which is to promote warmist propaganda with false skepticism and fog up the debate.
Many of Mr. Richards replies are based on published science papers, which YOU reply with mostly Phhhthh!
You did it again with your whining comment.
They’ll be back in the northern summer. Just watch all those hottest ever records.
It must be the weekend.. 😉
Nansen Arctic ROOS is offline. They don’t want the world to see that the Sea Ice area and extent are the highest for many years.
Amazing. Let’s see for how long. Do you know when it disappeared?
Maybe these fellows could shed some light:
http://eurogoos.eu/roos/arctic-roos/
Yap, there you have the dead observation and forecast links.
I sent a mail to that Norwegian guy, Stein Sandven.
[…] Full post […]
And it keeps looking more and more like the AMO is turning. The Arctic ice predictors really are going to look even more foolish than they already do in a few years if it is.
How foolish do you think skeptics look? None of their predictions came true in the last decade and when nothing you guys imagine up now happens in the next decade you’ll nevertheless feel like you are the experts and the real experts still have it wrong. What amount of warming and what amount of scientific evidence is necessary to convince you that you are wrong?
“…and the real experts still have it wrong.”
They are not the “real experts”, they are the alarmists, just like you, and you’re sure not an expert on anything.
“None of their predictions came true in the last decade…” Please identify these predictions. “None” seems a bit all encompassing to be believed. Could you be lying? I wonder…
Bill Hyde
Seb asks “How foolish do you think skeptics look? “
The answer is “Nowhere near as dumb as cAGW sheeple, running round like headless chickens, writing dross about manmade global warming.”
For full-on stupidity ask a cAGW true believer (for that is all they have!).
“What amount of warming and what amount of scientific evidence is necessary to convince you that you are wrong?”
Been ZERO warming for 33 of the last 40 years
Only from El Ninos.. Solar warmed ocean
You have presented ZERO scientific evidence for human caused warming.
That leaves you sort of NOWHERE and with NOTHING, doesn’t it seb
Maybe you could start by answering two simple questions..
Q1. In what way has the climate changed in the last 40 years, that can be scientifically attributable to human CO2 ?
Q2. Do you have ANY EMPIRICAL EVIDENCE at all that humans have changed the global climate in ANYWAY WHATSOEVER?
Or just continue you headless chook evasions.
When they predict no more summer sea ice, which gets picked up by the fawning Media, it is indeed news when their many specific predictions fails so utterly, yet people like YOU ignore it to post stupid babble in the desperate attempt to fog it up.
Take an entertaining look at Yahoo “answers” to, “Prince Charles views on Ice melt in the Arctic?” 7 years ago. Hysterical in every sense of the word.
https://answers.yahoo.com/question/index?qid=20110912001757AAy59DD&p=Prince%20Charles%20says%20ice%20free%20arctic
[…] Ref.: https://notrickszone.com/2018/07/21/charlatans-of-the-arctic-laughing-stock-ice-free-arctic-predictio… […]
Thanks
Climate charlatan: a strong contender for second edition of “The Devil’s Dictionary of Climate Change” published last month.
https://wattsupwiththat.com/2018/06/21/friday-funny-the-devils-dictionary-of-climate-change/
“the link no longer functions”
This link does:
https://web.archive.org/web/20140921053427/https://www.sierraclub.ca/en/AdultDiscussionPlease?fb_action_ids=633465710015337&fb_action_types=og.likes&fb_aggregation_id=288381481237582&fb_source=aggregation
“By Paul Beckwith
On March 23, 2013, I made the following prediction: “For the record—I do not think that any sea ice will survive this summer…”
The link takes ages to load and you may need to hit refresh, but there it is.
Oops,
some people will NOT be happy 😉
.. or will go into deeeeeeep denial.
“Goldman Sachs are predicting a 24% drop in new global solar installations this year.”
https://notalotofpeopleknowthat.wordpress.com/2018/07/22/new-solar-installations-to-contract-by-24-this-year/
Sure and normal people have been pointing out that even with the current ice volume staying constant the Arctic can be “ice free”.
So you keep claiming this? Frist half of 2018 was the 3rd warmest ever recorded, Greenland has maybe gained a little bit of mass in the last season, but overall is on an ice loss trend. The Arctica ice extent is still perfectly on the long term trend line (with skeptics trying to make the start of their “stable fantasy” a year with extremely low extent). Antarctica is losing massive amounts of ice mass.
Shall we compile a list of skeptic predictions from 10 years ago?
NO seb, the long term Arctic Ice trend has been UPWARDS, up until the LIA, the EXTREMES that nearly led the world into another full Ice Age.
The late 1970’s extent was up there with LIA extents.. Anomalously HIGH.
Current levels are STILL well above average for the current interglacial, because the world is only a degree or so warmer than the COLDEST period in 10,000 years.
Thank goodness for the very slight RECOVERY from those HUGE extents, even though current extent is still in the top 10$% of the current interglacial..
Unfortunately, looks like the AMO has turned and Arctic sea ice will be increasing,
NO HUMAN CAUSE, just NATURAL CYCLES.
West Antarctic is only loosing ice from volcanic activity. East Antarctic is GAINING
NO HUMAN CAUSE.
“normal people have been pointing out that even with the current ice volume staying constant the Arctic can be “ice free”.
ROFLMAO,
No, the person who came up with load of bollocks is a reality-challenged INEPT FOOL.. one of your friends, perhaps? In the same reality-free anti-science zone that your tiny mind lives in ???
Firstly 1 million km² = 1 Wadham, is NOT “ice free”.
It is nearly 3 times the area of Germany. Is Germany “land-free”
Secondly, there is zero possibility of the Arctic being Ice free while the world is at such a low temperature, only just above the COLDEST in 10,000 years.
Only in MUCH warmer temperatures like the first 7000 or so years of the Holocene, could the Arctic be “ice-free” even in summer.
[…] NoTricksZone: By P Gosselin on 21. July […]
But there is this Call to Action:
Speaker of the House blocking emergency debate on the massive Arctic ice melt 2012-10-04
…
As climatologist Paul Beckwith from Ottawa U’s Laboratory for Paleoclimatology and Climatology told us last week, in all likelihood, for the first time in at least 3 million years, the icecap will be completely gone by the end of 2015. Paul also told us to “hold on because our weather patterns will be drastically destabilized.”
…
That link that no longer works at the Sierra Club website has been archived by archive.org. The article was written by the dimwit Paul Beckwith… who is a laugh and a half to read and watch.
Anyhow, the archived article is available here: https://web.archive.org/web/20140719175222/https://www.sierraclub.ca/en/AdultDiscussionPlease
[…] Charlatans Of The Arctic… Laughing Stock Ice-Free-Arctic Predictions …Fake Science At Its Best […]
No mention that sun spots are way down, and hence the sun’s emissivity is no longer warming the earth as much!
Ah great, you understand the problem … the Sun isn’t warming the planet as in previous cycles, but why has it nevertheless warmed? Why all the temperature records and increasing heat content?
This has been explained many times before. Total cloud cover reduction has allowed more solar radiative heat to be absorbed by the oceans since the 1980s. This has led to a positive trend in surface solar radiation during the 1980s-present period.
http://www.atmos-chem-phys.net/13/8505/2013/acp-13-8505-2013.html
“[T]here has been a global net decrease in 340 nm cloud plus aerosol reflectivity [1979-2011]. … Applying a 3.6% cloud reflectivity perturbation to the shortwave energy balance partitioning given by Trenberth et al. (2009) corresponds to an increase of 2.7 W m−2 of solar energy reaching the Earth’s surface and an increase of 1.4% or 2.3 W m−2 absorbed by the surface.”
–
http://www.sciencemag.org/content/308/5723/850.abstract
“Long-term variations in solar radiation at Earth’s surface (S) can affect our climate, the hydrological cycle, plant photosynthesis, and solar power. Sustained decreases in S [surface solar radiation] have been widely reported from about the year 1960 to 1990. Here we present an estimate of global temporal variations in S by using the longest available satellite record. We observed an overall increase in S [surface solar radiation] from 1983 to 2001 at a rate of 0.16 watts per square meter (0.10%) per year [1.6 W m-2 per decade].”
—
http://www.atmos-chem-phys.net/12/9581/2012/acp-12-9581-2012.html
“The Earth’s climate is driven by surface incident solar radiation (Rs). Direct measurements have shown that Rs has undergone significant decadal variations. … By merging direct measurements collected by Global Energy Budget Archive with those derived from SunDu [sunshine duration], we obtained a good coverage of Rs [surface incident solar radiation] over the Northern Hemisphere. From this data, the average increase of Rs [surface incident solar radiation] from 1982 to 2008 is estimated to be 0.87 W m−2 per decade [2.3 W/m-2 total]”
I don’t get this explanation. The last cycle was weaker than the one before. Shouldn’t that have increases the cloud cover according to that galactic ray theory? Why did the cloud cover not conform? If you say it is warm today because of clouds, cover should have decreased in recent years, right?
What did the cloud cover do in the last 9 years? Why do the usual skeptic graphs that try to correlate cloud cover with temperature only go up to 2009?
Besides, your quotes … does anyone of those consider that less clouds not only increases the solar radiation that reaches the surface, but also lets more LW radiation go directly to space? What is the actual net effect?
See, that is what a Kenneth-skeptic asks himself. A Kenneth just believes anything that seems to conform to his view of the world and uses it unreflected in his wild claims. A Kenneth-skeptic sees through that. We don’t believe you blindly when you put something like this out as some kind of fact 😉
“What did the cloud cover do in the last 9 years?”
Do you have any data, seb ?
Particularly in the tropics where Solar radiation is most absorbed
http://www.climate4you.com/images/HadCRUT3%20and%20TropicalCloudCoverISCCP.gif
Or are you just yapping again.
“What is the actual net effect?”
Why must you ALWAYS be so IGNORANT, seb???
Net effect of reduced cloud cover is warming.
Actual OBSERVED DATA (do you even know what that is ?)
http://www.climate4you.com/images/TotalCloudCoverVersusGlobalSurfaceAirTemperature.gif
“We don’t believe you blindly “
It is YOU that suffers from wilfully blind belief. Never questioning anything about the AGW agenda/scam, even though a most of it is totally unsupported by anything remotely resembling actual science.
You are totally unable to back up even the simplest of AGW memes. ie CO2 warming anything, anywhere, anytime.. That is just blind, ignorant belief.
K backs his comments with actual science
seb back his comments with EMPTY MINDLESS BLUSTER.
On a global scale, absorbed surface solar rardiation looks like it remained steady between 1997-2015:
https://notrickszone.com/wp-content/uploads/2018/02/Surface-Solar-Radiation-1997-2015-Feng-Wang-2018.jpg
Feng and Wang, 2018
“Surface Incident solar radiation (Rs), which is also often referred to as the downward solar irradiance, is a key parameter in many climate and ecological processes, such as evapotranspiration, canopy photosynthesis, net primary production, crop growth management, and so on. Long-term Rs datasets with global coverage and reasonable accuracy have a great value these days. Globally-distributed ground observations of Rs began in 1958, and provide solid evidence for global dimming and brightening.”
—
Pfeifroth et al., 2018
“The incoming solar radiation is the essential climate variable that determines the Earth’s energy cycle and climate. In this study, these new climate data records are compared to surface measurements in Europe during the period 1983–2015. The results show an overall brightening period since the 1980s onward (comprised between 1.9 and 2.4 W/m2/decade), with substantial decadal and spatial variability. The strongest brightening is found in eastern Europe in spring. … We conclude that the major part of the observed trends in surface solar radiation in Europe is caused by changes in clouds and that remaining differences between the satellite- and the station-based data might be connected to changes in the direct aerosol effect and in snow cover.”
—
Myers et al., 2018
“Between 2013 and 2015, the northeast Pacific Ocean experienced the warmest surface temperature anomalies in the modern observational record. This “marine heatwave” marked a shift of Pacific decadal variability to its warm phase and was linked to significant impacts on marine species as well as exceptionally arid conditions in western North America. Here we show that the subtropical signature of this warming, off Baja California, was associated with a record deficit in the spatial coverage of co‐located marine boundary layer clouds. This deficit coincided with a large increase in downwelling solar radiation that dominated the anomalous energy budget of the upper ocean, resulting in record‐breaking warm sea surface temperature anomalies. Our observation‐based analysis suggests that a positive cloud‐surface temperature feedback was key to the extreme intensity of the heatwave. The results demonstrate the extent to which boundary layer clouds can contribute to regional variations in climate.”
—
Hu et al., 2018
“During the global warming hiatus period, the transfer of latent heat energy from the ocean to atmosphere increases and the total downward radiative energy flux to the surface decreases due to a reduction of solar absorption caused primarily by an increase of clouds. … Observational evidence indicates the global-mean surface temperature (GMST) has experienced a relatively rapid warming from the early-1980s to the early-2000s, but has nearly stalled since, producing what is known as the ‘global warming hiatus’ period (Easterling and Wehner 2009; Knight et al. 2009; Liebmann et al. 2010; Solomon et al. 2010; Cowtan and Way 2014; Trenberth 2015). … Another important contributor to the rapid warming is the increase of shortwave (SW) irradiance received by the surface, referred to as the “global brightening” (Wild et al. 2005; Ohmura 2009; Wild 2009, 2012). The increase in shortwave irradiance is closely related to the decrease in cloud cover in the early 1980s (Eastman and Warren 2013). … Internal climate variability is also thought to substantially contribute to the rapid warming pace”
—
Liu et al., 2018
“Sunshine duration was the main driving force behind the trend in Tmax [maximum temperature] and DTR through a change in downward shortwave radiation that altered the energy source of daytime temperature. Water vapour was the major driving force for temperature change over the NTP, while over the STP, sunshine duration dominated the temperature trend.” [CO2 concentration changes are not mentioned in the paper as a factor in the 1982-2015 temperature changes.]
—
Hukuba et al., 2017
“At 36 locations worldwide, we estimate the cloud radiative effect (CREatm) on atmospheric solar absorption (ASRatm) by combining ground-based measurements of surface solar radiation (SSR) with collocated satellite-derived surface albedo and top-of-atmosphere net irradiance under both all-sky and clear-sky conditions. To derive continuous clear-sky SSR from Baseline Surface Radiation Network (BSRN) in-situ measurements of global and diffuse SSR, we make use of the Long and Ackerman (2000) algorithm that identifies clear-sky measurements and empirically fits diurnal clear-sky irradiance functions using the cosine of the solar zenith angle as the independent variable. The 11-year average (2000-2010) CREatm (all-sky minus clear-sky) is overall positive at around +11 Wm-2 using direct measurements form ground and space, and at 4 Wm−2 in the CERES EBAF dataset. This discrepancy arises from a potential overestimation in clear-sky absorption by the satellite product or underestimation by the combined BSRN/CERES dataset. The forcing ratio R shows that clouds enhance ASRatm most distinctly at desert-like locations that overall experience little occurrence of clouds. This relationship is captured by both the combined dataset and CERES EBAF.”
—
Alexandri et al., 2017
“In this work, the spatiotemporal variability of surface solar radiation (SSR) is examined over the Eastern Mediterranean region for a 31-year period (1983–2013). … The satellite-based data from CERES (Cloud and the Earth’s Radiant Energy System), GEWEX (Global Energy and Water Cycle Experiment) and ISCCP (International Satellite Cloud Climatology Project) underestimate SSR while the reanalysis data from the ERA-Interim overestimate SSR compared to CM SAF SARAH. Using a radiative transfer model and a set of ancillary data, these biases are attributed to the atmospheric parameters that drive the transmission of solar radiation in the atmosphere, namely, clouds, aerosols and water vapor [CO2 not mentioned].. … The CM SAF SARAH SSR trend was found to be positive (brightening) and statistically significant at the 95% confidence level (0.2 ± 0.05 W/m2/year [2 W m-2 per decade].”
Your baiting attempt isn’t worth responding to other than to say this: My “wild claims” are backed up by peer-reviewed scientific papers.
Current Arctic ice extent is approximately 5 Wadhams.
The mad professor single-handedly brought a new unit of measurement to the world.
He also wouldn’t bet on his own predictions.
A couple of years ago, over on Wattsupwiththat, I read that he declined to take on a bet that the ice extent that year would match his prediction.
No, that’s what bullies do. Trying to mock people by using and/or changing their opponents name in creative ways to annoy them. I hope you feel great in joining this practice …
When he goes around claiming what an expert he is, makes such an absurd prediction, and then refuses to back down from it, I’d say he more than deserves the honor.
Of course, Goose man …
P.S.: Will the comment fields ever be fixed? Or am I the only one who has to retype his name and e-mail every time?
At the alarmist sites, like Real Climate or at the Twitter accounts of alarmist scientists, people with different opinions don’t even get the chance to comment. So be happy with what you’ve got and learn to stop complaining for once. Your problem is that you’re the type who is happy only if you get your way.
I will be happy when you guys finally realize that you have a very distorted perception of reality and let it cloud your judgement of what is correct and what is clearly BS 😉
And yes, I like to complain when I see BS. Not silently standing by while you guys try to spread it. And yes, I appreciate that you (most of the time) allow critical comments on your blog. Hope it is not only to be entertained by what the stranger skeptics reply to us.
We think your perception of reality — that humans exert fundamental control over the weather and climate and ice melt and sea levels and hurricane strength and species extinctions and oceanic pH levels by burning more or less CO2 — is very distorted. Extraordinary claims/perceptions like that require extraordinary evidence…which you have failed to deliver. I doubt we’re going to change our perceptions. Nor you, ours.
I have to as well and on all devices. And I think because of that you also have to wait for an approval of every comment. It is either a cookie problem or they flagged us.
I think P Gosselin’s comment is 100% true, we are flagged.
“I will be happy when you guys finally realize that you have a very distorted perception of reality “
Which of your orifices did you drag that out of.
seb, just “making things up” yet again.
His own little Fantasy make-believe world.
Your grasp on REALITY is highly TENUOUS, little seb.
Poor headless chook hasn’t been able to “make up” answers to two simple questions, have you seb-troll.
Q1. In what way has the climate changed in the last 40 years, that can be scientifically attributable to human CO2 ?
Q2. Do you have ANY EMPIRICAL EVIDENCE at all that humans have changed the global climate in ANYWAY WHATSOEVER?
Everyone is still waiting for you to show us your twisted, warped, anti-science “reality”, seb
Let the headless chook evasion tactics continue.
“I like to complain when I see BS.”
No seb, you just like to complain, like a whinging little troll.
and you do so with BS
Its your ONLY option because it all you have available to you.
“I will be happy when you guys finally realize that you have a very distorted perception of reality and let it cloud your judgement of what is correct and what is clearly BS”
Written like a true religious believer SebastianH, not much room for skepticism or doubt that YOUR computer generated version of this planet is wrong.
Spike,
Maybe your Qs are too strict. Be fair and let him instead give us two or three strong bullet point he can select himself.
No, he keeps rabbiting on about human influence causing warming.
But is totally unable to produce one tiny bit of evidence.
He’s not getting off the hook.
Either he has solid scientific evidence..
..OR HE DOESN’T
[…] by P. Gosselin, July 21, 2018 in NoTricksZone […]
[…] Link: https://notrickszone.com/2018/07/21/charlatans-of-the-arctic-laughing-stock-ice-free-arctic-predictio… […]