
Guest post by Kirye in Tokyo
An analysis of the rural-sited Japanese weather stations used by the Japanese Meteorological Agency (JMA) shows there’s been no warming at all over the the past 2 decades or more.
Strangely many of these stations, which are practically unimpacted by data-corruptive urban sprawl, are no longer used by NASA.
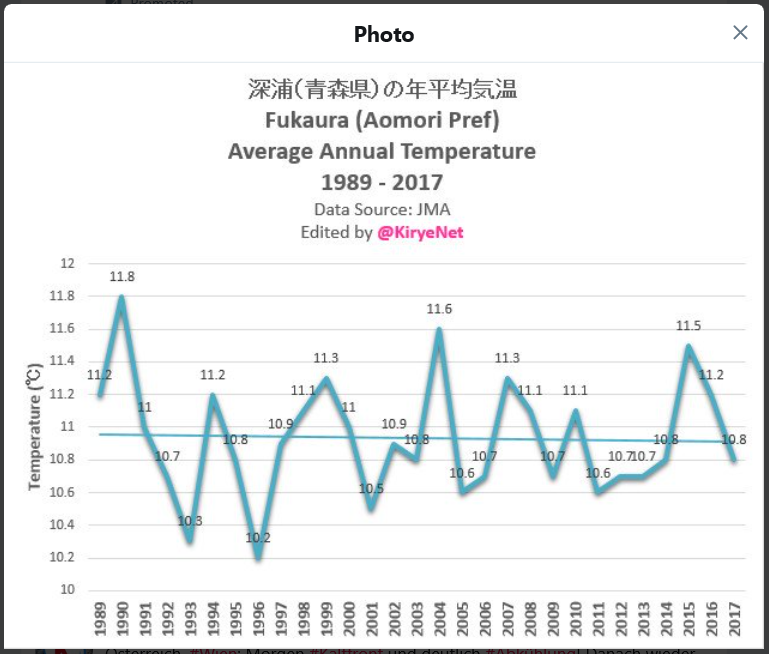
For example, NASA quit using the rural Fukaura station back in 1990. Up to that point Fukaura was cooling notably. What follows is the NASA chart for Fukaura:
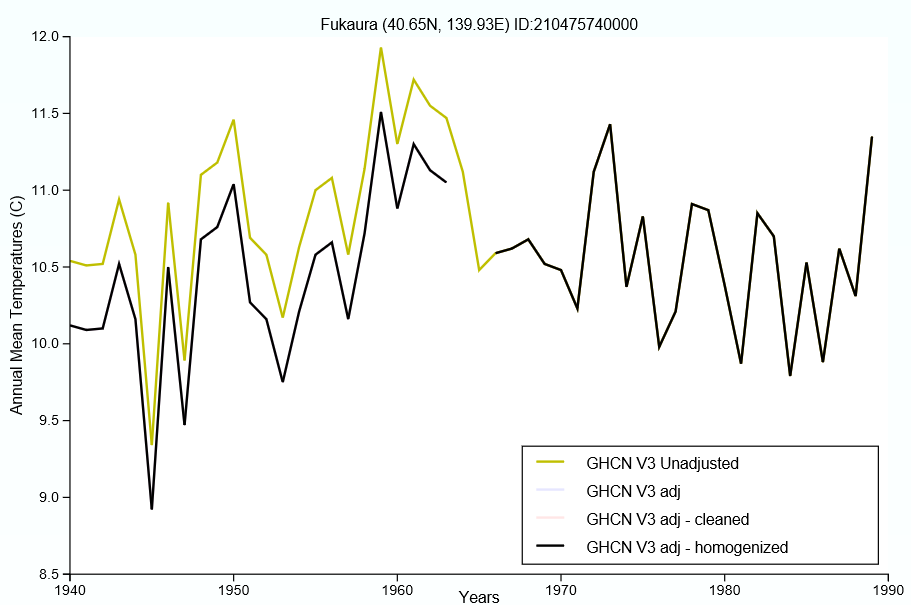
Fukaura showed cooling before NASA dropped the station in 1990. Image: NASA
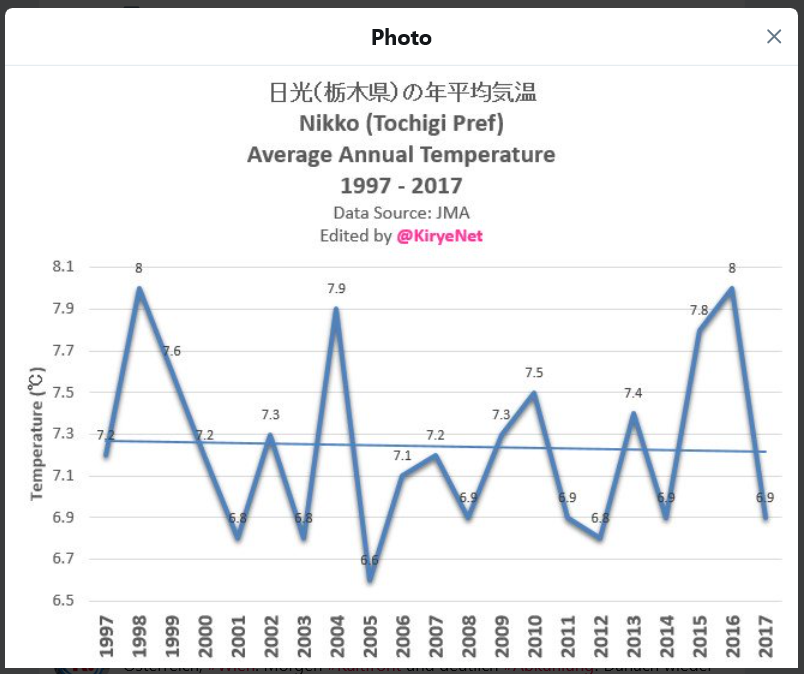
The same, for example, is true for Nikko.
NASA dropped rural Japanese stations
What follows below is a list of the rural stations I examined, which have a Brightness Index (BI) of 10 or less. The far right column shows the period they were used by NASA.
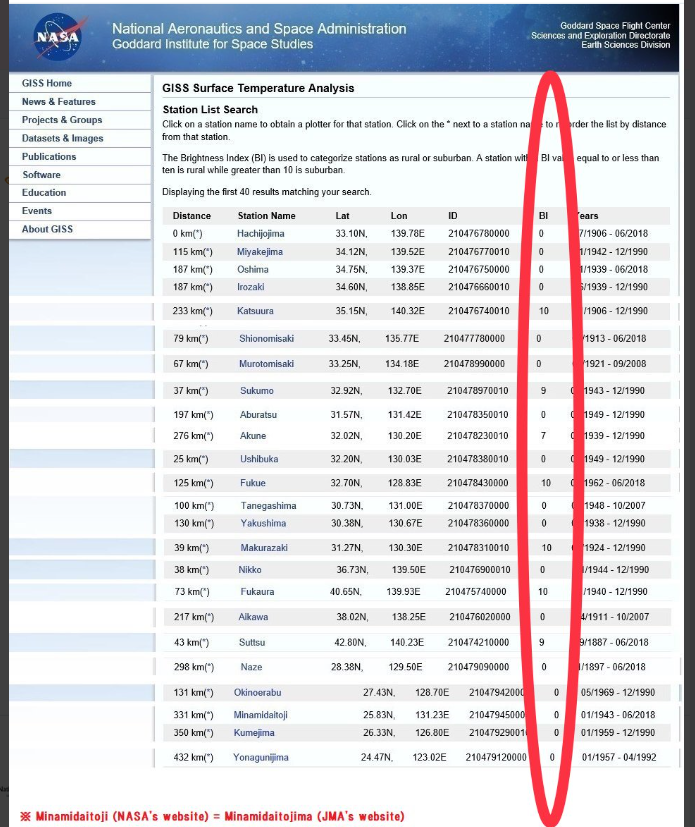
Source: NASA.
My earlier enquiries about stations sent to NASA via the Internet went without any answer. Perhaps they don’t reply to foreign requests. I don’t know.
The next chart below is the geographical plot of these rural sited stations. As you see they are all well scattered across the country:

Google Earth map showing location of the rural stations.
JMA data in fact show no warming
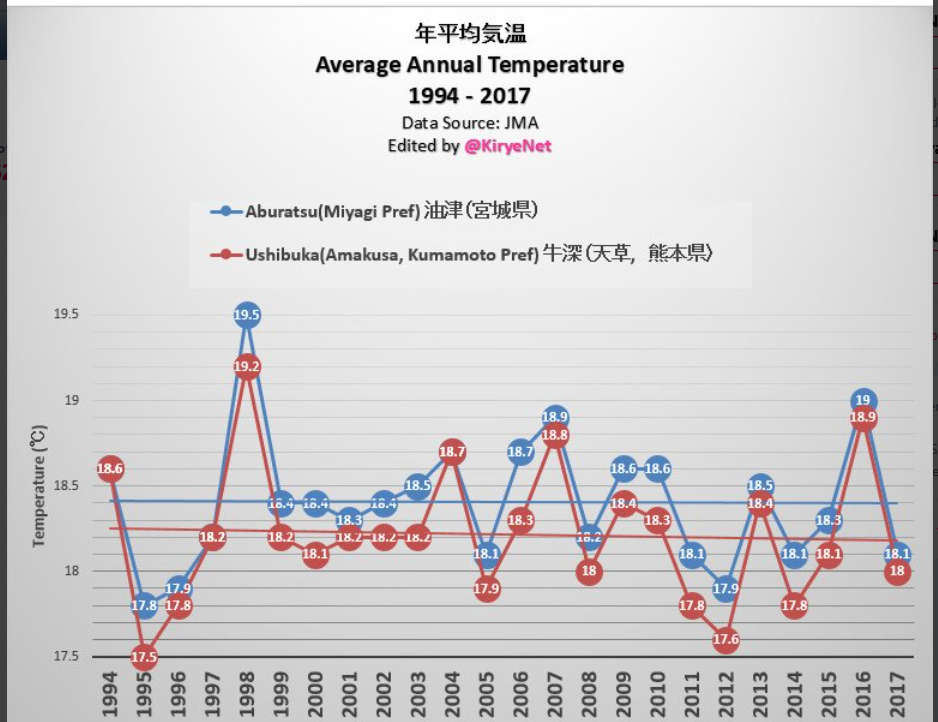
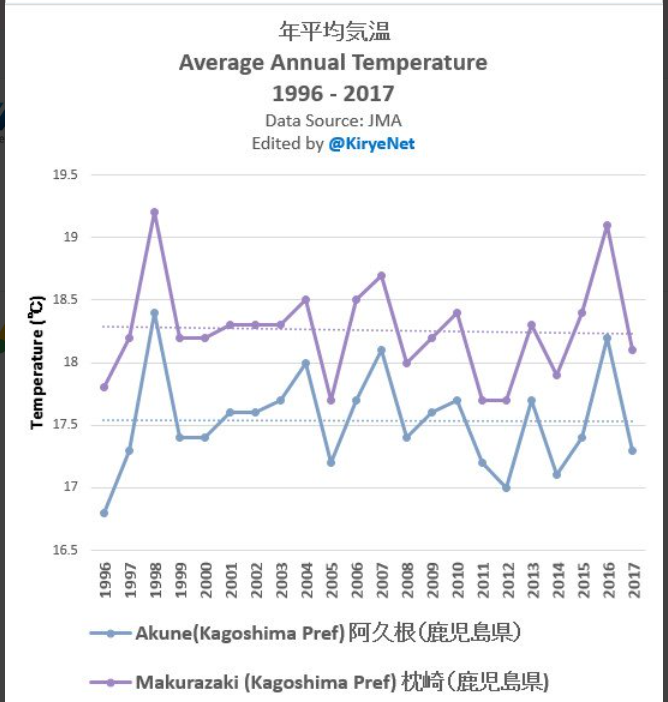
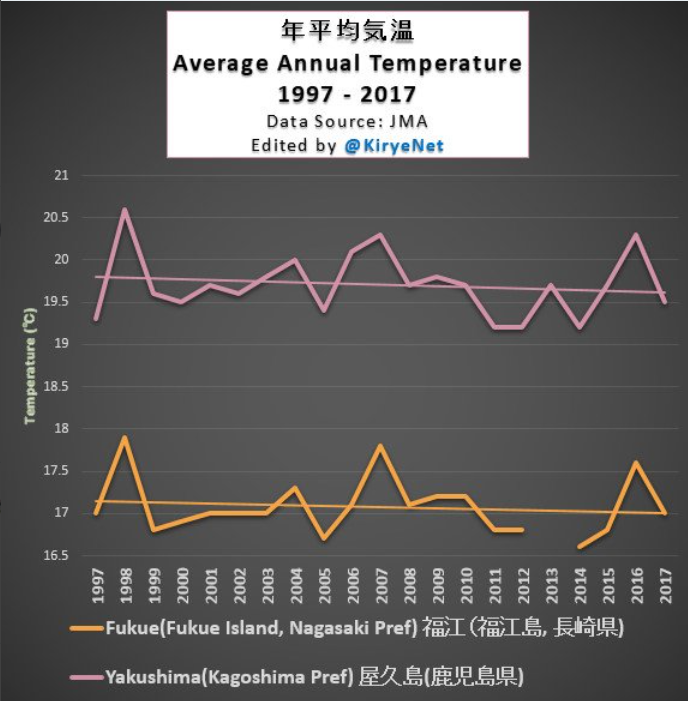
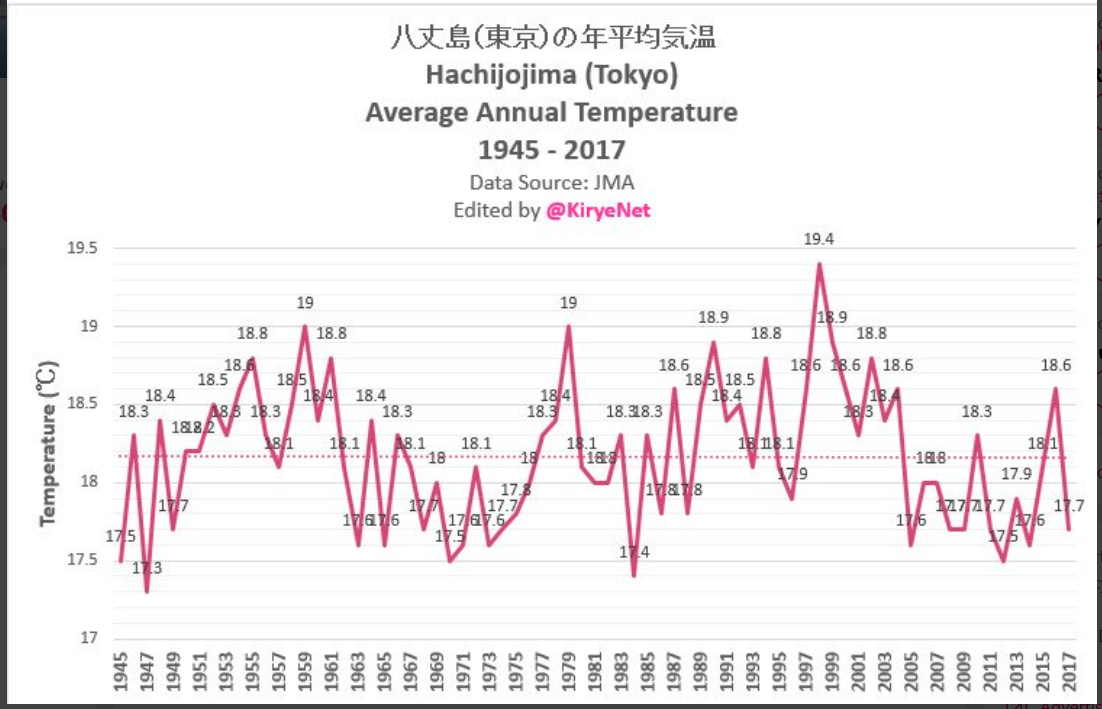
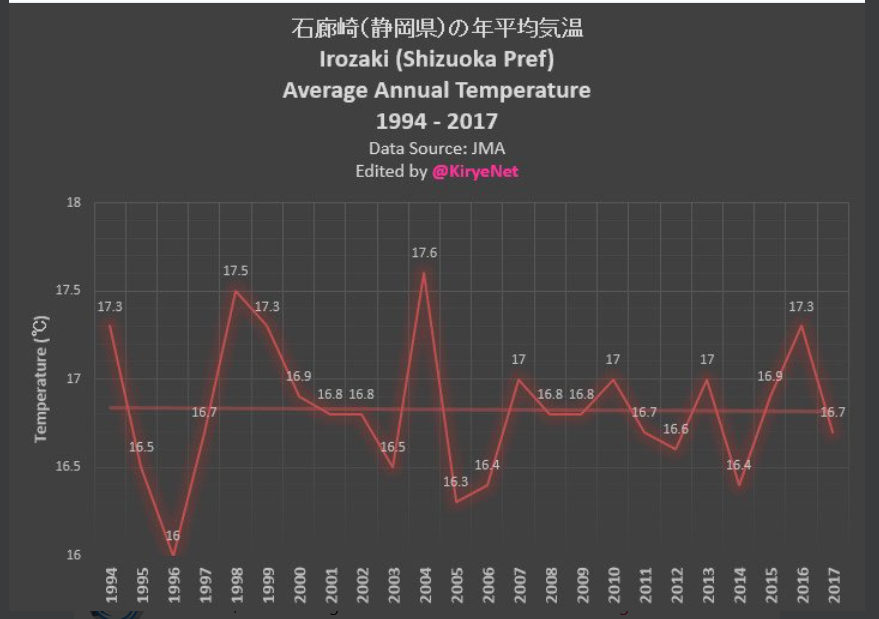
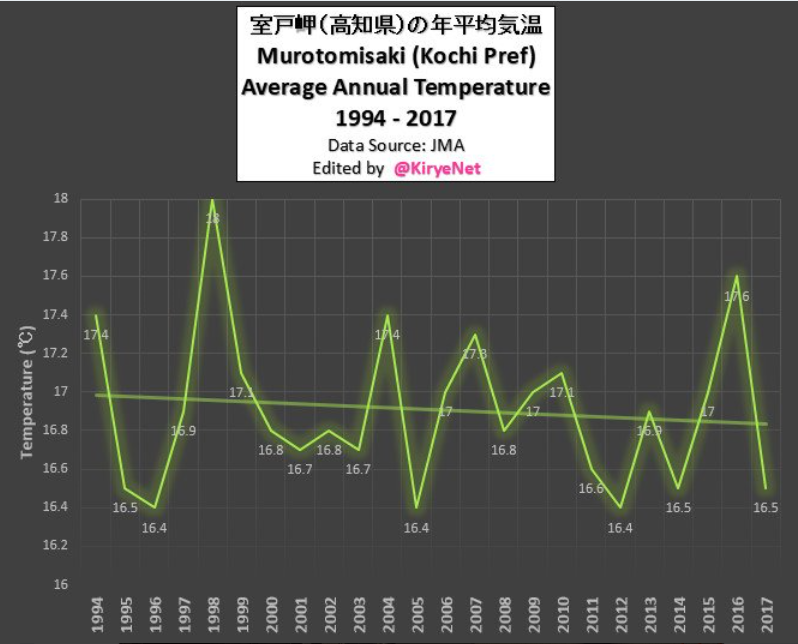
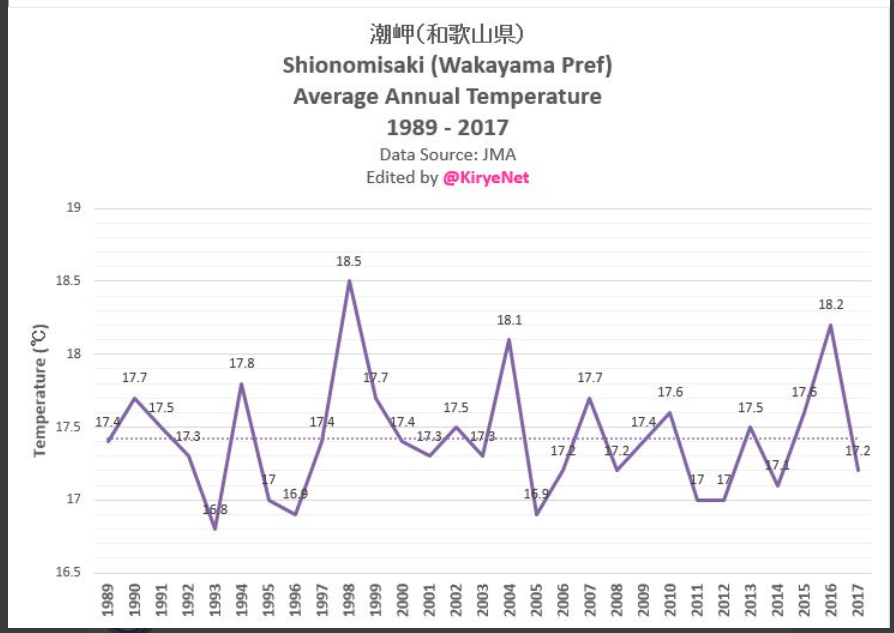
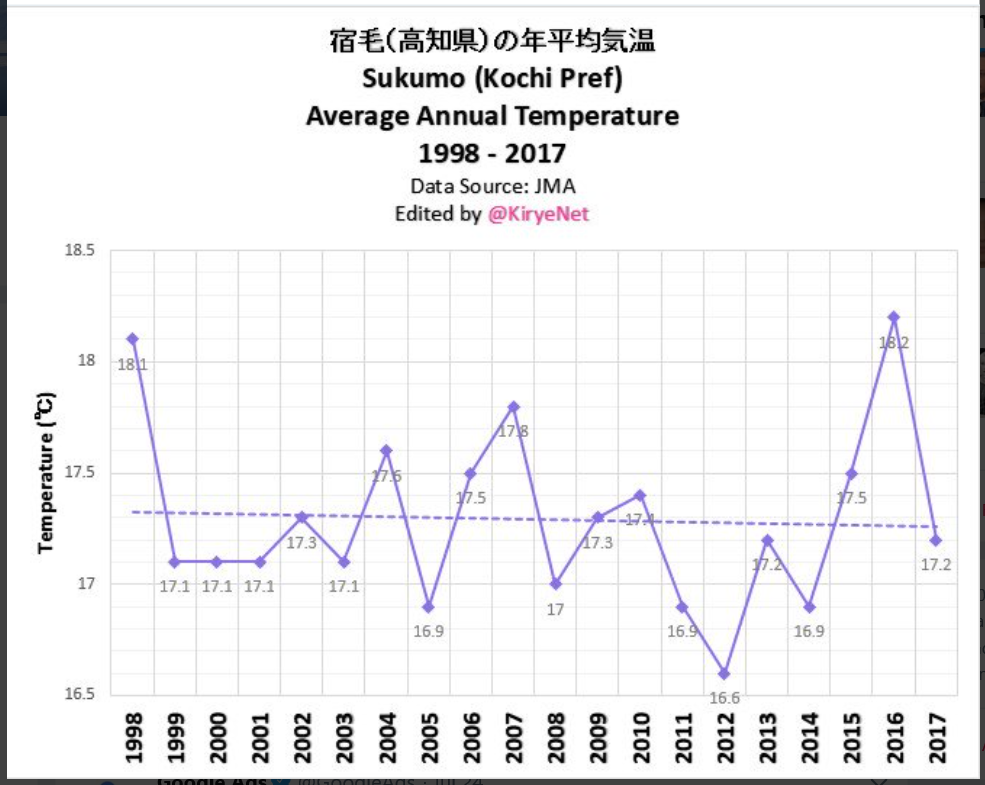
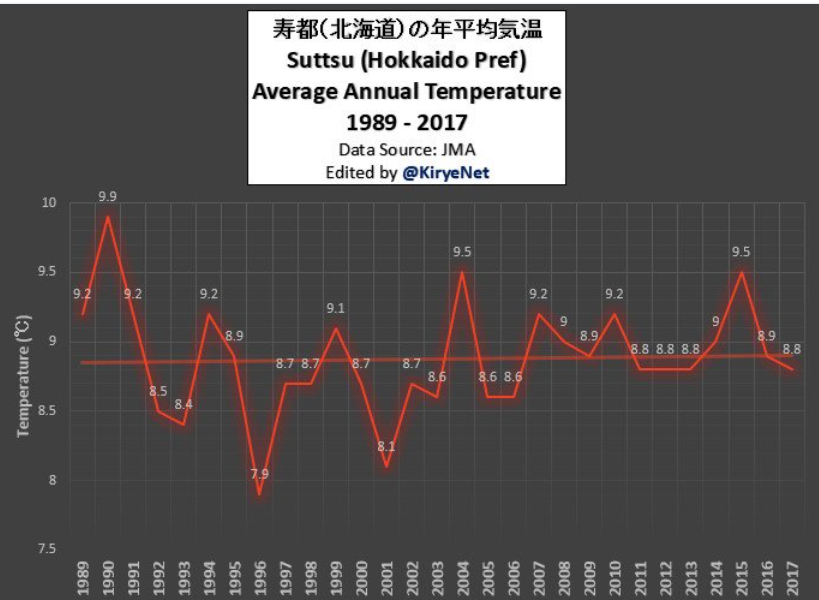
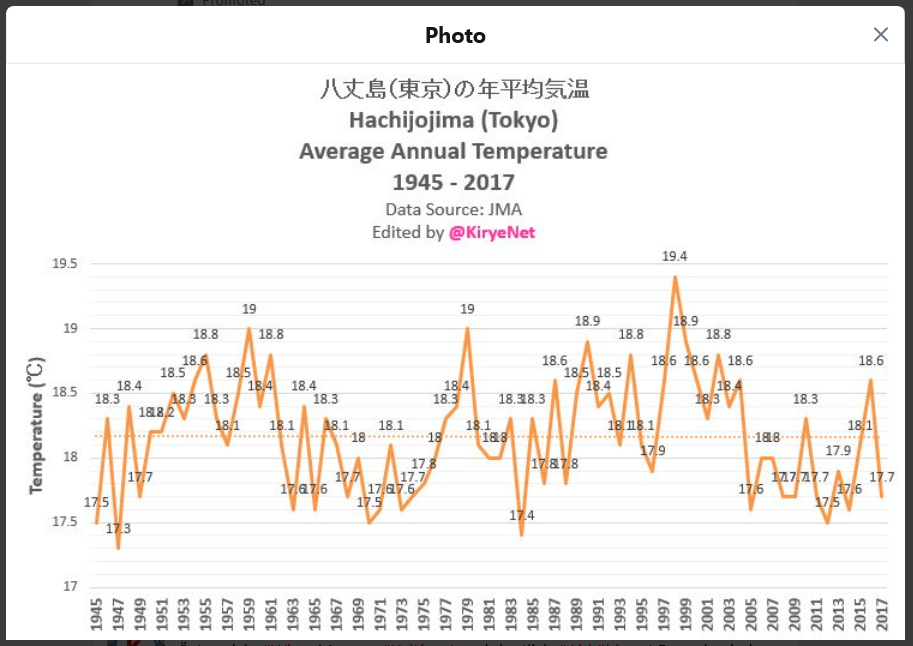
What follows below are temperature charts for each station, using the data from the JMA, arranged in more or less alphabetical order. On some charts I plotted more than one station.
Over 90% of rural stations show cooling or no trend
Of the 24 stations plotted, 22 show no change or some modest cooling over the past two or more decades – that’s more than 90%. Only two stations show some warming, but only a very modest amount.
![]()
Data Aikawa here. Oshima here. Katsuura here. Miyakejima here.
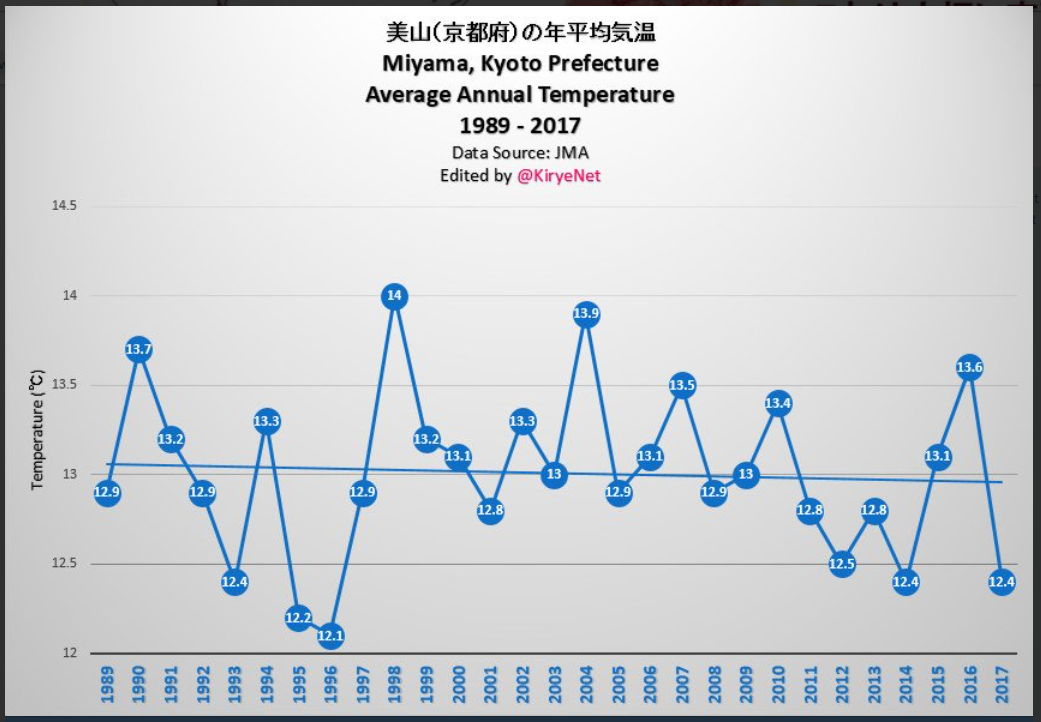
Miyama data. Note: NASA has never used Miyama’s temperature data, but the rural area in Kyoto Pref is also a slight cooling trend.

![]()
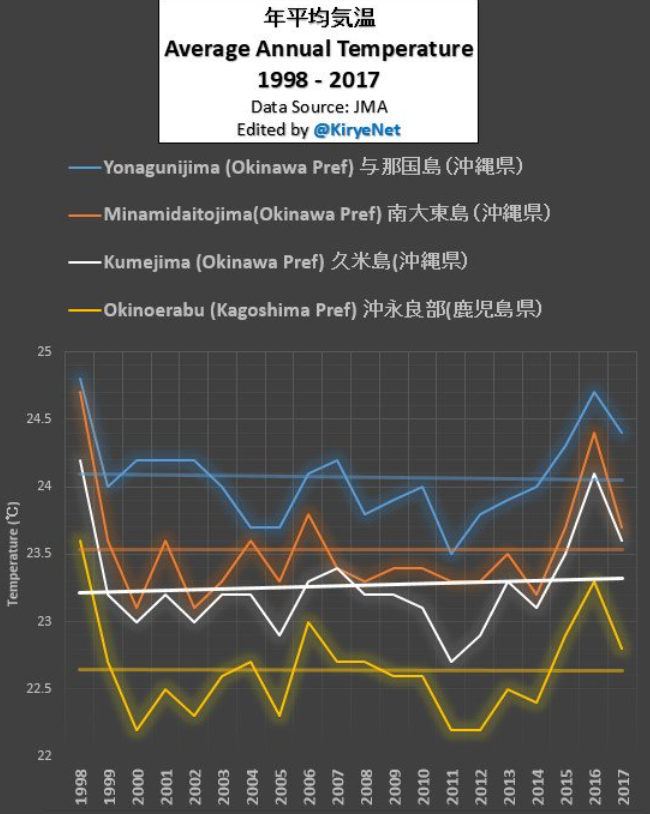
Okinoerabu data, Minamidatojima data, Kumejima data, Yonagunijima data
Japan shows no warming over past 2 decades
What follows next is the chart for all of Japan for the last 20 years, using data from the JMA:
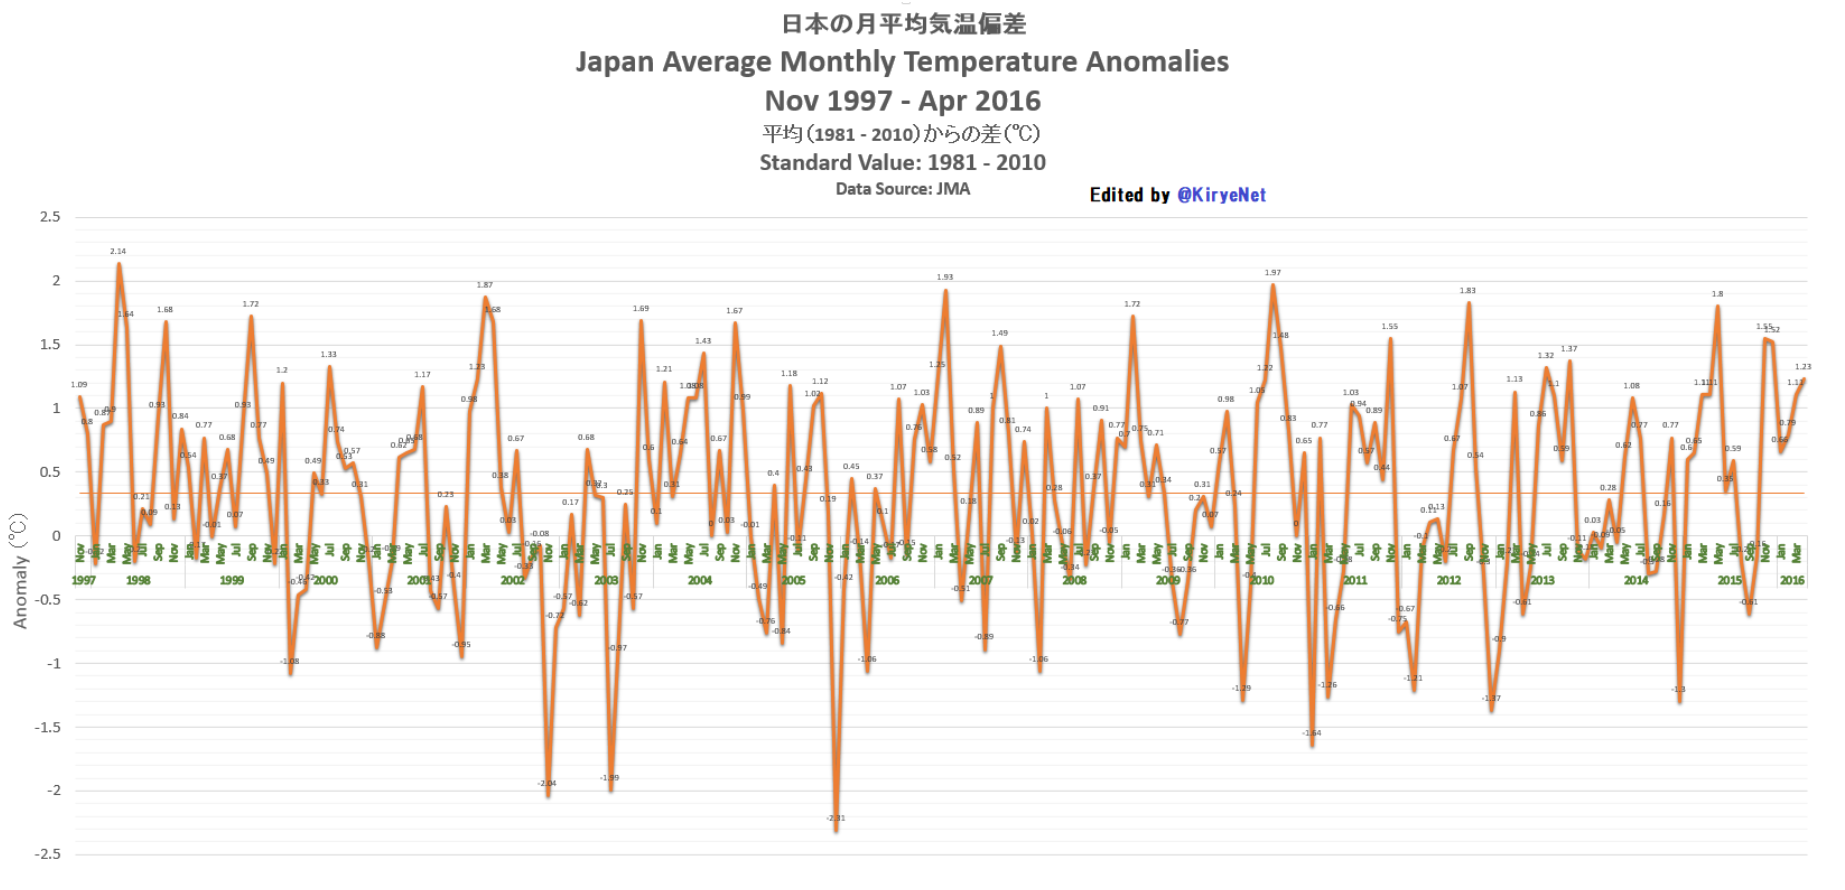
As the chart above shows, using JMA data, the whole country of Japan shows no warming over the past two decades.
Urban environment
Tony Heller at Real Science here shows the environment that many Japanese weather stations – like the ones NASA use – find themselves having to deal with. 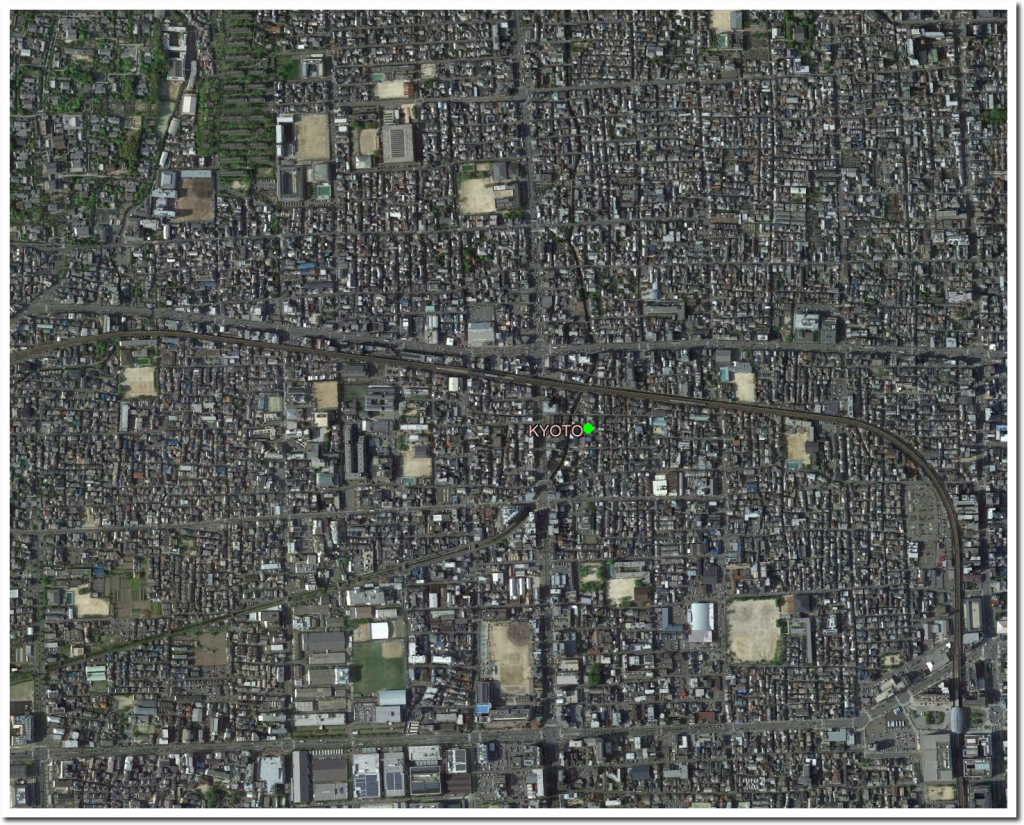
But as the temperature chart for all of Japan mentioned above shows, even the urban heat island effect still is unable to produce warming over the past 20 years. Without the cities one could rightfully argue there would be a cooling trend.
=====================================================


I’m wondering what role the oceans that surround Japan play in maintaining such a stable climate as Japan seems to have. Certainly if their heat content were increasing significantly, it would show up in Japan’s temperature record, but that doesn’t seem to be the case. Very interesting, IMO.
No only has there been NO WARMING in Japan for the last 2 decades, before a slight step type warming around 1990-1995, there was NO WARMING from 1950-1990 during the height of Japanese industrial expansion.
https://s19.postimg.cc/6kzq5cxdf/japan1950-1990.png
I have found exactly the same in Australia … when you get away from the cities. Example:
https://dl.dropbox.com/s/y1bebf4c7e2rio6/TMax_Coonabarabran.png?dl=0
As the DWD the JMA website has a graphing function for the temperature development in the different seasons:
http://www.data.jma.go.jp/cpdinfo/temp/sum_jpn.html
Use the dropdown at the top to get the 4 different graphs, my link is to the summer graph.
Japan isn’t cooling or stable.
Summer has nothing to do with temperature for every month for the last 20 years.
Then use the average annual temperature graphs provided on the JMA website:
http://www.data.jma.go.jp/cpdinfo/temp/an_jpn.html
Or if you want to know how a specific month changed in temperature over time:
http://www.data.jma.go.jp/cpdinfo/temp/jul_jpn.html
It’s all there.
If the point is that you are only looking at the last 20 years so the increase doesn’t look too steap or construct some “step like” temperature change that spike55 seems to “see” in any data he looks at, then ok … it is what it is, right? Overall the temperature in Japan increases as in the rest of the world. From the looks of the yearly graph even more so than in the rest of the world.
Wow! JMA shows long-term Japanese warming of 1.19C/100 years. Count me unimpressed.
Out of curiosity, what kind of increase would impress you?
Out of the COLDEST period in 10,000 years, at least up to the MWP or above.
Why are you so PETRIFIED of a tiny warming from that coldest of periods, seb?
Ocean warming of less than 0.1C in 50 or so years, and the headless chicken-little goes into a MANIC PANIC. !
Seriously warped mind !!!
Unfortunately the planet is about to head into a cooling trend.
Move to Siberia, seb.. you will be safe from the warmth there.
(Don’t forget you fossil fuel powered heaters, though, you know, the ones you have going flat-chat during the winter to keep you WARM)
So you really are saying that the coldest period was just 100 years ago?
Well … July 2018 was warmer than any July in the past 10000+ years according to scientists. So, are you impressed? Or will you employ the “it’s all fake anyway” argument now?
Scientists disagree:
An overall cooling trend since the 1500s:
https://notrickszone.com/wp-content/uploads/2018/08/Holocene-Cooling-Japan-Kawakubo-2017.jpg
SSTs 3-4 degrees C warmer than today during the Holocene Thermal Maximum
https://notrickszone.com/wp-content/uploads/2016/12/Holocene-Cooling-Pacific-NW-Yamamoto-16.jpg
https://notrickszone.com/wp-content/uploads/2017/01/Holocene-Cooling-Japan-Kawahata-17.jpg
Now that what? That you’ve made a false, unsupportable claim (again)?
Uh, I wasn’t precise … of course 2016 and 2017 were warmer.
This is how that looks like:
https://imgur.com/a/cWptkaN
Can you spot the region where the volcanoes are causing the anomaly to be 6+°C according to you, spike55? 😉
WOW, seb thinks active volcanoes are cold.
WOW, just wow. !!
And you should use so proper data, seb
not AGW invented junk
https://www.nsstc.uah.edu/climate/2018/july2018/JULY%202018.png
Would be interesting to see the article were the “scientists” say…
“July 2018 was warmer than any July in the past 10000+ years”
Because its a load of ignorant balderdash.
Temperature from MWP back were warmer than now.
.. and UAH has 2018 in 4th place even in the the very short period since 1979
So we KNOW its a LIE or a FABRICATION. !
UAH shows July 2018 SoPol to be in =9th place out of 40.
Not warm down there, seb
You are believing in LIES, as usual.
If you would read entire threads instead of just answering to one specific comment you’d know that this was a strange reply, Kenneth.
So tell us, how do SST graphs for Japan disagree with the sentence you quoted from my comment? Did I miss where I used a country name and referenced sea surface temperatures in this sentence?
Now that you constructed another straw man in a desparate attempt to blame me for something you made up once again … how do you feel? Better?
@spikey:
you are just unbelievable … and why do you need comment this many times in a row?
Geez, I wonder why lower tropical measurements would deviate from surface measurements. Any idea? 😉
I’ll use Kenneth’s sentence for you … “scientists disagree”:
https://www.nap.edu/resource/11676/Surface_Temps_final.pdf
https://www.ncdc.noaa.gov/global-warming/last-2000-years
Here is a Wikipedia list of more reconstructions. Feel free to point out the ones that show the MWP to be warmer than today …
https://en.wikipedia.org/wiki/List_of_large-scale_temperature_reconstructions_of_the_last_2,000_years
Would be amazing if the volcanoes in that area were not affecting surface temperature.. certainly enough to melt glaciers.
Note that it is DIRECTLY over the volcanic area.
Or are you saying its coming from the 0.08ºC ocean warming in the last 55 years??
Would love to see where the fabricated surface temperature measurements in your little map came from. 😉
Japanese temperatures since 1998, seb
https://s19.postimg.cc/s9bwikr0z/Japan_post_1998.png from
http://www.data.jma.go.jp/cpdinfo/temp/list/mon_jpn.html
Basically zero trend. get over it. !!
Sorry that you are INCAPABLE of basic observations about data, seb
Chart reading and comprehension has always been one of the MANY things you continually show a basic incompetence in.
Certain, those step changes have NOTHING to do with atmospheric CO2.
And why would anyone with a rational mind think that warming out of the COLDEST period in 10,000 years is anything unexpected, unusual, or catastrophic?
Those people scared of the slight warming since that COLDEST of times this interglacial, are just incredibly stupid.!!
You certainly always provide something for a good laugh … yeah, your chart reading skills are well known 😉
Step changes and stable climate everywhere and of course those changes are always natural.
Maybe you make the “basic observation” of looking at the 30 year mean of that JMA data.
Why would anyone with a rational mind use something like this as an argument? Is this some kind of last resort thing? When you can’t argue anymore that it’s not happening or that it’s not caused by human emissions then you try to relativize like this?
Hey, it was a lot warmer hundred of millions of years ago and with higher CO2 concentrations too. So no worries about the change that happens today, right?
What are the coldest times again? You weren’t precise last time … was it 1880? Or some date in the 1700s?
Besides, nobody is worried about the small warming that we have experienced today. This climate thing is about the warming that will happen in the future. Caused by what we already did and what we are continuing to do.
And what change would that be? The ocean’s temperatures have changed by an undetectable 0.1 C in the last 50 years, including just 0.02 C since 1994. Does that worry you? Exactly why should we be worried about warmth?
The Little Ice Age, which extended from about the 1300s to the early 1900s, as shown here:
https://notrickszone.com/wp-content/uploads/2018/03/Global-Temperatures-0-2000-AD-PAGES-2k-2015.jpg
I agree that 0.02 C of change since 1994 is negligible. But that’s why we’re wondering why you believe today’s warming is unusual or confirmed to be unnatural.
How far down the line will we go before the “worrying” warming begins?
Your twisted ignorance is shown in every post seb.
Where does your chief priest show as the end of the LIA, seb.
So you are worried about fantasy warming in the future..
.. based on a fantasy of CO2 warming
That truly is HILARIOUS !!!
Great to see you now DENYING the existence of the LIA,
ROFLMAO.
DENIAL is going full on with you nowadays, isn’t it seb-troll.
Come on, go the whole headless chook route…
DENY that you are TOTALLY INCAPABLE of producing any scientific evidence of CO2 warming.
Show us what you’ve got seb..
Q1. In what way has the climate changed in the last 40 years, that can be scientifically attributable to human CO2 ?
Q2. Do you have ANY EMPIRICAL EVIDENCE at all that humans have changed the global climate in ANYWAY WHATSOEVER?
“What are the coldest times again? You weren’t precise last time … was it 1880? Or some date in the 1700s?”
I knew seb was totally and wilfully IGNORANT about climate history.. but .. seriously ???
seb, you really have to get yourself a basic education.
You seem to have had very “bad luck” with your learning during the junior high period of your life.. !!
I’m curious how do you know that if the change was undetectable? Also I don’t know if you have replied to this elsewhere (the comment system is confusing here), but is my suspicion correct that you don’t understand what heat content is and thus have to express it as a temperature change of the whole ocean volume to make it look smaller in your mind?
You realize this kind of question is often seen as the third step of climate denial. If denying that it’s warming, denying that we are the reason that it’s warming doesn’t seem to get them anywhere their resort to attempt of trying to make the warming look like a good thing or something we don’t need to worry about.
Thanks for trying to reply for spike55 here, but I was specifically asking him since he presented a temperature graph starting in 1880 last time and referred to the start of that graph as the coldest time even though it showed cooler temperatures 10 years in. As his “interesting” replies demonstrate he still doesn’t seem to be sure.
The agreed about limit seems to be 2 to 3 degrees surface temperature increase. Whatever that is in heat content converted to complete ocean volume temperature that you seem to prefer.
Bova et al. (2016) found that changes in the temperature of the 0-1000 m ocean during the past 200 years are “below the detection limit”, and yet natural changes in 0-1000 m temperature reach >1 degree C per century.
https://agupubs.onlinelibrary.wiley.com/doi/abs/10.1002/2016GL071450
“We apply this technique at 1000 m water depth in the Eastern Equatorial Pacific during seven 200 year Holocene intervals. Variability in foraminifer δ18O over the past 200 years is below the detection limit, but δ18O signatures from two mid‐Holocene intervals indicate [natural] temperature swings >2°C within 200 years.”
No, your disgustingly patronizing suspicion is incorrect. I choose to use temperature — as most scientists do — because it is more relevant than the SkepticalScience blog-inspired preference of using Hiroshima bombs (“Our climate has accumulated 2,646,556,595 Hiroshima atomic bombs of heat since 1998”) and the like to describe deep ocean heat/temperature changes so that they appear as scary and alarming as possible. It’s rather like the propagandizing practice of describing a paltry 1 inch rise of sea level contributed by the Greenland Ice Sheet since 1900 as the equivalent of submerging the US highways in 98 feet of sea water 63 times over, as illustrated here:
https://notrickszone.com/wp-content/uploads/2017/08/9-Trillion-Tons-Greenland-Ice-Sheet-Loss-1-Inch.jpg
I couldn’t care any less than I do that you are not a fan of me pointing out that the ocean temperatures have only changed on net by 0.02 C since 1994, as you prefer that it not be expressed this way because it looks (and is) insignificant.
Exactly why should we be worried about warmth?
No, because I don’t know what “climate denial” is, as denying the climate is as absurd as believing the climate. Are you a climate believer, then? “Climate denial” is propagandist language…that you’ve been asked not to use, but continue to do so anyway.
“1880 last time and referred to the start of that graph as the coldest time even though it showed cooler temperatures 10 years in”
OMG you really are getting RIDICULOUS.
LIA refers to a few hundred years of the “COLDEST” period and you quibble about a small drop from 1880 until the end
WOW. !!!
You need something to get your brain working, seb, because it sure seems to be basically non-functional at the moment. !!!
Isn’t the world so fortunate for that warming out of the COLDEST period in 10,000 years.
Nowhere near the temperatures of the MWP and before, though.
STILL at a cold period in the interglacial.
“What are the coldest times again?”
Look up Little Ice Age, seb.
LEARN something for once.
Page2K and your AGW propagandist in charge (mickey mann) show it finishing around 1900 or there abouts.
.. and the world can be VERY THANKFUL for that slight warming of that COLDEST of periods.
That slight NATURAL temperature rise with the increase in atmospheric CO2 has allowed great prosperity in many parts of the world.
And here I thought you were a fan of exact wording … read the part you quote again.
And you think you aren’t doing the exact opposite extreme? “only 0.02 °C”? The scientific unit for heat content is Joules and since it not distributed uniformly over the entire volume of the oceans such a temperature is misleading and when used by you it only serves to belittle a rather large and fast change in heat content. And yes, it is fast … no matter how often you call it wrong to compare a 55 year stretch to a longer stretch from the past.
I know you don’t care … and that’s my entire point. You do this with one purpose only … trying to establish that it is insignificant. Possibly also imagining that there will be no further increase and what we see today is the end of the increase. Who knows.
And now he gets back to the “please use exact wording or I will twist everything you say around in front of you” mode … bravo. Want to talk about how greenhouse effect is the wrong name for the phenomenon? *sigh*
Spikey,
I know that and you seem to know that. That’s not the point. The point is that you used a graph that starts in 1880 and described it as the coldest period. You weren’t precise or didn’t know what you were doing, my lovely troll buddy.
And this reply shows me that you don’t understand what I’m writing. I am guessing this is so because you sit in front of your PC and don’t actually read what others write, you just skim it and construct your own reality of what was written … a straw man if you will. And that’s what you are replying to.
Yes, it is getting ridiculous. No, it has been ridiculous for a long time now. I shall force myself to withstand replying to you. Nothing good comes out of trying to converse with you. We’ll see.
OK, I read it again. It didn’t change since the very first time I read it.
“Variability in foraminifer δ18O [temperature proxy] over the past 200 years is below the detection limit, but δ18O signatures from two mid‐Holocene intervals indicate temperature swings >2°C within 200 years.”
No, it’s actually not fast at all. According to the IPCC, ocean heat (converted to temperature) change during 1971-2010 occurred at a rate of just 0.02°C per decade by 500 m. In contrast, natural warming rates during the Holocene reached >0.1°C per decade at the 1000 m depth (Bova et al., 2016), which is 5 times greater than modern changes at half that depth. In the 700 m layer, it’s just 0.015°C per decade. And, piling on, this 0.015°C per decade in the 700 m layer is comparing a much shorter-term trend (55 years) to a longer-term trend (200 years), meaning that directly comparing the two is probably not statistically copacetic.
“In the upper 75 m of the ocean, the global average warming trend has been 0.11 [0.09 to 0.13]°C per decade over this time [1971-2010]. That trend generally lessens from the surface to mid-depth, reducing to about 0.04°C per decade by 200 m, and to less than 0.02°C per decade by 500 m. … decreasing to about 0.015°C per decade by 700 m.” (IPCC, 2013)
To be precise, it’s comparing an 8,000-year trend to a 55-year anomaly (Rosenthal et al., 2013, 2017). Please explain why you don’t believe it’s inappropriate to compare those time spans to each other directly. I would surmise you think it’s OK as long as it says what you want it to say. So do you think it’s OK to compare a 2-year anomaly (an El Nino event) to a 40-year trend so as to draw conclusions how “fast” climate change is occurring because the 2-year anomaly changed more quickly?
Why is it your belief that it is not significant?
The scientists who reported the ocean heat change in the last 50 years wrote that it had only reached 0.1°C. If they thought it was significant (as you believe), why did they choose to use the minimizing word “only”?
@
Penelope “gets” what SebH is doing.
https://notrickszone.com/2018/07/09/why-are-we-doing-this-a-trove-of-new-research-documents-the-folly-of-renewable-energy-promotion/comment-page-1/#comment-1267884
“@ Kenneth, “Though tempting, responding to each and every one of your attempts would be a colossal waste of time.”
Precisely. And that’s why he’s here– to distract your thought and waste your time.”
“The point is that you used a graph that starts in 1880 and described it as the coldest period.”
I described it as warming FROM the coldest period, which was EXACTLY what the graph described.
Seems you are incapable of basic comprehension.
What does the Mann Hockey Stick show to be the coldest year, seb?
Looks like you are INCAPABLE of reading a graph, doesn’t it seb.
Or are you say mickey mann is wrong 😉
You are so egotistical that you didn’t see the trap laid for you, and did a massive faceplant, and now you keep rubbing your face into your own BS.
HILARIOUS. 🙂
How does a headless chook dig itself into such a deep and meaningless hole !!!
Q1. In what way has the climate changed in the last 40 years, that can be scientifically attributable to human CO2 ?
Q2. Do you have ANY EMPIRICAL EVIDENCE at all that humans have changed the global climate in ANYWAY WHATSOEVER?
cue more headless chook evasion and distraction from seb.
And? You didn’t notice the difference between “changes in the temperature of the 0-1000 m ocean during the past 200 years are “below the detection limit”” and “Variability in foraminifer δ18O [temperature proxy] over the past 200 years is below the detection limit”? Or you must have, since you added that “temperature proxy” phrase. Well … what about the other difference?
Apparently you also spotted the other difference. At 1000 m depth at one location and you compare that to a change of temperatures of a rather large global volume. Right …
Do you think you could even get a 55-year resolution out of that 8000-year data? What else would you compare? Short fluctuations in reconstructed data with large error bars to precise measurements from the satellite age?
Huh?
Kenneth, even though I am not a native English speaker I don’t think that the word “only” is used in a minimizing sense in the sentence you marked in that image: “Our precision is about 0.2 °C (0.4 °F) now , and the warming of the past 50 years is only about 0.1 °C”
I can’t find the full paper, but I think this is the one you a referring to, right?
https://www.nature.com/articles/nature25152
Does that mean you agree with what is written in the abstract then? Namely:
and
Which means that modern heat content uptake seems to be unprecedented in the last 12000 years.
Or was this another cherry picking thing because you really misunderstood the word “only” in this sentence?
In the paper, the modern change rates — which are below detection limits for the last 200 years — are not global ocean rates. They are the same specific locations used to compare changes during the Holocene to the changes during the past 200 years (apples to apples). We don’t have global ocean rate changes from the Holocene to compare to direct global ocean rate changes for the last 200 years, so therefore we have to compare regional locations to regional locations. When we do that, we see that modern changes are “below detection limits”, whereas past natural changes were >2 degrees C per 200 years, which explains why the title of the paper is “Rapid variations in deep ocean temperature detected in the Holocene”.
It would appear that the resolution was quite possibly a bit more narrowed than 8,000-year intervals when looking at graphs like this:
https://climateaudit.files.wordpress.com/2013/11/two_millennia_annotated.png
But are you suggesting that comparing an 8,000-year overall trend to a 55-year anomaly is statistically acceptable to establish that the 55-year changes were more rapid because the resolution isn’t as precise? Apparently you are.
Do you also believe that since comparing a 2-year anomaly to a 40-year trend will likely mean that the 2-year anomaly will have temperatures change much faster (when extrapolated to a per-decade rate) than the 40-year trend will, and therefore comparing a 2-year anomaly to a 40-year trend is statistically valid? Or do you understand why it’s not? Or, more likely, are you just accepting claims (modern changes are faster than any time in the last 10,000 years!) based on statistically invalid parameters (comparing a 55-year anomaly to an 8,000-year trend) when the claims affirm what you believe to be true? That appears to be what’s happening here.
I say that because you definitely have a problem with us pointing out that Arctic sea ice volume has stalled (or increased slightly) when we use a shorter time interval (2007-present) instead of looking at the overall 40-year trend. So when we compare a 10-year period to an 40-year period, you cry foul (because it doesn’t help your case). But when you compare a 55-year anomaly to a 8,000-year overall trend it’s quite acceptable to you because, in this case, the claims made (fastest temperature change in the last 10,000 years!) helps your case. Your inconsistency is lurid.
Uh, no. The paper says the opposite — the Younger Dryas warming was much faster and more pronounced than modern, “challenging the current understanding of global ocean temperature regulation” since the models are predicated on CO2 forcing which is at least 10 times greater for the modern period compared to back then.
“In experiments using state-of-the-art global climate models forced by anthropogenic greenhouse gas emissions, none of the 15 models (individually averaged over all realizations) reaches the warming rate of YD1 [Younger Dryas] averaged over 1971–2005 (35 yr). The mean rate over all models is about a third of the YD1 [Younger Dryas] warming rate, even though the greenhouse-gas radiative forcing is at least ten times stronger than during YD1.”
“In summary, this shows that the YD1 MOT [mean ocean temperature] warming is challenging the current understanding of global ocean temperature regulation and suggests that either current climate models generally underestimate the ability of the ocean to take up heat, or that climate conditions/drivers during the YD1 have been substantially different from the model experiments mentioned here in a way that allows much stronger heat uptake.”
Your not allowed to cherry-pick!
Only NASA/GISS/IPCC are allowed to do this.
Wow! JMA shows long-term Japanese warming of 1.19C/100 years. Count me unimpressed.
What do the non-compromised (no UHI or “adjustments”) stations report?
Choshi, Hanshu Temperature record (that’s temperatures, NOT “anomalies” – though I doubt the activists will remember why that is important)
https://www.john-daly.com/stations/choshi.gif
Now, contrast Osaka with Maizuru
https://www.john-daly.com/stations/osaka.gif
Looks like there might be a little UHI thing going on there in Osaka?
Tony Heller has a post on Japan’s temperatures, to which Kirye has contributed her comments.
https://realclimatescience.com/2018/08/japanese-stations/
SebH provides links to Japanese websites, in Japanese. I don’t read Japanese, and I think it’s a pretty safe bet that he doesn’t read it either. Hard to get useful info from a website in a language one can’t understand. Nuf said.
====================================
ASIDE – The ability of “mass extinctions” to remove the clutter is vastly overrated.
https://omicron.aeon.co/inlineimages/0175f023-7ef3-4374-a779-6747ee8f5147/show_Phanerozoic_Biodiversity.jpg
Yonason, your source quality is still lacking. Linking to known disinformers isn’t a good strategy when you want to convince me (since you are mentioning my abbreviated name) or anyone.
You are kidding me, right? So now it’s the language that discounts a source of data as a valid one. Or is it that you doubt that those pages are showing that I wrote they would?
Here is a machine translated version:
https://translate.google.com/translate?hl=en&sl=auto&tl=en&u=http%3A%2F%2Fwww.data.jma.go.jp%2Fcpdinfo%2Ftemp%2Fan_jpn.html
seb is devoid of useful information.
Insignificant warming in the last 2 decades.
https://s19.postimg.cc/s9bwikr0z/Japan_post_1998.png
ZERO warming from 1950-1990.
https://s19.postimg.cc/6kzq5cxdf/japan1950-1990.png
Come on seb, let’s see one of your comic explanations how CO2 causes ZERO-WARMING for two periods of total 60 years, and causes the step change between them.
Supported with scientific evidence, of course. (not just hallucinogenic fuelled fantasy.)
This should be HILARIOUS.. if he doesn’t just adopt his usual headless chook routine.. which is funny enough anyway
https://s19.postimg.cc/3wdirojxv/HC.jpg
@spike
The “known disinformers” here are Sebh and the warmist activists he cites to support his fake-science nonsense. The intelligent reader who compares his ranting to our references, and especially to those of Kenneth Richard, will realize how toxic his false assertions are.
@spike
FYI – Another of the troll’s favorite known disinformers is realclimate blog.
“”Real Climate” is a staged and contracted production, which wasn’t created by “scientists”, it was actually created by Environmental Media Services, a company which specializes in spreading environmental junk science on behalf of numerous clients who stand to financially benefit from scare tactics through environmental fear mongering.”
http://www.breadandbutterscience.com/Peden.pdf
(Peden is an atmospheric physicist, and signator of the no-consensus consensus.)
See also here.
https://www.middlebury.net/op-ed/global-warming-01.html
…and here…
http://antigreen.blogspot.com/2004/12/some-non-political-poseurs-there-is.html
Why not choose timespan that actually show cooling? The Japanese temperature graph contains such sections too.
Or how about stopping with that clown performance and stop trying to troll people with your nonsense, name calling, insults and whatnot?
“The intelligent reader” will notice what you are right away 😉 As for Kenneth, I hope intelligent readers will see the flaws in his line of arguments and that a list of quotes doesn’t solve anything when you appear to not understand the basics.
Seb YET AGAIN shows his abject inability to comprehend basic data and graphs.
DENIAL of actual data has always been you only way you can defend your pathetic brain-hosed mind from REALITY.
The intelligent reader will very quickly recognise that you are an EVIDENCE-FREE, ATTENTION-SEEKING NON-ENTITY, whose arguments are totally EMPTY and FLAWED at the most basic level.
They will see that you have ABSOLUTELY NO EVIDENCE to support anything you yap mindlessly about.
You can prove them wrong.. just answer two simple questions. (or continue with your manic headless-chook evasion and distraction slap-stick comedy routine).
Q1. In what way has the climate changed in the last 40 years, that can be scientifically attributable to human CO2 ?
Q2. Do you have ANY EMPIRICAL EVIDENCE at all that humans have changed the global climate in ANYWAY WHATSOEVER?
Will you ever get tired of this clown/troll performance? Do you really think it’s helpful to your cause? That “intelligent reader” will not quickly be turned down by your style of writing and arguing?
“Will you ever get tired of this clown/troll performance?”
I think we all agree that YOU need to stop your mindless evidence-free trolling, seb.
And yet again with the headless chook evasion of the questions.?? Really ??
SO HILARIOUS. 🙂 🙂
Do you really think your cowardice in facing two simple questions is helpful to whatever your petty cause is ?
What is your cause anyway, seb?
Whatever it is, you have set it back 2 centuries with your base-level incompetence.
NOBODY is buying it. !
I am not expecting you to buy anything. You are part of the local troll mob of this and other “skeptics” blogs. You can’t be convinced and only exist to deter people from posting critical comments on these blogs by quickly driving them away from your safe space.
NOBODY is buying your nonsense, seb
You are a known troll with ZERO EVIDENCE to back up even the most basic of AGW memes.
You have NEVER been able to put a rational case, because you don’t have one.
You ignore facts, and twist tiny changes into glacier melting farce.
Your level of comprehension of science is that of a low end junior high student.
Your purpose here is purely to distract from rational discussion, using LIES, DECEIT, MISINFORMATION and mindless bluster and ranting.
You KNOW that.
EVERYBODY knows that.
That is the soulless purpose of a TROLL.
So that EVERYONE can watch seb RUN AWAY or attempt another HILARIOUS headless chook distraction.
Let’s see if he can answer two basic questions that go to the very heart of the AGW SCAM.
Q1. In what way has the climate changed in the last 40 years, that can be scientifically attributable to human CO2 ?
Q2. Do you have ANY EMPIRICAL EVIDENCE at all that humans have changed the global climate in ANYWAY WHATSOEVER?
It absolutely BIZARRE to watch the lengths he will go to in his DEPERATION to avoid answering those two simple questions.
@spike
The troll can’t be bothered to look it up for himself, so here’s an answer to his question about whether the warming has increased in urban areas more than in rural.
“In the journal Nature Climate Change, the researchers, from Sussex University, Mexico and The Netherlands, wrote: “Between 1950 and 2015, 27 per cent of cities and 65 per cent of the urban population warmed more than the world average (about 0.6C).
“Moreover, during this period, about 60 per cent of the urban population experienced warming twice as large as the world.”
https://notalotofpeopleknowthat.wordpress.com/2017/05/30/richard-tol-on-uhi/
And, since urban sites are used to determine the warming n the first place, of course the world will appear to warm. It’s not that cities are causing the world to warm, it’s that the unethical or incompetent “scientists” are mishandling already compromised data in ways that give the impression that the world is warming a lot, when it may even be cooling. We don’t know, because the data is dreck.
…aside…
DATA TAMPERING IN PARAGUAY
https://notalotofpeopleknowthat.wordpress.com/2015/01/26/all-of-paraguays-temperature-record-has-been-tampered-with/
@spike55 17. August 2018 at 8:45 PM
SebH is a leftist activist, and as such he embraces their universally shared pathological aversion to truth.
http://jonjayray.tripod.com/psycho.html#1098
Like moths drawn to a flame, they will one day destroy themselves, hopefully taking few (preferably none) of us with them.
The machine translation is of no help, because…
1. The data are of temperature ANOMALIES, and as I’ve posted in the past, these are merely a distraction from the fact that with noise so high, no signal can be reliably determined.
https://www.youtube.com/watch?v=kwIixU1JyDU
I don’t need a translation to tell me the data is misleading and statistically meaningless.
2. The English rendition of the Japanese adds nothing, especially as it sheds no light on how the plotted values were obtained, or why I should trust them. But THIS does (scroll to bottom to see how the JMA applied their own version of ‘mike’s Nature trick’ to their data).
https://wattsupwiththat.com/2013/01/31/japans-cool-hand-luke-moment-for-surface-temperature/
If I knew Japanese, I could search in Japanese for more information, but since I don’t, I can’t. (It should be obvious I’m not going to learn any more from a website run by “scientists” who manipulate their data.) So I have to look for articles in English, which are few because the gatekeepers are predominantly warmists. Fortunately they can’t, at least yet, suppress all the information that helps us see through their obfuscation.
SebH’s contribution, as usual, adds nothing and is merely a distraction.
Thanks to Kirye for exposing the climate fraud in Japan.
OT, Elon Musk “takes” major funding from OIL county
https://wattsupwiththat.com/2018/08/15/hump-day-hilarity-elon-musk-caves-to-fossil-fuel-funding/
As always, Josh hits the spot ! 🙂
https://4k4oijnpiu3l4c3h-zippykid.netdna-ssl.com/wp-content/uploads/2018/08/musk-fossil-fuel-cash-josh-525×720.jpg
ELON MUSK, HYPOCRITE AT LARGE.
https://www.haaretz.com/us-news/elon-musk-fossil-fuel-critic-courts-saudi-oil-money-1.6384067
But wait! It’s all OK, because he wasn’t telling the truth.
https://www.bloomberg.com/news/articles/2018-08-10/musk-tweet-draws-tesla-investor-lawsuit-over-share-price-swings
…or something.
Yeah, go ahead and buy a Tesla. I DARE ya, …fool!
(Not you, spike55. I know you have more sense then that.)
I’ll stick to my plant food releasing V8 Commodore, thanks 😉
Nice. Wise choice.
[…] Read more at No Tricks Zone […]
TEMPERATURE DATA ADJUSTMENTS
Are they criminal malfeasance, or just gross incompetence?
https://climateaudit.org/2010/12/26/nasa-giss-adjusting-the-adjustments/
…or perhaps a bit of both?