Aerial photos show that the 15 temperature observation stations the JMA is using to determine mean temperature anomalies are likely impacted far more by urbanization than the agency claims.
By Kirye
and P. Gosselin
According to the Japanese Meteorological Agency (JMA) here, as of 2018, 15 observation stations are used to gather data to calculate surface temperature anomalies.
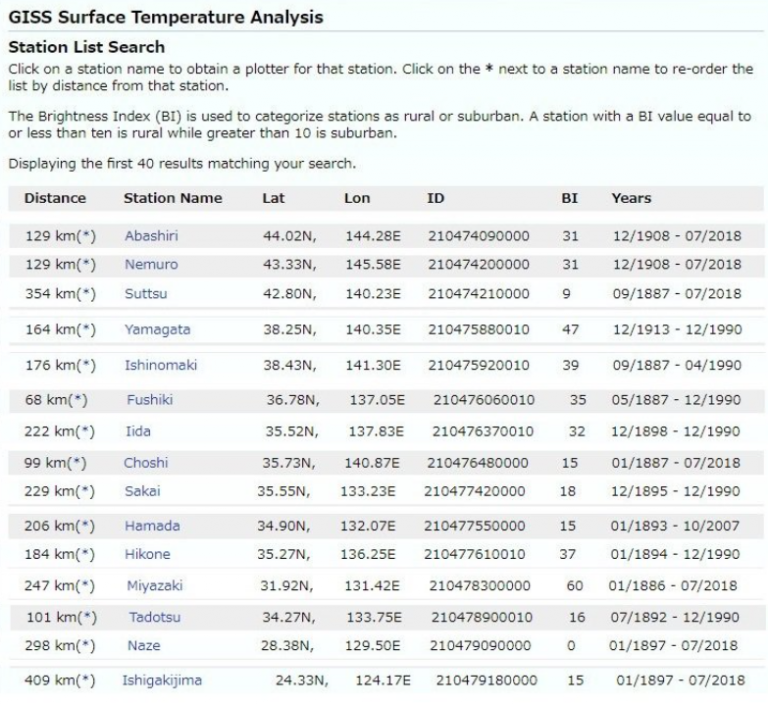
The 15 sites are Abashiri, Nemuro, Suttsu, Yamagata, Ishinomaki, Fushiki, Iida, Choshi, Sakai, Hamada, Hikone, Miyazaki, Tadotsu, Naze and Ishigakijima. Here’s a table of these stations from NASA:
NASA is using only 7 of these stations (marked). Many of these 15 stations used by the JMA have a high BI value, meaning they are heavily impacted by urbanization.
An earlier document issued by the JMA stated that the agency had used 17 stations, see Table 1.2.3. Today they are using 15.
JMA selection criteria: “relatively small” urbanization influence
The JMA says the criteria for selecting the 15 weather observation sites are: they have a long observation period and the influence of urbanization is “relatively small” and “not biased by a particular region”.
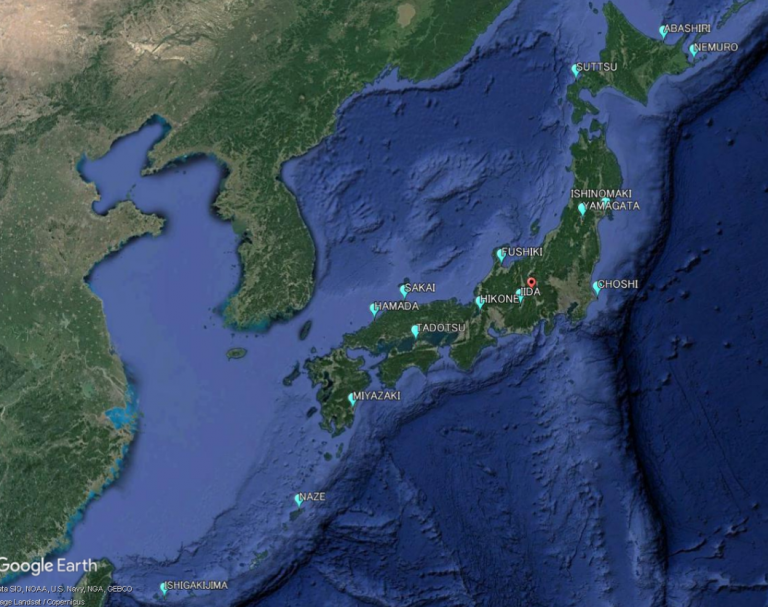
What follows is a location plot of the 15 JMA observation stations scattered across Japan:
How “relatively small” is the urbanization really?
To find out more about the siting quality of the stations, Kirye used Google Earth to locate the stations.
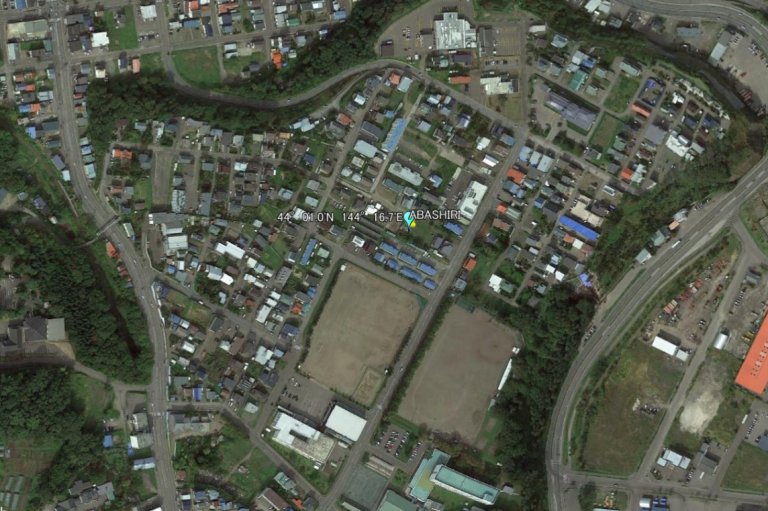
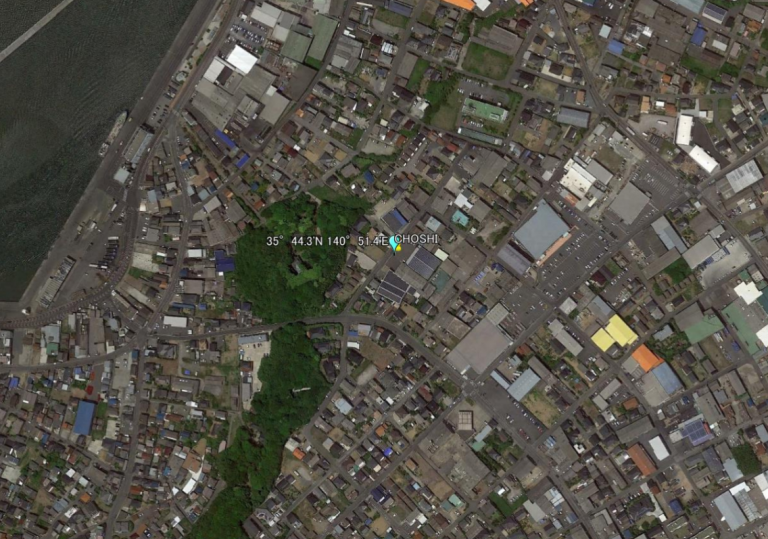
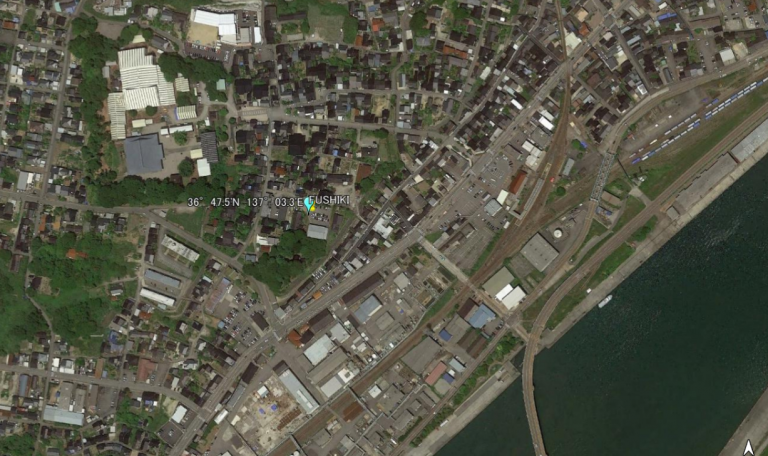
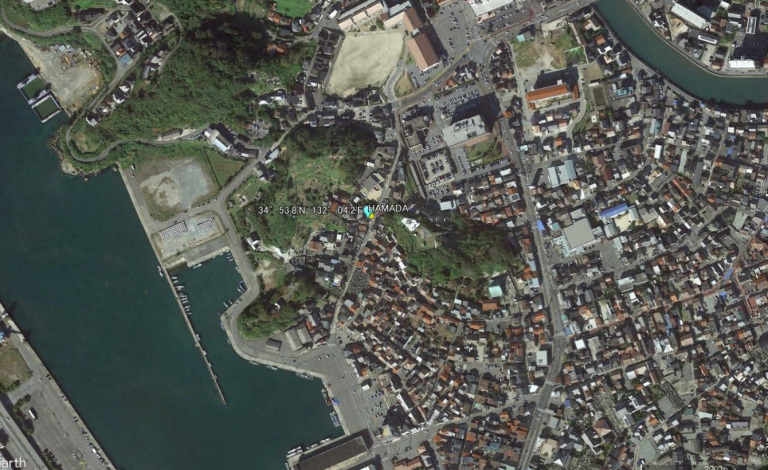
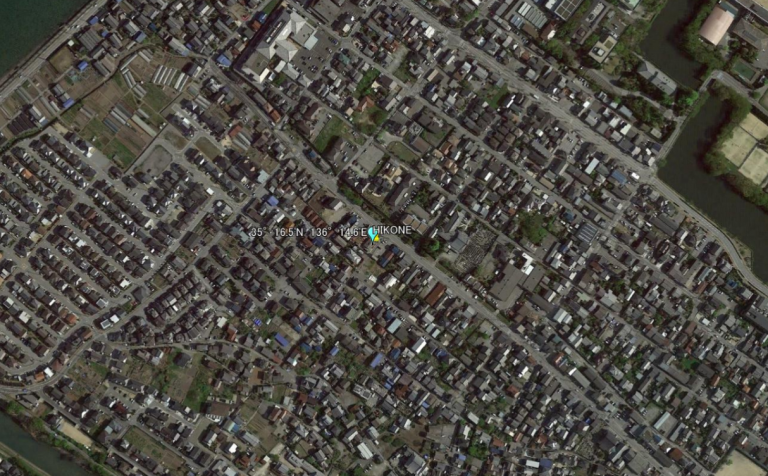
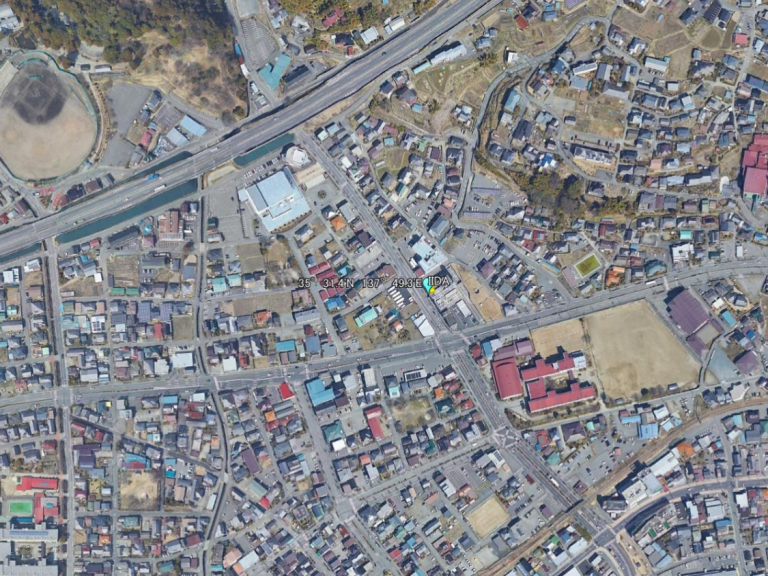
What follows are Google Earth photos of their location. You will see that the JMA’s description “relative small” influence of urbanization is quite an understatement.
It’s urban warming, and not global warming!
Many stations are in fact dubiously surrounded by massively heat-absorbing structures. Keep in mind the pinpoint location shown could be off by some meters.
Abashiri is in the middle of buildings and streets.
Choshi is also found in a densely built up area, which would tend to really heat up in the summer.
Fushiki observation station is somewhat better sited, with more green vegetation in the area, yet much temperature distorting paved surfaces are nearby.
Hamada station is also becoming increasingly choked off by urbanization.
Hikone is right in the middle asphalt and buildings. We can only wonder how much all the air conditioners around are heating up temperature readings in the summertime? This is urban warming, and not global warming!
Iida station. Wow! Hardly any green vegetation in sight, so the area must really heat up in the summertime sun, and keep things warm late into the evenings.
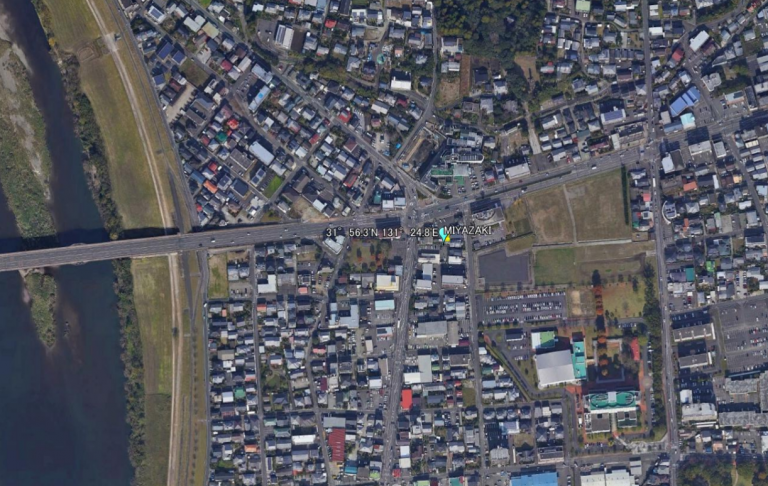
Miyazaki station. Japan loves concrete and asphalt. So little room for vegetation. Expect the green fields to go in the years ahead.
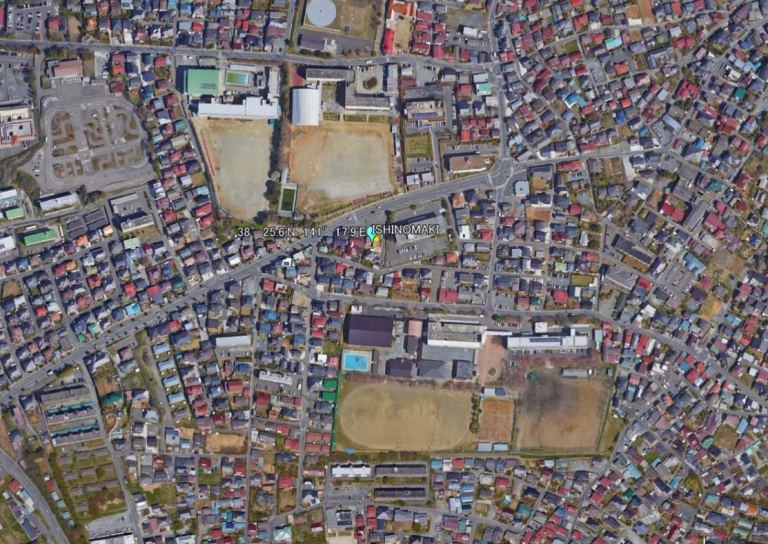
Ishinomaki station. Everywhere heat-absorbing buildings and asphalt streets that boost the readings.
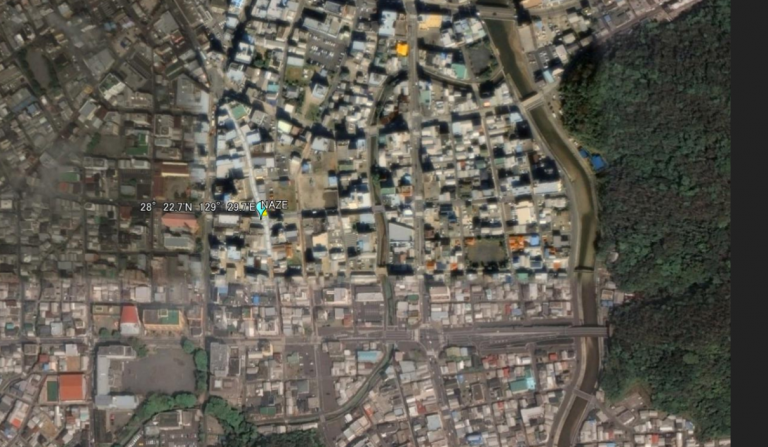
Naze. NASA assigns it a BI of 0, meaning as rural as could be. Maybe the reason for this is because Naze is on an island in the middle of the ocean. But here we see the station is in the middle of a city.
Nemuro station is also surrounded by buildings, concrete, steel and asphalt. Perhaps the Google Earth marker is not so exact and so the station is in the field to the right. Still, lots buildings and hot asphalt around.
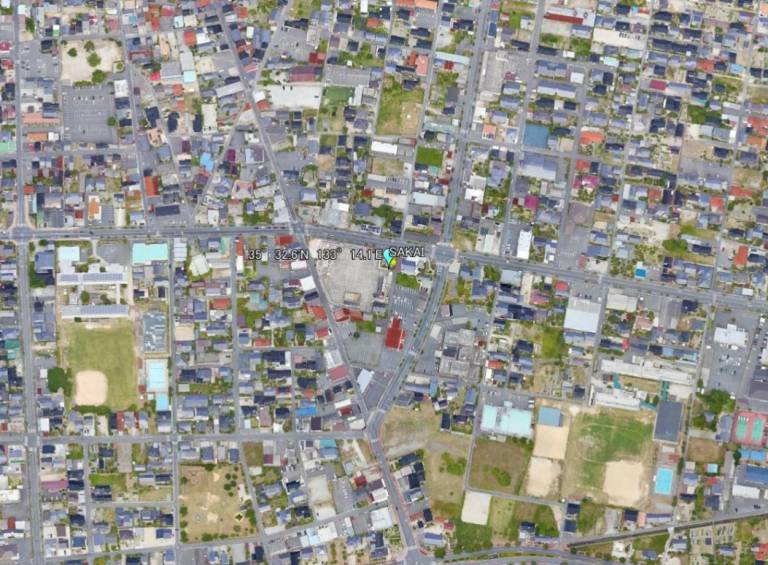
Sakai station has some green areas around it, but still great urban influences at work.
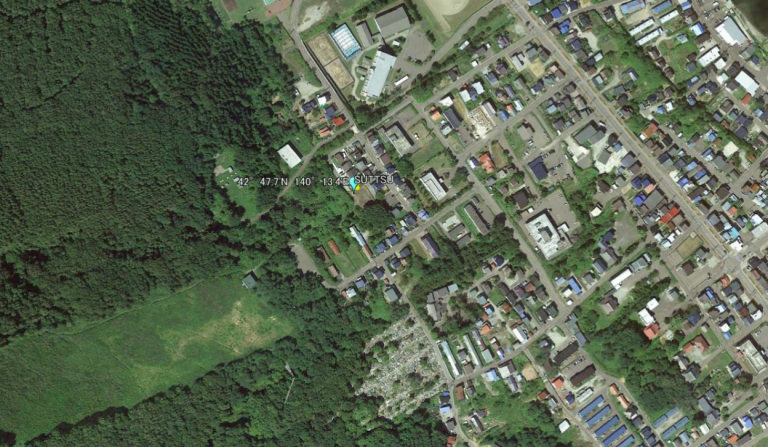
Suttsu, only the second station considered by NASA to be “rural” is so only on one side! If the wind blows from the forest to the west, then the readings will be more accurate.
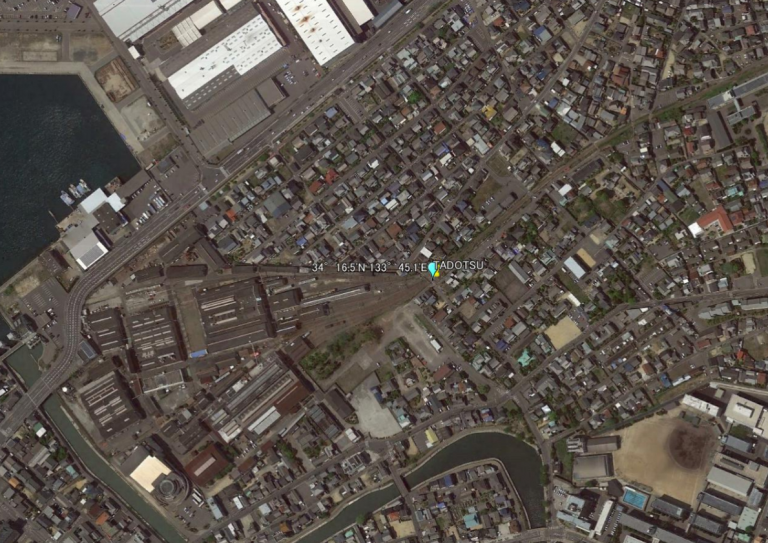
Tadotsu is a terribly sited stations, due to obvious reasons. The whole place is a giant heat sink!
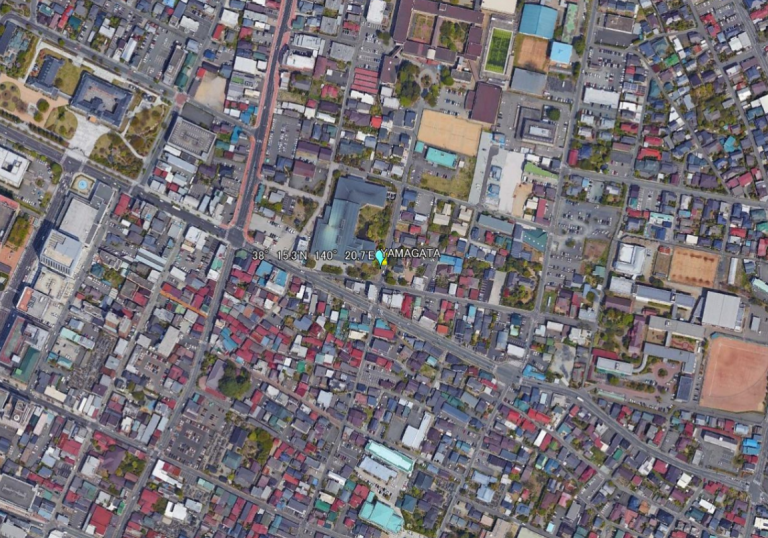
Yamagata, the last of the 15 stations JMA uses, is also completely surrounded by heat absorbing asphalt, concrete, steel and buildings.
What can we conclude?
Little wonder that global temps shot up just after 1990 when NASA stopped using so many stations worldwide, and seemed to focus more on those sited in urban environments.
Arguably the JMA’s claim of a “relatively small” influence from urbanization is an understatement of multiple degrees.



So you are suggesting that those structures around weather stations are causing continued warming? Have those location really grown that much and added so many structures in recent decades? Or could the UHI effect around such stations be really are constant and doesn’t matter when you look at anomalies?
Or is this another of those instances where you claim that it’s all fake anyway and a conspiracy is going on that artificially increases measured temperatures?
Poor seb, INCAPABLE of comprehending the fact that if you take non-warming cooler, rural and isolated sites out of the mix, you are left with warmer temperatures.
I know your maths and common sense are only at basic junior high level, seb, but at least TRY to think. !!
Anyway, even with all that urban heat effect…
https://s19.postimg.cc/s9bwikr0z/Japan_post_1998.png
You’ve answered your own question, seb, except you’re either too dim or too blinkered to realise it.
There was a major reduction in the number of sites around 1990. That is a matter of record. The majority of those “closed” were rural or at altitude.That also is a matter of record.
Hence:
“Little wonder that global temps shot up just after 1990 when NASA stopped using so many station worldwide, and seemed to focus more on those sited in urban environments.”
Which is simply commonsense. If you stop using sites with no UHI effect and continue using sites with a UHI effect you will get temperature increases in your records — though not necessarily in the real world. I would expect a seven-year-old to understand that.
Yep.
“Approximately 66% of global surface temperature data consists of estimated values” – John Goetz
https://wattsupwiththat.com/2015/09/24/summary-of-ghcn-adjustment-model-effects-on-temperature-data/
https://notrickszone.com/wp-content/uploads/2017/02/NOAA-Data-Manipulation-Station-Removal-Small.jpg
https://notrickszone.com/2017/02/13/more-data-manipulation-by-noaa-nasa-hadcrut-cooling-the-past-warming-the-present/
Global Temperature Data Manipulation
Thousands Of Non-Urban Thermometers Removed
0.3°C Of Pause-Busting Warmth Added Since 1998
0.5°C Of Warming Removed From 1880-1950 Trend
RE – STATION REMOVAL vs AVG TEMPERATURE
A picture is worth a thousand words.
“Which is simply commonsense”
Which is why seb is TOTALLY LOST !!
No Sense.. common or otherwise.
Headless chooks are like that.
SebH you cannot be serious, surely ?
Mathew et al., 2018
https://www.annualreviews.org/doi/abs/10.1146/annurev-marine-121916-063102
“Urbanization induced surface and atmospheric modifications lead to a modified thermal environment that is warmer than the neighboring rural areas, particularly at night. This phenomenon is referred as urban heat island (UHI). … Urbanization is one of the primary driving factors of land cover (LC) changes and subsequently increase of LST [land surface temperature] [Pal and Ziaul, 2016]. … Tan and Li [2015] have observed that daytime UHI intensity is higher than the night time UHI intensity, especially for big cities. For cities with an area >100 km2 , the mean daytime UHI intensity (2.90 K) has been observed to be higher than the night time UHI intensity (2.30 K). On the basis of analysis of a large number of clusters, it has been concluded that daytime UHI intensity is more significant than night time UHI intensity for clusters with an area >2 km2 . Lokoshchenko [2014] has studied the UHI intensity of Moscow from long term temperature records and has observed a mean UHI intensity of 1.0–1.2 K at the end of the 19th century, 1.2–1.4 K during first two decades of the 20th century and 1.6–1.8 K during both the middle and at the end of the 20th century.”
“1.6–1.8 K during both the middle and at the end of the 20th century.”
So no change over half a century? Why do think recent warming comes from this effect then?
“1.6–1.8 K during both the middle and at the end of the 20th century.”
Yet another example of purposeful misrepresentation, or intellectual dishonesty. SebastianH decided to rip the above quote out of its larger context:
“Lokoshchenko [2014] has studied the UHI intensity of Moscow from long term temperature records and has observed a mean UHI intensity of 1.0–1.2 K at the end of the 19th century, 1.2–1.4 K during first two decades of the 20th century and 1.6–1.8 K during both the middle and at the end of the 20th century.”
So the UHI effect added about 0.6 K of artificial (non-climatic) temperature increase in the 100 years for the increasingly urbanizing city of Moscow between the end of the 19th century and the end of the 20th century according to the full quote. SebastianH, seizing on the opportunity to misrepresent this, decides to ignore the 0.6 K of artificial heat increase to say there was “no change” for half a century — even though he knows that the full quote implies there was a 0.6 K change attributed to Moscow’s urbanization for the full century. It can’t get any more disingenuous than this.
Or maybe it can. It’s SebastianH, after all.
For your information, SebastianH, instrumental records reveal that Western Russian did not warm (actually cooled slightly) between 1880 and 2009. So there was no overall warming in Western Russia anyway. Moscow warmed, yes, but as the above paper indicates, it warmed due to urbanization.
Dole et al., 2011
https://agupubs.onlinelibrary.wiley.com/doi/full/10.1029/2010GL046582
“…no significant warming trend over the prior 130‐year period from 1880 to 2009. A linear trend calculation yields a total temperature change over the 130 years of −0.1°C (with a range of 0 to −0.4°C over the four data sets).”
“…no significant long‐term trend in western Russia July surface temperatures detected over the period 1880–2009.”
“In summary, the analysis of the observed 1880–2009 time series shows that no statistically significant long‐term change is detected in either the mean or variability of western Russia July temperatures, implying that for this region an anthropogenic climate change signal has yet to emerge above the natural background variability.”
Guys, this is ridiculous. I know there is a language barrier between us, but I don’t see how you get the impression of needing to explain the UHI effect to me.
My question was if Pierre/Kyle think that the effect increased over time at those locations … e.g. if it is relevant for anomalies at all. And secondly, do you guys think this is not controlled for?
Yep, Its VERY clear that seb has a COMPLETE LACK OF COMPREHENSION.
Its NOT a language barrier, its that he is INCAPABLE of rational thought.
Its almost like he was DELIBERATELY TRYING NOT TO UNDERSTAND.
Only a rabid TROLL would do that.
In what way have you demonstrated that you understand it, SebastianH, especially when you write things like this:
Air conditioners and heaters are machines. They generate artificial (non-climatic) waste heat. So when a thermometer is frequently sited near these machines, as the first 10 photos of this paper demonstrate, they record temperatures that are unrelated to climatic heat — which is what the thermometers are supposed to be recording.
This should not be new information for you, SebastianH. But, obviously, it is.
https://www.nasa.gov/topics/earth/features/heat-island-sprawl.html
“Summer land surface temperature of cities in the Northeast were an average of 7 °C to 9 °C (13°F to 16 °F) warmer than surrounding rural areas over a three year period, the new research shows. … Ramped up air conditioning usage may have even exacerbated the problem, other data presented at the meeting suggests. Cecile de Munck, of the French Centre for Meteorological Research of Meteo-France, conducted a series of modeling experiments that show excess heat expelled onto the streets because of increased air conditioner usage during heat waves can elevate outside street temperatures significantly.”
[…] by Kirye and P. Gosselin, August 17, 2018 in NoTricksZone/JapanMeteorologicalAgency […]
Compare the average temperature by month for pre-1980 to post-1980. If it is warming more in the winter, it is urban warming by home-heating. If it is warming more in the summer, it’s air conditioning. If there are two peaks, it’s both.
Hi Ed! Further analyses would certainly turn up interesting results, I’m sure.
Ed, I don’t think the UHI effect has to do with heating and air conditioning 🙂
It’s a heat capacity thing. Concrete and asphalt have a higher capacity than rural surfaces …
I am sure people weren’t living in the cold in pre 1980 winters … at least not in Japan.
Seb, it is IRRELEVENT what you think !!
You are incapable of rational though.
You don’t think air-cons heat the air in urban areas in winter… really !!
You don’t think volcanoes can melt ice, but a sea temp change of 0.08C can.
You truly live in some sort of WEIRD, TWISTED, FANTASY world where REALITY can never enter.
“You don’t think air-cons heat the air in urban areas in winter… really !! ”
Oops, I meant, “in summer”.
Has anyone ever stood near a reverse cycle air-con outlet in summer, noticed it is rather WARM !!
UCHIMIZU 打ち水
The Japanese people have known about the negative effects of urbanization for a long time, and are realizing that now, more than ever, it is important to deal with it.
https://resources.realestate.co.jp/living/urban-heat-island-effect-why-its-so-hot-in-tokyo-whats-being-done-about-it/
Throwing one’s bath water out onto the street isn’t going to solve the problem, but at least the recognize that it exists.
Here’s some general info on the UHI phenomenon.
http://www.c3headlines.com/global-warming-urban-heat-island-bias/
Using poorly located temperature detection devices embedded in cities, and then applying biased temperature adjustments, is not a scientifically valid method for determining overall temperature fluctuations. And yet, that is how it’s done.
If only there were temperature indexes that use more stations … right?
As for the difference between rural and urban temperatures. This author analyzed it for the US:
http://residualanalysis.blogspot.com/2010/03/us-rural-vs-urban-temperature-stations.html?m=1
A FAR better, totally unbiased, analysis is available by Tony Heller. You really should pay more attention, seb.
“GHCN Processor informs us that it processed 867 rural stations, and 117 urban stations.”
ROFLMAO.. do you REALLY believe that to be the case, seb
You are TRULY GULLIBLE.
Many of those so-called “rural stations will be at airports.
Many of those so-called rural stations will be in areas that have change radically, with tin sheds, tar roads, you name it.
It seems the guy running the “blog” you linked to DOESN’T HAVE A CLUE. A mate of yours, we assume.
Yeah right … you are completely lost, aren’t you? Stay with you idols, believe whatever you want. I don’t care 😉
UHI DETECTED IN ATARCTICA
https://kenskingdom.wordpress.com/2010/05/12/the-australian-temperature-record-part-1-queensland/
UHI IN GREENLAND
https://www.citylab.com/environment/2013/05/greenland-urban-heat-island-growing-fast/5677/
DATA TAMPERING IN AUSTRALIA
https://kenskingdom.wordpress.com/2010/05/12/the-australian-temperature-record-part-1-queensland/
And here we have yet more proof that RealClimate are KNOWN DISINFORMERS
https://climateaudit.org/2009/01/20/realclimate-and-disinformation-on-uhi/