Four climate scientists assert (1) the last ~130 years of temperature changes fit “perfectly” into statistical indices of natural variation, and (2) a long-term deep cooling of the Earth system has recently commenced.
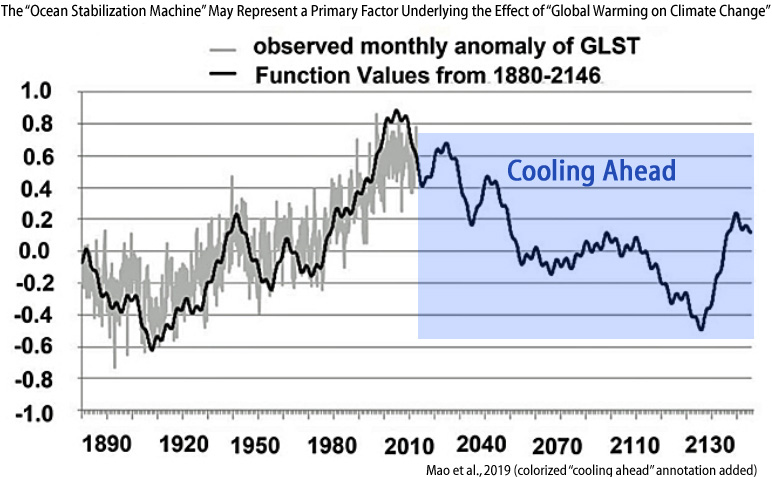
Image Source: Mao et al., 2019
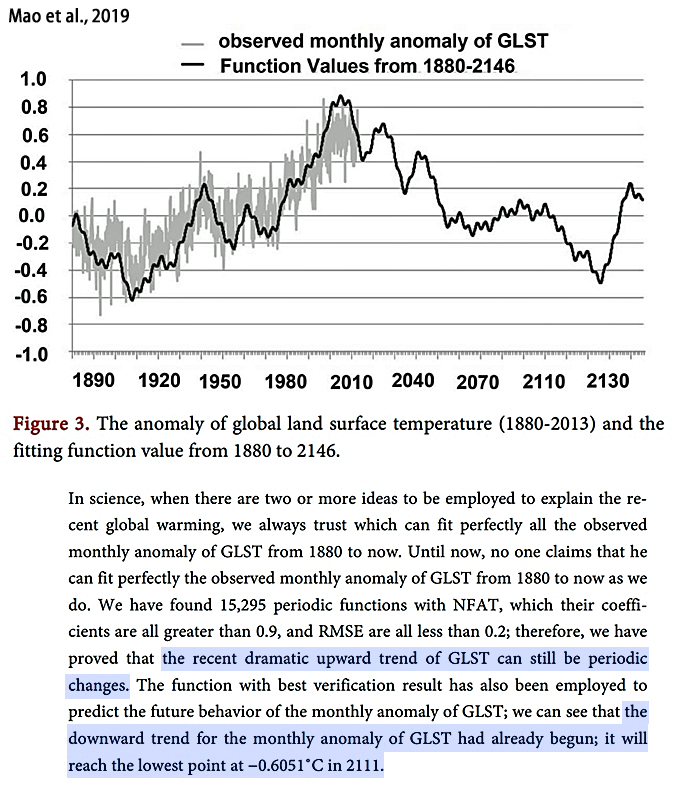
An analysis published in the journal Atmospheric and Climate Sciences by 4 climate scientists reveals the 1880-2013 temperature changes fit “perfectly” (0.9 correlation) into a calculation utilizing 15,295 periodic functions of natural variation.
The authors claim this affirms that the non-anthropogenic “major climate factors” (i.e., solar-cloud and ENSO forcing) can still be considered the “main reason” driving modern warming (Lakshmi and Tiari, 2015; Hassan et al., 2016; McLean, 2014; Yeo and Kim, 2015; Wielicki et al., 2002; Douglass and Knox, 2014; Sejrup et al., 2010; Large and Yeager, 2012; Irvine, 2015; Cess and Udelhofen, 2003; Clark, 2010; Ogurtsov et al., 2017; Fleming, 2018; Zherebtsov et al., 2019).
Mao, Tan, Chen, and Fan (2019) effectively suggest we humans do not exert fundamental control over the Earth’s climate-modulating “Ocean Stabilization Machine”.
Consequently, their statistical analysis further indicates a global cooling trend has recently begun, and the overall decline in global temperature will precisely reach −0.6051˚C below the long-term average in the year 2111.
Mao et al., 2019
The “Ocean Stabilization Machine” May
Represent a Primary Factor Underlying the
Effect of “Global Warming on Climate Change”
• “Contemporary references to global warming pertain to the dramatic increase in monthly global land surface temperature (GLST) anomalies since 1976. In this paper, we argue that recent global warming is primarily a result of natural causes.”
• “Global climate changes are controlled by major periodic [natural] factors that represent basic principles in climatology, such as solar radiation, atmospheric circulation and oceans.”
• “A number of scientists subjectively consider that the recent dramatic upward trends in monthly GLST anomalies represent non-periodic and irreversible changes and postulate that warming related to the global greenhouse effect has primarily been caused by anthropogenic emissions. However, with the decline of global warming, an increasing number of scientists have started to question this view [Chen and Tung, 2014; Easterling and Wehner, 2009; Fyfe et al., 2013; Meehl et al., 2011; Risbey et al., 2014; Curry and Webster, 2011; Loehle, 2007; Lindzen, 2007; Holland, 2013; Seneviratne et al., 2014; Kosaka and Xie, 2014; England et al., 2014].”
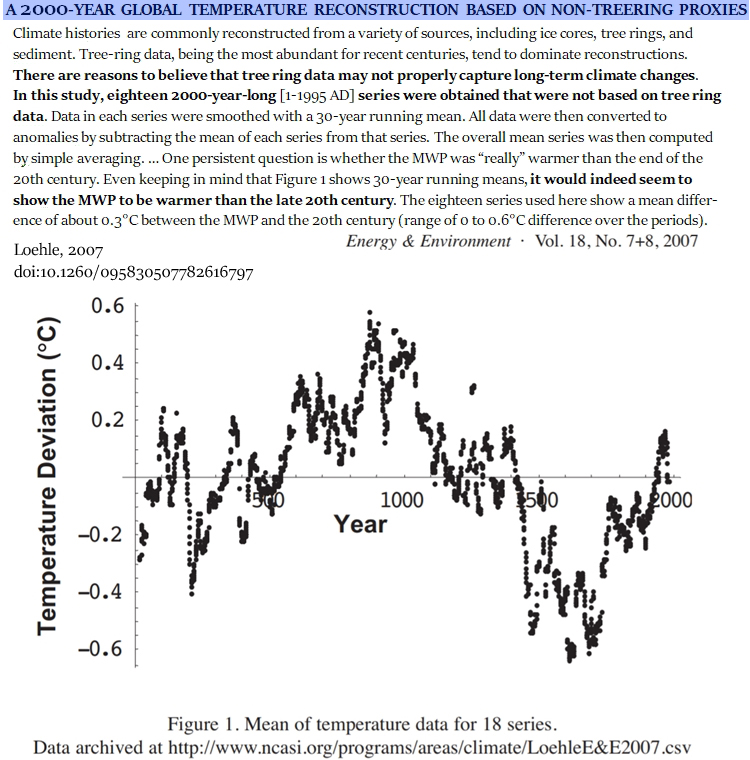
Image Source: Loehle, 2007
• “There are two primary methods challenging the hypothesis that recent global warming is caused by anthropogenic emissions: the first method is to prove that the recent dramatic upward trend of monthly GLST anomalies is periodic, and the second method is to link global warming to major factors in nature.”
• “In this paper, we have found that the dramatic upward rising signals can be perfectly fitted with periodic functions, which suggests that the major climate factors can still be the main reason for the recent global climate warming, and the secondary climate factor such as anthropogenic emissions might be the secondary reason. … We have identified 15,295 periodic functions that perfectly fit the monthly GLST anomalies from 1880 to 2013 and show that the monthly SST anomalies in six domains in different oceans are highly correlated [0.9 coefficient] with the monthly GLST anomalies.”
• “If we use the best function to predict the future behaviour of GLST, we can know that the downward trend for the monthly anomaly of GLST had already begun, and it will reach −0.6051˚C in 2111.”
• “The correlation study tells us that the dramatic anomalies can be seen in SST fields of different oceans, which might be the results of OSM [“Ocean Stabilization Machine”], and with the k-line diagram technique, we can see that most of the annual dramatically increasing GLST anomalies occur in El Niño years; and most of the annual dramatically decreasing GLST anomalies occur in La Niña years. These findings show us how OSM works. In a word, although there are many academic topics need to study further in future, we can still make a conclusion: “OSM” might play a very important role to cause global climate changes.”


Very interesting
You may well find this interesting, but for me it is simply a (mis)application of Fourier’s theorem. This states that any “well behaved” function, (a technical term), can be reconstructed from a linear combination of sine waves of appropriate amplitude, phase and frequency/wavelength. Given that there are three degrees of freedom for each sine wave and the large number of sine waves used, it is amazing that the authors only managed to achieve a correlation coefficient of 0.9. Statistically, this paper is of very little significance whatever.
yes, as John von Neumann said, “With four parameters I can fit an elephant, and with five I can make him wiggle his trunk”. Finding 15000+ waves looks like curve fitting.
They did not randomly picked the sine waves. It was extracted from past records. What is significant is that they demonstrated clearly the periodicity of our climate.
−0.6051 C degree
” precisely reach −0.6051˚C below the long-term average in the year 2111. ”
I began learning science with pencil and paper, then moved on to a log-log slide rule. The above number would have never been calculated, and even so, should be reported as -0.6. The tag line should be that it will be indistinguishable from Zero.
As for the year 2111 and “the long term average” — This is nuts!
In general, this may be the way things will go, but the numbers are inappropriate.
@ John – [+1]
@ Kenneth – nice compilation. Do the authors suggest that the atmospheric temperature anomalies in each basin lag the sea surface temperatures? If so, by how much?
True but climate “scientists” break all the rules for reporting their temperature anomalies also.
They regularly arrive at results “accurate” to hundredths of a °C from a data set which would likely have significantly less than half a °C accuracy.
Can you give me an example?
In the period 1880-1909 sea surface temperatures rose whereas land surface temperatures fell. I do not see how any theory based on ocean oscillations can possibly account for this on its own.
Ocean oscillations may play some role, but they are clearly not the whole story.
Not sure what data set you’re using. As of the early 1990s, it was still widely accepted that the land + sea global surface temperature rose by +0.5°C between 1880 and 1950. Not only that, but there was a +0.15°C warming between 1880 and 1910. Both trends are manifest in the NASA GISS graph (1987) here:
https://notrickszone.com/wp-content/uploads/2018/03/NASA-GISS-Global-Temperatures-1987.jpg
By 2018, NASA GISS decided to remove all of the +0.5°C warming between 1880 and 1950. It’s 0.0°C today. And instead of warming by +0.15°C, the 1880 to 1910 trend today shows -0.4°C cooling between those two years.
https://notrickszone.com/wp-content/uploads/2018/03/NASA-GISS-Global-Temperatures-2018-Trend.jpg
Considering we’ve had no new over-a-century-old temperature records entered into the NASA GISS data set since the 1990s, and yet we have had over a half a degree of warming removed from the early 20th century, why do you have confidence that what you now “know” about sea surface vs. land surface temperatures are accurate? Why no skepticism?
You’ve previously expressed no doubts that the current instrumental temperature data sets are accurate or at least “un-fiddled” with. (i.e., Skeptik: “The idea that scientists would deliberately fiddle their results strikes me as ridiculous.”) How then, Skeptik, can you explain such widely divergent temperature trends from the pre-1950s era, removing half a degree of warming from a data set that has no new data? I’ve asked you this question (and several others) many times now, and each time you refuse to answer. Why?
You have previously expressed the belief that CO2 variations have a modulating effect on water temperatures. As I recall, you’ve claimed that almost half of the warming in the last few decades is due to CO2 increases. You further claim this belief is rooted in the “established physics“. Also, you claim the greenhouse theory that says greenhouse gases warm and cool the oceans when increased or decreased has “no flaws” in it.
Given these past statements, I’m curious if you have any quantified real-world measurements that support this belief you have that almost half of the warming in recent decades has been caused by CO2 increases. How much warming occurs in a water body when the CO2 concentration above it is increased by say, 10 ppm (0.00001)? Again, real-world physical measurements. Do you have anything to support your belief?
Again, I’ve asked you this question many times. Each time you have failed to respond directly to it other than to once say that water (i.e., 71% of the Earth’s surface) is not a good way to “test” the GHG theory. And if we don’t have measurements of CO2 changes to water surfaces (and subsurfaces), why, as a self-described skeptic, do you nonetheless go ahead and unquestionably believe that CO2 changes heat and cool the oceans anyway? Why not more skepticism…or even curiosity?
The classic Kenneth defense … demanding results for an impossible experiment or he won’t believe what over a century of research has shown to be true 😉
Hey, have you made the measurement of gravity on a custom 1m³ cube of tungsten orbiting Proxima Centauri? Unless you can’t present that measurement I will be very skeptic about gravity behaving the same everywhere. See the problem?
At what point was CO2-driven OHC changes “shown to be true” scientifically? Or are you just referring to “the consensus” again?
A lecture by Michael Crichton
“In past centuries, the greatest killer of women was fever following childbirth . One woman in six died of this fever. In 1795, Alexander Gordon of Aberdeen suggested that the fevers were infectious processes, and he was able to cure them. The consensus said no. In 1843, Oliver Wendell Holmes claimed puerperal fever was contagious, and presented compellng evidence. The consensus said no. In 1849, Semmelweiss demonstrated that sanitary techniques virtually eliminated puerperal fever in hospitals under his management. The consensus said he was a Jew, ignored him, and dismissed him from his post. There was in fact no agreement on puerperal fever until the start of the twentieth century. Thus the consensus took one hundred and twenty five years to arrive at the right conclusion despite the efforts of the prominent “skeptics” around the world, skeptics who were demeaned and ignored. And despite the constant ongoing deaths of women.”
“Probably every schoolchild notices that South America and Africa seem to fit together rather snugly, and Alfred Wegener proposed, in 1912, that the continents had in fact drifted apart. The consensus sneered at continental drift for fifty years. The theory was most vigorously denied by the great names of geology-until 1961, when it began to seem as if the sea floors were spreading. The result: it took the consensus fifty years to acknowledge what any schoolchild sees. And shall we go on? The examples can be multiplied endlessly.”
“Jenner and smallpox, Pasteur and germ theory. Saccharine, margarine, repressed memory, fiber and colon cancer, hormone replacement therapy……the list of consensus errors goes on and on.”
Ummm, that is a very basic concept in physics. What leads you to believe that “magic” (e.g. something unknown) is happening somewhere [snip – no one has ever written that “magic” is happening here]
You must have some kind of theory, right? Or are you just skeptical because this mechanism doesn’t fit in your worldview?
Your consensus quotes are kind of funny. So you believe you “true skeptics” are moving science forward by going against the consensus? You guys think of yourselves as being Galileo or similar?
At what point was CO2-driven OHC changes “shown to be true” scientifically?
Ummm, we’re not talking about a “concept” here. We’re talking about empirical observations, physical measurements. When we say “shown to be true” scientifically, we are not talking about theoretical or hypothetical or assumptive expectations of what might may maybe probably possibly perhaps be the effect of some causal variable.
Your straw man arguments and attempts to make up wording I never use and dishonestly attribute those words to me are despicable.
No, those who believe/presuppose humans exert fundamental control over the melting of ice sheets, sea level rise, intensities of droughts and floods, heat waves, wind currents, ocean temperatures, species extinctions, axial tilt…just by emitting more or less CO2 are holding scientific advancement back by declaring the science is settled on this point and shutting down debate or legitimate challenges due to a tendentious confirmation bias and reliance on the if-we-agree-then-we’re-right groupthink.
You are clearly expecting that there is something yet unknown happening somewhere along the mechanism. So you must be thinking the laws of physics can not fully describe such a process or that we are not able to measure an essential part of the process. Is that correct?
So, are you or are you not believing that there is something unknown happening in the radiative heat transfer between water and an atmosphere with GHGs? Your argument seems to be that because we can’t conduct your impossible experiment, that there must be or could be something unknown, right?
You must have a theory about what that could be, do you? Otherwise this is just some “what if” skepticism and could as well be “what if aliens (or magic) is not allowing normal physics to play out”. I hope you understand this point. It’s not about words that you actually used. I wish you were that pedantic when interpreting science papers …
The “concept” says that reducing CO2 concentrations over a body of water causes that body of water to cool down – and vice versa.
The question: OK, by how much (physical measurements) does the body of water cool down when the CO2 concentration above it is reduced? Is this known or unknown? If the CO2 concentration above a water body is reduced by 10 ppm, does the water cool down by -0.000000001 K? -0.0001 K? -0.000000000000001 K? What is the answer, SebastianH? What do “the laws of physics” tell us that is known? Support your answer with citations.
No, pointing out that we don’t know how much CO2 influences the heat content when reduced or increased over water bodies is not just a hand-waving exercise. It’s fundamental. Your characterization of this How much? question as being in the same category as magic and aliens is a testament to how un-skeptical you are. You don’t even see it as a problem that we don’t have quantified evidence of the human influence. It’s enough for you just to say well, the laws of physics say the OHC will rise when CO2 is increased. You don’t need to know how much influence we wield to leap to the belief that 100% of OHC changes are human caused. That’s not skeptical, or even curious. It’s I’m-a-believer stuff.
1) If I were pedantic with words I would correct you here and add that this is true for all other variables stay the same
2) It is know by how much if all variables stay the same. The effect GHGs have can be observed in laboratory settings and has been first observed over a century ago.
You want to know what happens in the actual Earth system. Since we can not execute such an experiment, you feel like this makes it justified to claim that the effect GHGs have has never been observed. Or at least you believe that the same physical mechanisms somehow don’t apply here because other variables might compensate. Well, which ones? You must have some kind of idea, don’t you? What is compensating for the effect CO2 has? Or are you claiming that CO2 has no effect at all?
It is, since we do know. The energy doesn’t just vanish into thin air. It has to go somewhere. Your fellow skeptics regularly invoke the laws of thermodynamics when discussing the greenhouse effect, well … now I am. Where does it go if it doesn’t cause a heat content increase in the oceans? Does it cause a heat content increase of the atmosphere? Does it go straight to space?
What we don’t know is where exactly this energy ends up, since heat gets transported around on this planet. So if the oceans in the tropics can’t radiate as much to space because of an increased greenhouse effect, but changing currents transport the heat towards the poles, then obvioulsy the increase GHE hasn’t caused tropical oceans to warm, since the heat ended up somewhere else. That’s one of the reasons why the experiment you demand is impossible to perform unless we had an identical Earth to experiment with.
I see the problem with demanding impossible experiments. I suspect that you skeptics and you specifically still would find a loop hole even if such an experiment could be done. You’d likely argue then, that just the change in one specific location was measured and we wouldn’t know “how much” for all the other locations on this planet.
This is very similar to someone not buying that gravity works the way it does because we haven’t measured it for a 1 m³ tungsten cube in an orbit around Proxima Centauri yet.
Neither is it skeptical to argue out of ignorance Kenneth. Learn how these mechanisms work, calculating the amount of energy being retained in the oceans and accumulating as increasing heat content is not too hard. If some other mechanism allows to compensate for this, then go out and try to find out what that could be. Present it. But arguing basically that “it’s too complicated to really know” is not being skeptical. Nope.
P.S.: And for other instances, arguing with “what if scientist XY with hilarious claim ABC is right, that would change everything” is also not being skeptical. That is you just not understanding the basics and having a lot of hope in people who use the language of your community being correct 😉
If it’s been observed in a laboratory, then you should be able to identify how much heat loss is generated in a body of water when the air above it has its CO2 concentration reduced by 10 ppm. What’s the answer? Cite the laboratory setting where these measurements came from. You have nothing, again, but you claim you have something. But when asked to produce it…nothing. Again. Why should I believe you that there are laboratory experiments that quantify how much cooling occurs in water bodies when the CO2 is reduced above it?
I want to know if the efficacy of CO2 forcing is potent enough to be the modulator of ocean heat changes, as you believe it is. Is CO2’s effect potent, or is it negligible? Which one? How do you confirm either qualitative value without having some measurements to verify it? Answer: we can’t. So we have to base it on assumptions. You believe CO2 forcing is powerful. I believe that it’s not. I can’t verify my belief with measurements, and you can’t verify your belief with measurements either. So why do you get to decide that you’re right anyway – humans control the oceans’ temperatures – without the quantified evidence to back it up?
Has it? What’s the observed effect that CO2 has on water temperatures in a lab experiment? How much does a water body cool when the CO2 above it is reduced by 10 ppm? Do you have this value? Of course you don’t. So why claim you do?
Unbelievable. And around in circles we go. SebastianH, WE DO NOT HAVE MEASUREMENTS FOR THE “EFFECT CO2 HAS” ON WATER TEMPERATURES. We do not know how much cooling occurs in a water body when the CO2 above it is reduced by 10 ppm. How many times must this be repeated? I can’t answer a question about what is compensating for CO2’s effect if we have no Earthly idea what the effect CO2 changes have on water temperatures. Do I need to write this again?
No, pointing out that we don’t know how much CO2 influences the heat content when reduced or increased over water bodies is not just a hand-waving exercise. It’s fundamental.
So if we know how much CO2 influences changes in the heat content of water bodies, then you should be able to identify how much of an influence that is quantitatively. But you can’t quantify it. You don’t have those measurements. And around and around and around…
What’s the energy amount that doesn’t just vanish into thin air? 0.000000000000000000001 K? 0.000000001 K? What’s the quantified energy value for the heat change caused by CO2? Do you know? Of course not. And around and around and around…
Where does what go? The heat energy generated from CO2 changes? What quantified value would that be? 0.000000000000000000000000000000000000000001 K? 0.01 K? And around and around and around…
No, all we really need is two identical containers in side-by-side, open-spaced, outdoor glass mini “greenhouses” (so the actual Sun can equally radiate on both), one with elevated CO2 (measured, say 800 ppm) inside it and the other ambient/control (also measured, say 450 ppm) and some water thermometers to see if the elevated CO2 container’s water has higher temperatures than the other (i.e., we’re measuring how much of an effect CO2 has). This is effectively the same kind of experiment that they do with glass containers and light bulbs (as a substitute for the Sun) in high school science labs to “prove” that elevated CO2 causes the air to warm more in the e-CO2 container than the control container. How much warmer do you think the water temps would be in the mini greenhouse with 800 CO2 vs. the one with 450 ppm CO2? What’s your guess, based on what you think you know about the quantified effect that CO2 has on water temperatures?
It’s true that a 60 watt incandescent light bulb generates heat, especially in the area 5 to 10 cm near it. But when someone tells you that an entire gymnasium can be heated up by one 60 watt incandescent light bulb, would you be skeptical and ask questions about how much heat it can actually generate for that size of an indoor space, or would you just believe the person telling you that the entire gymnasium heats up with a light bulb, and that that one light bulb is the 100% cause of the warmth? Do you think you would need quantified evidence, measurements, of the heat-generating capacity of the light bulb to accept this claim as valid, or is just knowing that an incandescent light bulb generates heat – without knowing how much heat — all you need to know to believe? Apparently so. Because that’s what’s happening here.
Easy, you do it the same way you can tell how a 1000 kg object behaves in a gravity field from observing how a 1 kg behaved. I did this calculation multiple times for you.
Well, here we have the fundamental problem with your kind of skepticism. You seem to build it on an argument that you have to actually measure something in a very specific setting to be able to tell what is happening in that specific setting. I asked you this many times now, do you believe that there is something unknown happening that causes the radiative heat transfer to be fundamentally different in this situation or do you believe that the heat/energy just goes somewhere else? If so, where does it go ?
Would you at least agree that the laws of physics are universal and can be used to describe physics? The forcing has to affect something, don’t you think? Can’t just vanish into thin air like you seem to wish for with your alternative explanations.
You know the forcing values.
That has nothing to do with believes. You might believe in things, I don’t. I pretty much know that the laws of physics are universal from experience. I don’t believe there is some unknown effect that we have yet to discover that negates the CO2 effect somehow so it doesn’t cause heat content increase in the oceans. But even if there would be such a unknown thing, the other variables don’t explain the observed heat content increase … you might believe that cloud cover change does that, but well … I am guessing you believe anything as long as you think it supports that CO2 or GHGs in general are not involved. Confirmation bias?
Honestly, this is getting weirder with every time you try to argue against the CO2 effect. No, there has not been a lab experiment that replicated an ocean and an entire atmosphere. Somehow you think measurements of the so called GHE of gases like CO2 are not applicable in other settings than in those scenarios where those properties have been discovered.
You are the one continuing this loop …
What? We know what CO2 does, you argue this effect doesn’t affect the oceans. So clearly you must believe that something is compensating this effect or you believe that there is no CO2 effect in the first place. Since I doubt that you are really saying that the laws of physics and over a century of research are wrong … what is it that compensates the CO2 effect? Why does ocean water not heat up when exposed to an increased CO2 effect? Is it because you believe that evaporation compensates it 1:1? Do you believe something unknown “blocks” the effect between the atmosphere and the ocean surface? What is it?
See above … sure I can quantify it for you. I have done so multiple times. This discussion is silly.
There is no heat energy generation. That typical skeptics nonsense talk trying to get to the 2nd law of thermody You don’t understand the mechanisms, do you? At least try to do that first before you argue that it doesn’t work this way …
Really, that simple? And you would trust that those results are applicable to a real world scenario with a kilometer high atmosphere and an actual ocean?
Counterquestion, let’s say this experiments find that the water warmed by 1 K, how would you apply this knowledge to the real world? You know, where we have an air column many kilometers high and water often many kilometers deep. If you can accept something like this as a proxy for the actual thing then why can’t you accept other experiments showing the properties of CO2 as a proxy as well? I don’t get it.
Kenneth, that’s basic physics as well. Of course a 60 Watt light bulb can heat an entire gymnasium. Insulate the object enough and whatever small source of heat is there will cause heat content buildup until the same amount of heat (of the source) gets through the insulation.
I’d be skeptical if they say they’d heat the gymnasium with the windows open.
Umm, it’s a 60 W light bulb, it adds 60 Wh to the room it is in for every hour it is switched on. If the insulation is good enough a lot less than this will get out of the room and thus the heat content builds up. Is that so hard to understand? Why would you need detailed measurements of the light bulb?
What is happening here is you making up stuff that you imagine needs to be done to be able to make certain claims. I suspect this is because you have no understanding of the mechanisms involved and completely rely on interpreted quotes from some papers you imagine to support your worldview. There is no point in arguing against this kind of stubborness.
No, I’m not arguing the CO2 doesn’t affect the oceans. I’m arguing that we don’t know how much the CO2 effect affects the oceans – or any water body for that matter. How much cooling in a body of water will a CO2 reduction of -10 ppm elicit in the air above it? Answer: we don’t know. It could be 0.000000000000000000001 K. It could be 0.000000001 K. No one knows. But this is pointless to go through again. You’re a believer that humans exert fundamental control over the oceans’ temperatures (and glacier melt and sea level rise and hurricane intensity and storm frequency…) by increasing or decreasing their CO2 emissions. I’m not a believer that we can control the weather or climate with wind turbines and solar panels. The evidence continues to pile up that supports this skeptical viewpoint. You can, and will, deny that in perpetuity.
roflmao.. in reams of mindless ranting, seb has said absolutely NOTHING of any relevance, and produce NOTHING but ranting anti-science bluster.
All to avoid producing any actual evidence.
How do you do it, seb ???
Apologies. In my post I got land and sea temperatures the wrong way round.
The values for the correlation coefficients and slopes per annum for each of the main temperature series for the period 1880-1909 are respectively:-
BEST Land +0.519 +0.010681
CRUTem4 Land +0.247 +0.0073
GISS Land +0.591 +0.0112
NCDC Land +0.584 +0.0186
BEST Land +0.519 +0.0107
HadSST3 Sea -0.586 -0.0082
ERSST Sea -0.682 -0.0103
These are global figures. A similar pattern emerges if one uses the CRU land and sea masks on the Cowtan & Way data set over different latitudes.
Why do you continue to avoid responding to my questions about why half a degree of warming was removed from the pre-1950 GISS temperature data since the 1990s? Why do you continue to abscond when I ask you to support your stated belief that almost half the warming in the last few decades is human-caused because the CO2–>warmer waters theory has “no flaws” in it? Do you think it helps the case that you have repeatedly tried to make here – that you are a skeptic – to not address these fundamental questions?
You’re the one who claims that there is no “plausible alternative” to attributing half the warming in recent decades to CO2. That’s not a skeptical perspective – ruling out all other possible explanations as not even plausible. It’s also not a skeptical position to state that a theory (if one can call it that) that lacks real-world physical measurements to support it has “no flaws” in it. In other words, you believe in its truth. That’s how skeptics talk?
Your schtick – post a few sentences about how the scientific papers reviewed here lack merit, and then run off when challenged to support your statements — has become hackneyed and trite.
The praises of the cowardly brave, lol.
https://youtu.be/l8IkbCeZ9to
Leftists leave us no option but mockery of them.
Skeptik,
And who says that your figures (ranging from -0.7 for SST to +0.7 for land) are not entirely natural within the incredibly short timescales used? Can they not just be a feature of the preferred measurement systems involved? As a real skeptic I remain unconvinced of both the methods and figures given.
As an imaginative method of controlling the energy markets the cAGW/CO2 paradigm has a lot going for it, for any other use (e.g. predicting climate changes) it is without substantiated physical evidence.
I don’t think that “Skeptik” is a skeptic. Anyone who writes that a non-observed assumption/hypothesis is so established in physics that it has “no flaws” in it and that there are “no vaguely plausible alternatives” to what he believes to be truth and, when challenged to support his beliefs he just repeats what he has written before and refuses to address the questions… He claims to be a scientist who has published papers in science journals, but scientists do not operate on this way…unless they’re of the activist variety, the kind who run away from debate.
Indeed Kenneth, it appears very much so.
[…] “Modern warming was driven primarily by non-anthropogenic factors; the cooling has begun.” […]
I still have my Pickett N4-ES slide rule! Yeah, slide rule users have a much better understanding of significant figures and where the decimal point belongs.
I cringe whenever I read something like “The sea level is expected to increase approximately 39.37 inches by ….”
Then there’s lines like “tomorrow will be 2°C (35.6°F) warmer than today.”
same slide rule
For those who have never used one, here’s a “virtual” slide rule (your model).
http://www.antiquark.com/sliderule/sim/n4es/virtual-n4es.html
And Pickett did it’s part in getting men to the moon.
https://airandspace.si.edu/collection-objects/slide-rule-5-inch-pickett-n600-es-apollo-13
After getting out of the Navy I went to college. My first year, everyone used slide rules for the exams. It was a requirement. In my second year, calculators were available, but they weren’t allowed on exams. In my third year, everyone used a calculator, by which time they had gone from simple add and subtract to rather powerful programmable. I still have my Pickett, Model “N 3-ES” slide rule with belt loop equipped holster. Wait, here it is in a science museum, lol.
http://americanhistory.si.edu/collections/search/object/nmah_1346807
HISTORY – Sometimes if you blink, you’ll miss it. But, if it was important, you can sometimes catch a rerun of the highlights.
There is no real evidence that CO2 has any effect on climate and plenty of scientific rationale to support the idea that the climate sensitivity of CO2 is zero.
The AGW conjecture is based on only partial science and is full of holes. For example, the AGW conjecture depends upon the existence of a radiant greenhouse effect caused by trace gases in the Earth’s atmosphere with LWIR absorption bands. Such a radiant greenhouse effect has not been observed in a real greenhouse, in the Earth’s atmosphere, or anywhere else for that matter. The radiant greenhouse effect is science fiction so hence the AGW conjecture is nothing but science fiction. It is all a matter of science.
I prefer not to go that far, as saying it’s “fiction” is too definitive.
Instead, the characterization of the radiant GHE as a “thought experiment” seems more apt. Even an AGW activist like Dr. Gavin Schmidt clarifies that a “thought experiment” – What would the temperature of the Earth be without an atmosphere? – is indeed what it is. We are basing much of the world’s energy future, and pocking the landscape and destroying habitat with solar panels and wind turbines, and spending trillions per year…on a thought experiment.
Dr. Gavin Schmidt, NASA
“The size of the greenhouse effect is often estimated as being the difference between the actual global surface temperature and the temperature the planet would be without any atmospheric absorption, but with exactly the same planetary albedo, around 33°C. This is more of a “thought experiment” than an observable state, but it is a useful baseline.”
The Earth’s climate has already “suffered” a doubling of CO2 and nothing catastrophic happened. The Tertiary plant life was lush and the marine carbonate plankton prospered during a drop in pH. No “acidification”.
Nature 461, 1110-1113 (22 October 2009)
Atmospheric carbon dioxide through the Eocene–Oligocene climate transition: Paul N. Pearson, Gavin L. Foster, Bridget S. Wade
“Geological and geochemical evidence indicates that the Antarctic ice sheet formed during the Eocene–Oligocene transition 33.5–34.0 million years ago. Modelling studies suggest that such ice-sheet formation might have been triggered when atmospheric carbon dioxide levels fell below a critical threshold of ~750 p.p.m.v. During maximum ice-sheet growth, pCO2 was between 450 and 1,500 p.p.m.v., with a central estimate of 760 p.p.m.v.”
SebastianH believes that high CO2 causes mass extinctions, and that 30,000 species are going extinct every year. That’s the kind of thinking that we’re up against.
[…] recent post New Paper: Modern Warming Was Driven By ‘Primarily Natural’ Factors. Global Cooling Has Now Begu… authored by Kenneth Richards at Pierre Gosselin’s blog NoTrickZone introduced the Mao et al 2019 […]
[…] recent post New Paper: Modern Warming Was Driven By ‘Primarily Natural’ Factors. Global Cooling Has Now Begu… authored by Kenneth Richards at Pierre Gosselin’s blog NoTrickZone introduced the Mao et al 2019 […]
[…] recent post New Paper: Modern Warming Was Driven By ‘Primarily Natural’ Factors. Global Cooling Has Now Begu… authored by Kenneth Richards at Pierre Gosselin’s blog NoTrickZone introduced the Mao et al 2019 […]
Sounds like a solid prediction! How many years of continued warming that you will be convinced that this claim (2) is wrong? 5? 10? 20?
I’m always impressed when skeptics fall for the use of FFT analysis to extrapolate future development of a variable based on past behaviour. As if there wasn’t a pretty new development with some of the causes for the change we can observe today 😉
Maybe my weight will continue on the periodic up and down curve that it has been on since my birth, or it will change because I started running recently? What do you think?
Assuming you’re claiming that human CO2 emissions have emerged as the dominant cause of changes in drought and flood frequency and intensity, hurricane and storm frequency and intensity, sea ice fluctuations, wind strength, glacier melt, species extinctions, ocean temperatures… What kind of changes have we observed in these weather/climate events that are clearly unprecedented, unusual, and therefore predominantly attributable to human CO2 emissions in the absence of all other causes?
Haine, 2016
“The anthropogenic melt from the Greenland ice sheet is still too small to be detected. … [N]o clear change in the delivery of Arctic freshwater to the North Atlantic due to human climate forcing.”
—
Hansen et al., 2016
“[W]e found that there is (yet) no observable sea-level effect of anthropogenic global warming in the world’s best recorded region.”
—
Ding et al., 2014
http://www.nature.com/nature/journal/v509/n7499/full/nature13260.html
“Here we show that the recent warming in this region [northeastern Canada and Greenland] is strongly associated with a negative trend in the North Atlantic Oscillation, which is a response to anomalous Rossby wave-train activity [planetary waves related to the Earth’s rotation] originating in the tropical Pacific. … This suggests that a substantial portion of recent warming in the northeastern Canada and Greenland sector of the Arctic arises from unforced natural variability.”
—
Parker and Ollier, 2017
“The loud divergence between sea-level reality and climate change theory—the climate models predict an accelerated sea-level rise driven by the anthropogenic CO2 emission—has been also evidenced in other works such as Boretti (2012a, b), Boretti and Watson (2012), Douglas (1992), Douglas and Peltier (2002), Fasullo et al. (2016), Jevrejeva et al. (2006), Holgate (2007), Houston and Dean (2011), Mörner 2010a, b, 2016), Mörner and Parker (2013), Scafetta (2014), Wenzel and Schröter (2010) and Wunsch et al. (2007) reporting on the recent lack of any detectable acceleration in the rate of sea-level rise.”
—
Jones et al., 2016
http://www.nature.com/nclimate/journal/v6/n10/full/nclimate3103.html
“Most observed trends [over the 36-year satellite data] are not unusual when compared with Antarctic palaeoclimate records of the past two centuries. … [C]limate model simulations that include anthropogenic forcing are not compatible with the observed trends. This suggests that natural variability overwhelms the forced response in the observations”
—
Stenni et al., 2017
http://www.clim-past-discuss.net/cp-2017-40/cp-2017-40.pdf
“No continent-scale warming of Antarctic temperature is evident in the last century. … [M]ost of the trends observed since satellite climate monitoring began in 1979 CE cannot yet be distinguished from natural (unforced) climate variability, and are of the opposite sign [cooling] to those produced by most forced climate model simulations over the same post-1979 CE interval.”
I am claiming nothing. Science is claiming or rather is very confident that this is what is going on. Over half of the observed climate change comes from human CO2 emissions, another large percentage comes from other GHGs directly or indirectly emitted.
Another default Kenneth defense: claiming that nothing unusual is happening since all is super fine. Nothing to see here.
Call me when the overall heat content of this planet is decreasing for maybe a decade. Then we can talk about how “global cooling” has began or everything is fine for now.
What’s the “this” that is going on with the weather or climate that is unusual, unprecedented, or outside the range of natural variability?
What’s the “observed climate change” you’re referring to?
I don’t claim that nothing unusual is happening “since all is super fine.” I claim that nothing unusual is happening because that’s what the observations indicate. Do you have observational evidence that suggests that something unusual is happening today that can be attributed to humans?
Since 1870s – no warming
Greenland – no warming
New Zealand – no warming
Antarctica – no warming
North Atlantic – no warming
Western Pacific – no warming
India/Western Himalaya – no warming
Pakistan – no warming
Turkey – no warming
Himalayas/Nepal – no warming
Siberia – no warming
Portugal – no warming
NE China – no warming
SW China – no warming
South China – no warming
West China – no warming
Southern South America – no warming
Canada (B.C.) – no warming
Canada Central – no warming
Since 1940s/50s – no warming
Northern Hemisphere – no warming
Arctic Region – no warming
Greenland – no warming
South Iceland – no warming
North Iceland – no warming
Alaska – no warming
New York – no warming
Rural U.S. – no warming
Northern Europe – no warming
Western Europe – no warming
Mediterranean Region – no warming
Finland and Sweden – no warming
East Antarctica – no warming
North Atlantic – no warming
Western North Atlantic – no warming
Brazil – no warming
SE Australia – no warming
Southern South America – no warming
Andes Mountains – no warming
Chile – no warming
[…] warming has been due to balancing factors, and that we are now entering a new deep cooling period: https://notrickszone.com/2019/01/21/new-paper-modern-warming-was-driven-by-primarily-natural-factors-… via NOT A LOT OF PEOPLE KNOW THAT http://bit.ly/2FDNcwJ January 22, 2019 […]
[…] https://notrickszone.com/2019/01/21/new-paper-modern-warming-was-driven-by-primarily-natural-factors-… […]
The Earth’s climate has already “suffered” a doubling of CO2 and nothing catastrophic happened. The Tertiary plant life was lush and the marine carbonate plankton prospered during a drop in pH. No “acidification”.
Nature 461, 1110-1113 (22 October 2009)
Atmospheric carbon dioxide through the Eocene–Oligocene climate transition: Paul N. Pearson, Gavin L. Foster, Bridget S. Wade
“Geological and geochemical evidence indicates that the Antarctic ice sheet formed during the Eocene–Oligocene transition 33.5–34.0 million years ago. Modelling studies suggest that such ice-sheet formation might have been triggered when atmospheric carbon dioxide levels fell below a critical threshold of ~750 p.p.m.v. During maximum ice-sheet growth, pCO2 was between 450 and 1,500 p.p.m.v., with a central estimate of 760 p.p.m.v.”
The graphic is very similar to Klyashtorin and Lyubushin (2007).Their work deals with a ~60 year ocean cycle inspired by fisheries data. Klyashtorin has a similar report for the U.N. in I believe 2008.For reasons unfathomable to me, these Russians have been largely ignored.
https://geosciencebigpicture.files.wordpress.com/2017/12/klyastorin-arctic-global.png
The proponents of anthropogenic-caused global warming invariably, (and ironically) DENY that the Medieval Warming Period (MWP, 1,000 years ago) was global and likely warmer than it is now. These alarmists acknowledge only that Europe experienced the MWP. (They had no choice – it’s too well documented!) They likely take this unjustifiable position because their computer models cannot explain a global, warmer MWP. Why? Because their models require an increasing co2 level, plus depend even more on the ASSUMPTION that water vapor feedback is the actual culprit, causing 2 to 3 times the temperature increase as brought on by the increase in co2. However, co2 did not begin increasing until about the mid 1800s, long after the MWP.
The global temperature increase during the MWP could not have been influenced by co2 because there was no increase in co2 and, obviously, also no water vapor feedback. It therefore becomes plausible that our current warming (such as it is) may also be due to NATURAL climate variation. But that conflicts with Mann’s hockey stick graph, and its various adherents, all of whom claim that our current warming is mostly due to human activity which causes an increase in co2 level.
However, it’s easy to show that the MWP was indeed both global and at least as warm as now. While that proves nothing about the cause of our current warming (such as it is) it speaks loudly about the credibility of the folks who DENY that the MWP was global and at least as warm as now.
A brief meta-analysis, a global study, follows, which makes use of numerous peer-reviewed studies, as well as other easily accessible data. The analysis demonstrates that the MWP was global and at least as warm as it is now.
First, the MWP trend is conclusively shown to be global by borehole temperature data. No controversial models needed, the data speaks for itself. The 6,000 boreholes scattered around the globe are not constrained to just those locations where ice core data has been used. A good discussion of the borehole data can be found at Joanne Nova’s website.
http://joannenova.com.au/2012/11/the-message-from-boreholes/
Next, the receding Alaskan Mendenhall glacier recently exposed a 1,000-year-old shattered forest, still in its original position. No trees (let alone a forest) have grown at that latitude anywhere near that site since the MWP. It was obviously significantly warmer in that part of Alaska than it is now, and Alaska is quite distant from Europe.
Finally, there have been hundreds of peer-reviewed MWP studies around the globe, with investigation results showing each site to have been warmer during the MWP than at the time of the study, and that result was reflected in earlier IPCC reports. The continuation of similar confirming research also continues to be ignored by the usual suspects. The MWP studies were carried out around the globe by investigators and organizations representing numerous countries. It’s curious that Mann and his cohort did not give more consideration to the existing studies before presenting their conflicting “hockey stick” claim, particularly given the controversial process they employed. One of the well-known alarmists, Phil Jones, admitted publicly that if the MWP was global and as warm as now then it’s a “different ballgame”. (But apparently neither Phil or Mann, nor other alarmists bothered to re-examine the conflicting data.) Even today peer-reviewed studies continue to regularly show up confirming that the MWP was at least as warm as now.
The Greenland Temperature (gisp2) study (google it), for example, shows, among other things, that Greenland was warmer during the MWP than it was at the time of that study. Greenland is distant from both Europe and Alaska. There’s also a separate link: https://junkscience.com/2018/06/study-ancient-greenland-was-much-warmer-than-previously-thought/
The numerous MWP studies have been cataloged by the co2science.org website. Dr. Idso, the proprietor of that website, is a known skeptic. However, the peer-reviewed studies were independently performed by numerous researchers who not only represented many different countries but also used various temperature proxy techniques. Dr. Idso is merely operating as a librarian.
Interested readers should satisfy themselves by going to co2science.org and choosing (say) a half-dozen regions (all should be remote from Alaska, Greenland, and Europe). Focus on the subset of the MWP studies which directly address temperature. Choose at least one temperature study from each selected region. (Idso provides brief summaries but you can also review the original study.) You will find that each of the selected study sites was found to be warmer during the MWP than at the time of the study. These study results are consistent with the temperature trend exhibited by borehole data. Conversely the aggregate studies confirm the global borehole data trend.
There are also other confirming observations which include such things as antique vineyards found at latitudes where grapes cannot be grown today, old burial sites found below the perma-frost, and Viking maps of most of Greenland’s coastline. There is a recent report, which references various studies, showing that South America experienced the MWP.
https://notrickszone.com/2018/11/03/new-study-medieval-warm-period-not-limited-to-north-atlantic-but-occurred-in-south-america-as-well/
This meta-study is an aggregate of straightforward peer-reviewed studies, any of which can be replicated and the research results do NOT require the use of controversial “models”, or dubious statistical machinations.
One of the “talking points” posed by alarmists attempting to “rebut” the global, warmer MWP is their claim that warming in all regions during the MWP must be synchronous. Obviously the MWP studies were generally performed independently, so the start and end dates covered by each MWP study will likely vary.
However, anyone foolish enough to accept that “synchronous” argument must be prepared to admit that our current warming would also not qualify as a global event. For example, many alarmists go back into the 1800s when making their claims about the total global warming temperature increase. However, that ignores a three decade GLOBAL cooling period from 1945 to 1975. In fact, that globally non-synchronous period is much more significant than just a region or two not showing a temperature increase.
There are also other good reasons to exclude consideration of temperature increases during the 1800s. There was a significant NATURAL warming beginning around 1630 (the first low temperature experienced during the Little Ice Age), according to Dr. David Evans, and that period of naturally increasing temperatures continued until about 1850, at which time co2 began increasing. But it would have taken many subsequent decades, possibly more than a century, for co2 increase after 1850, at an average 2 ppmv per year, to accrue sufficiently before having any impact on tempeature measurements. Neither is there any reason to expect that the 200 years of natural and significant warming beginning in 1630 ended abruptly, after 2 centuries, merely because co2 level (a trace gas) began increasing in 1850 at a miniscule 2ppmv per year. How much, and for how long was the temperature increase after 1850 due mostly to the continuing natural climate warming beginning in 1630?
Also, related to the “synchronous” argument, any current considerations about global warming must be constrained to a starting point AFTER the cooling which ended in 1975. The global temperature began steadily increasing in 1975 and that increase basically terminated during the 1997/98 el Nino. Even the IPCC (a bureaucracy which cannot justify its mission if our current warming is NATURAL) has acknowledged a GLOBAL “hiatus” in temperature increase after 2000. This admission conflicts with the well-known fact that co2 level has steadily increased since around 1850. Where is the missing heat?
So, our current “global warming” controversy involves basically two decades, (1975 to 1998) and that warming has been followed, by almost another two decades of no further statistically significant increase in temperature. But wait … ! It turns out that even the period from 1975 to 1998 apparently does not qualify as a global warming period because there were numerous “out of synch” regions and/or countries which experienced no additional warming over durations which are included in the 1975-1998 span.
https://notrickszone.com/2018/02/18/greenland-antarctica-and-dozens-of-areas-worldwide-have-not-seen-any-warming-in-60-years-and-more/#sthash.5Hq7Xqdh.JsV4juVL.dpbs
https://wattsupwiththat.com/category/hiatus-in-global-warming/
Another alarmist attempt at rebuttal is that the MWP studies cataloged by co2science.org have been cherry-picked. (Dozens of independently peer-reviewed studies spanning several decades, all cherry-picked? And what about the borehole data? And the other supporting data? Readers can satisfy themselves by searching for credible peer-reviewed MWP temperature studies which support alarmist claims and supposedly were not cataloged by Idso at co2science.org. But, keep in mind that a few stray conflicting studies will not likely have much impact, because, as the previous link demonstrates, there are, during 1975-1998, a number of regions showing no increasing warming.
There is another question regarding the assumptions used in the alarmist computer models. The greenhouse gas theory, if applied to the open atmosphere, carries with it a critical caveat: there must also be an accompanying warmer region about 10km above the tropics.
Despite decades of radiosondes that “hot spot” has never been found, and this is not a matter of missing data. The radiosonde temperatures cover various altitudes including above 10km.
Occasionally some proponent of anthropogenic catastrophic warming claims to have found that “hot spot”. (Alarmists apparently do not otherwise bring up that subject.) But the folks making such a claim stretch their credibility beyond the breaking point by (1) ignoring the actual data, and (2) replacing the data with speculation (which is NOT evidence).
There is another issue. The alarmist computer modelers insist on including the water vapor feedback assumption when the applicability of GHG theory to the open atmosphere is itself in question (no “hot spot” detected, also satellites detect heat escaping to space). Without water vapor feedback, the potential warming threat is greatly diminished. Ironically, this is currently reflected by the widening difference between computer model projected and the subsequent actual recorded temperatures.
Ooops!
15,000 equations sounds like Fourier stuff.
Won’t work on climate.
And it did not work on something called macroeconomics.
Dreamworld stuff.
Would you also characterize the greenhouse warming hypothesis as “dreamworld stuff”…since it’s based on a thought experiment?
https://notrickszone.com/2017/09/25/another-new-paper-dismantles-the-co2-greenhouse-effect-thought-experiment/
[…] Fonte: No Tricks Zone […]
Fact: Average US Baby Size @ Birth: 7.5 Pounds & 20 Inches Length
Fact: First 6 Months Growth / Month: (1.5 Pounds & 1″ Length) / Month
Fact: Average Lifespan in US: 78 Years
Fact: Weight & Length @ Death: 1,404 Pounds & 82 Feet Tall
The Facts are undeniable!
Sun gets warm, oceans get warm, release gases including water vapor, protects the earth.
Sun cools, oceans cool, release less gases, protects the earth.