Climate models postulate that increasing CO2 concentrations will intensify the Earth’s water cycle. This intensification is believed to eventually result in dangerous (3°C and up) global warming. Observational evidence has thus far falsified these IPCC-endorsed claims.
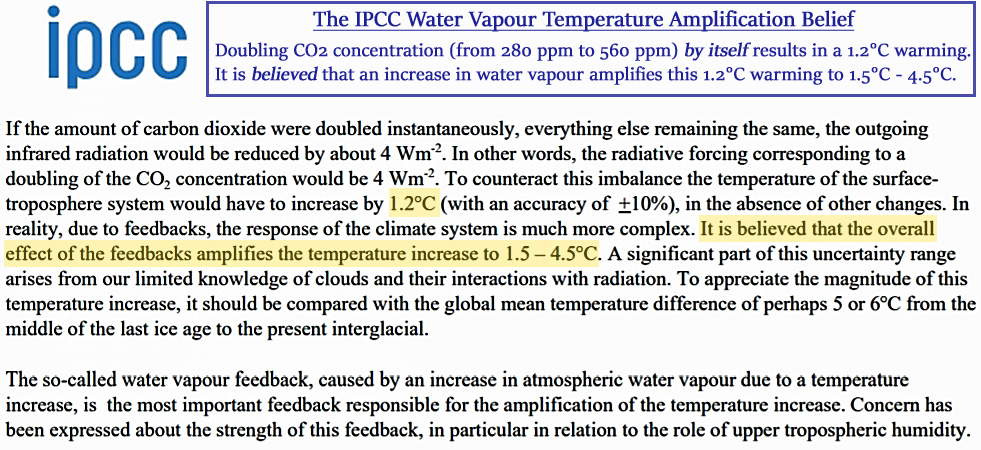
Image Source: IPCC WG1
According to climate models, water vapor and precipitation trends were supposed to have been enhanced as a consequence of rising anthropogenic CO2 emissions.
And yet after compiling decades of observational and evidence, it has been determined there has been no detectable global-scale human influence on the Earth’s hydrological cycle.
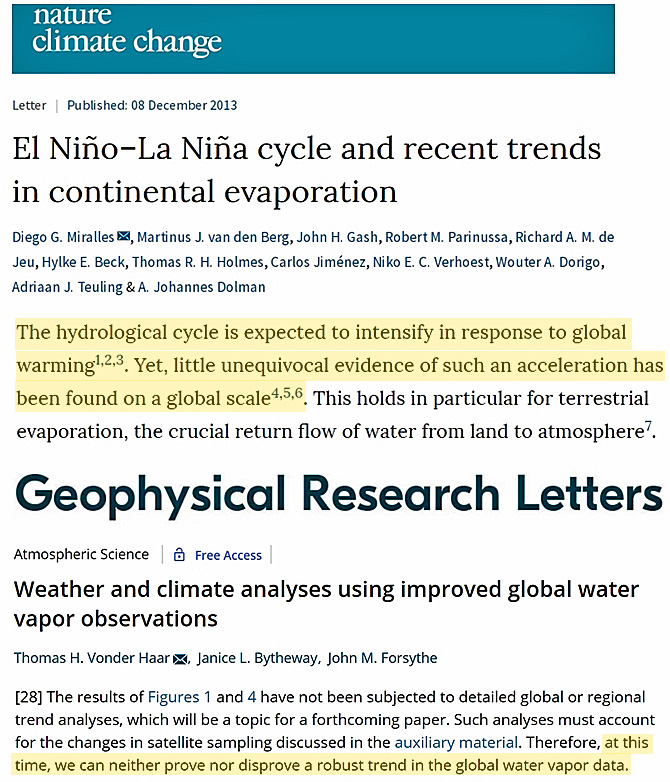
Image Source(s): Miralles et al., 2013 and Vonder Harr et al., 2012
There have been many new scientific papers published that document the observed lack of any detectable global trends in the Earth’s hydrological cycle during the last century, or since anthropogenic CO2 emissions began rising dramatically.
Without water vapor-induced temperature amplification, the model-based consequence of doubling CO2 concentrations to 560 ppm (from the pre-industrial 280 ppm value) is a warming of just over 1°C. This temperature change is neither dangerous or even concerning.
Simply put, the lack of supporting evidence for an anthropogenic intensification of the hydrological cycle effectively decimates a cornerstone of the dangerous anthropogenic global warming narrative.
No AGW Changes To Hydrological Cycle Detectable
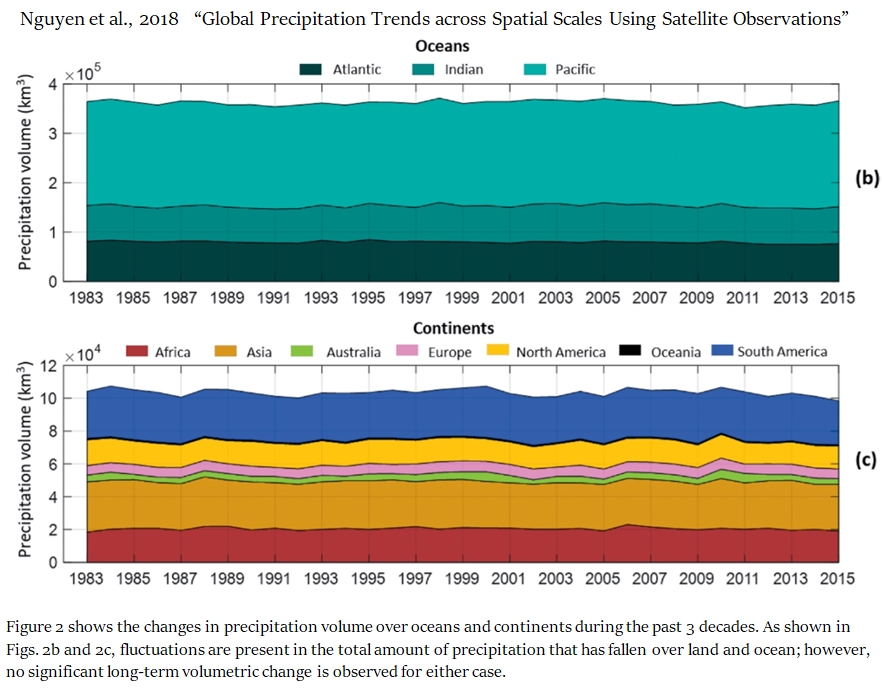
“Little dispute surrounds the observed global temperature changes over the past decades. As a result, there is widespread agreement that a corresponding response in the global hydrologic cycle must exist. However, exactly how such a response manifests remains unsettled. Here we use a unique recently developed long-term satellite-based record to assess changes in precipitation across spatial scales. … Our results show opposing trends at different scales, highlighting the importance of spatial scale in trend analysis. Furthermore, while the increasing global temperature trend is apparent in observations, the same cannot be said for the global precipitation trend according to the high-resolution dataset, PERSIANN-CDR, used in this study.”
“Figure 2 shows the changes in precipitation volume over oceans and continents during the past 3 decades. As shown in Figs. 2b and 2c, fluctuations are present in the total amount of precipitation that has fallen over land and ocean; however, no significant long-term volumetric change is observed for either case.”
“As shown, the warm temperate regions in North America and East Asia, as well as the equatorial regions in Africa, have been experiencing statistically significant negative trends in their mean annual precipitation. On the contrary, arid regions over Africa are observing a positive precipitation trend. In general, warm temperate climate regions have decreasing trends while arid and polar climate regions have increasing trends in precipitation. Africa shows the clearest precipitation trends according to climate zones, where arid regions have a significant increase and the equatorial region has a significant decreasing trend. … Figure 5 shows the precipitation trends over 237 global major basins. Globally, 20 basins have significant increasing trends and 20 basins have significant decreasing trends in precipitation.”
“The take-home message from our study using the new 33+ years [1983-2015] of high-resolution global precipitation dataset is that there seems not to be any detectable and significant positive trends in the amount of global precipitation due to the now well-established increasing global temperature. While there are regional trends, there is no evidence of increase in precipitation at the global scale in response to the observed global warrming.”
“[C]limate change results are highly model dependent so that even opposite climate change signals may be achieved from different types of climate models. This is mainly due to the fact that climate models with different resolutions and physics provide different representations of surface heterogeneities and mesoscale climatological structures. … We consider a climate change signal to be robust where at least 70% of the models agree on the direction of change. … In contrast to the projected increase in extreme precipitation, there is no robust change in precipitation totals on the global scale.”
“Here, we average four tree-ring width chronologies from the southeastern Tibetan Plateau (TP) over their common intervals and reconstruct the variability in regional relative humidity (RH) from the previous May to the current March over 1751–2005. In contrast to the summer drying associated with centennial-scale warming and the weakening of the Asian summer monsoon, our RH [relative humidity] reconstruction shows no significant centennial trend from the 1820s through the 2000s.”
“The aim of this study was to analyse spatiotemporal trends in rainfall along the Brazilian Legal Amazon between 1998 and 2015. … No evidence of significant rainfall trends (p ≤ 0.05) for annual or monthly (except for September, which showed a significant negative trend) averages was found. … The annual pixel-by-pixel analysis showed that 92.3% of the Brazilian Amazon had no rainfall trend during the period analysed, 4.2% had significant negative trends (p ≤ 0.05), and another 3.5% had significant positive trends (p ≤ 0.05).”
“The confidence for drought changes over large sections of the world remains low [Field et al., 2012, p. 171]. Greve et al. [2014] and Sheffield et al., [2012] confirmed and further reinforced such low confidence, showing that over much of the global continents, robust dryness tendencies failed to be detected. Thus, the AR5 projections [Stocker et al., 2013, p. 20] that “the contrast in precipitation between wet and dry regions and between wet and dry seasons will increase” (summarized as a “dry gets drier” pattern) does not emerge as a robust feature in observational records, especially after adjusting the definition of dry and wet areas [Greve and Seneviratne, 2015].”
“[T]he attribution of rainfall trends to human influence on local and regional scales is not yet possible (Sarojini et al., 2016).”
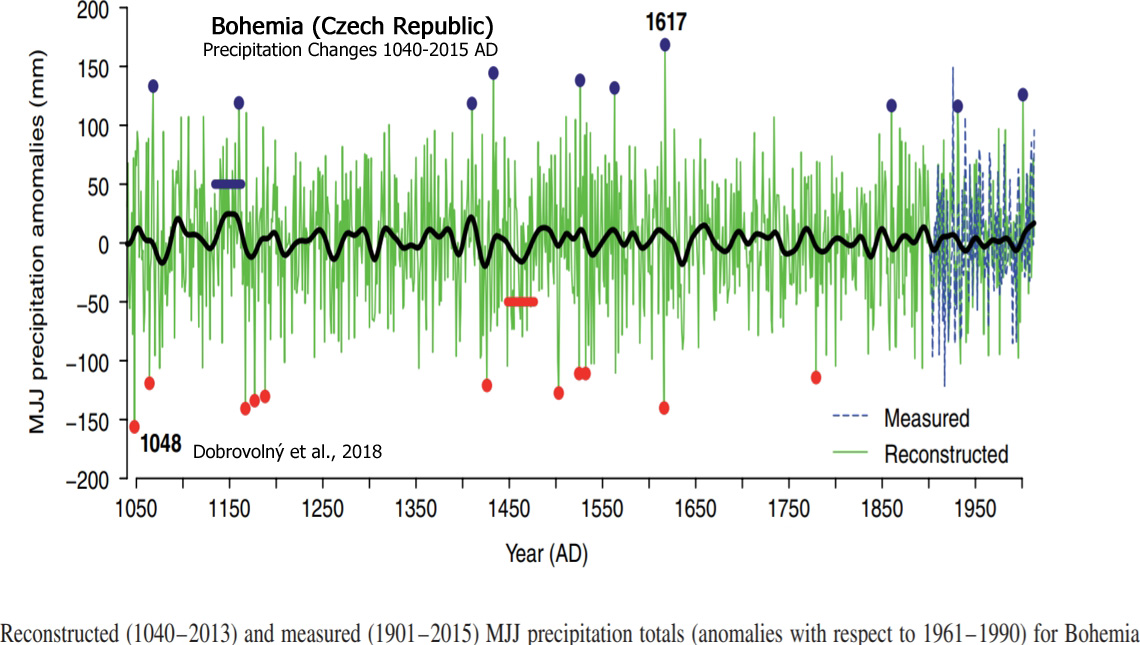
“The new MJJ precipitation reconstruction is restricted to inter-annual and inter-decadal variability, which is in line with our understanding of natural precipitation variability. Reconstruction reveals two long periods of low precipitation variability, in the 13th–14th centuries and 1630s–1850s. It also demonstrates that precipitation anomalies of larger amplitude and longer duration occurred in the earlier part of the last millennium than those found in the instrumental period. Negative trends in soil moisture content and gradual changes in annual precipitation distribution leading to higher extremity of precipitation regime may be responsible for the lower sensitivity of oaks to precipitation after the 1980s. The new reconstruction does not indicate any exceptional recent decline in MJJ precipitation.”
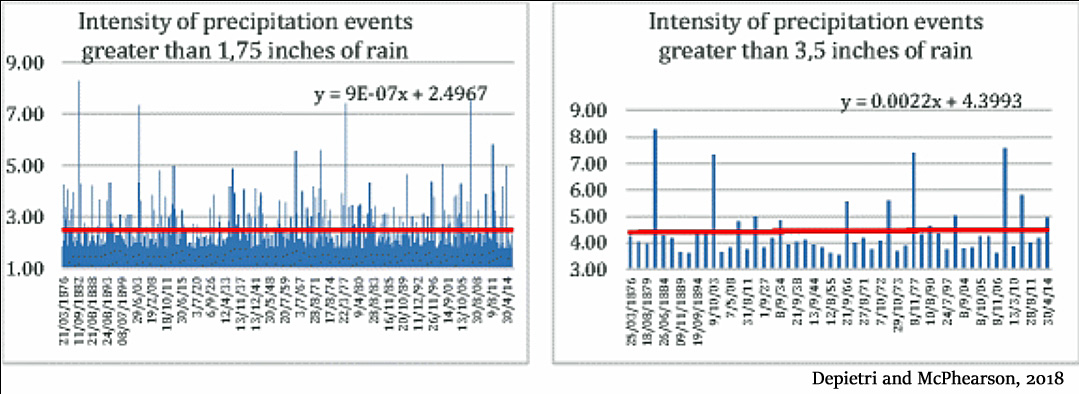
Depietri and MacPhearson, 2018
“Also not significant are the trends in extreme precipitation (beyond 1.75 in. and beyond 3.5 in.) with significant inter-annual and interdecadal variability.”
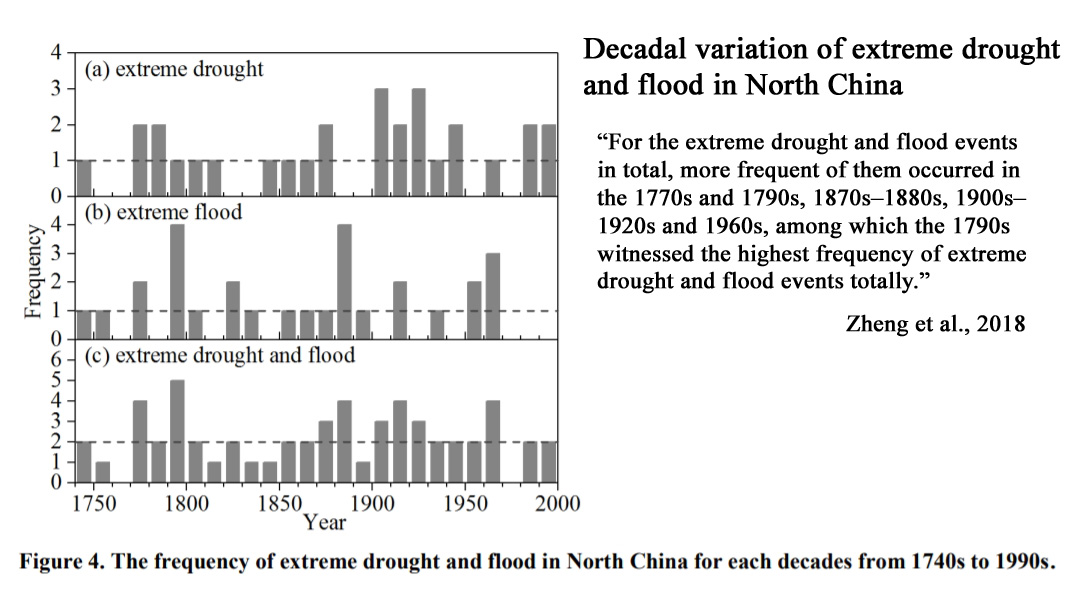
“The main objective of this paper is to detect the evidence of statistically significant flood trends across Europe using a high spatial resolution dataset. … Anticipated changes in flood frequency and magnitude due to enhanced greenhouse forcing are not generally evident at this time over large portions of the United States for several different measures of flood flows. … Thus, similarly to the main findings of Archfield et al. (2016) for the US, the picture of flood change in Europe is strongly heterogeneous and no general statements about uniform trends across the entire continent can be made.”
“For the extreme drought and flood events in total, more frequent of them occurred in the 1770s and 1790s, 1870s–1880s, 1900s–1920s and 1960s, among which the 1790s witnessed the highest frequency of extreme drought and flood events totally.”
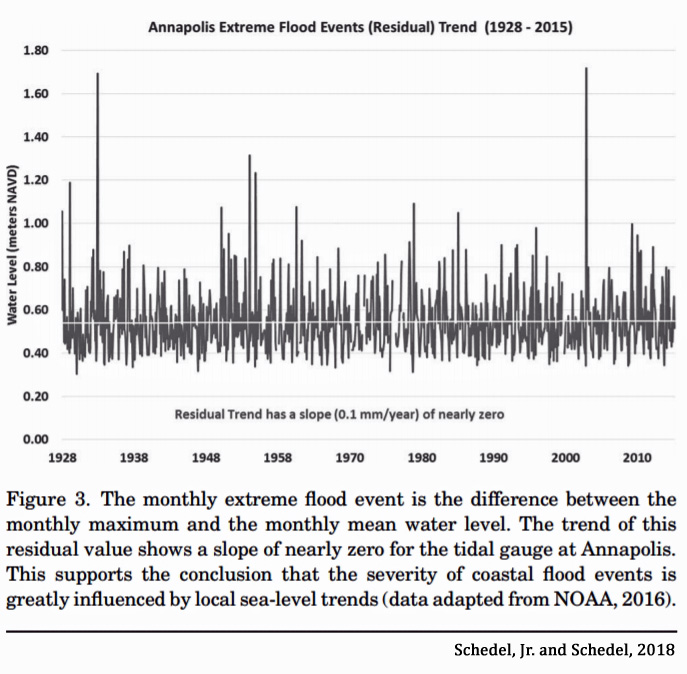
Schedel, Jr. and Schedel, 2018
“Flood events on the U.S. East Coast are not more severe or frequent than in the past.”
“This study presents a chronology of historical and measured flood events in the Papaloapan River basin of Mexico during 450 years. Twenty-eight historical floods were recorded during the period 1550–1948 [7 per century] on this river and one flood event (1969) in the instrumental era (1949–2000) [2 per century], of which 14 were extraordinary floods and only 15 were catastrophic ones. There were several flood-rich decades during 1860–1870, 1880–1890, 1920–1930 and 1940–1950.”
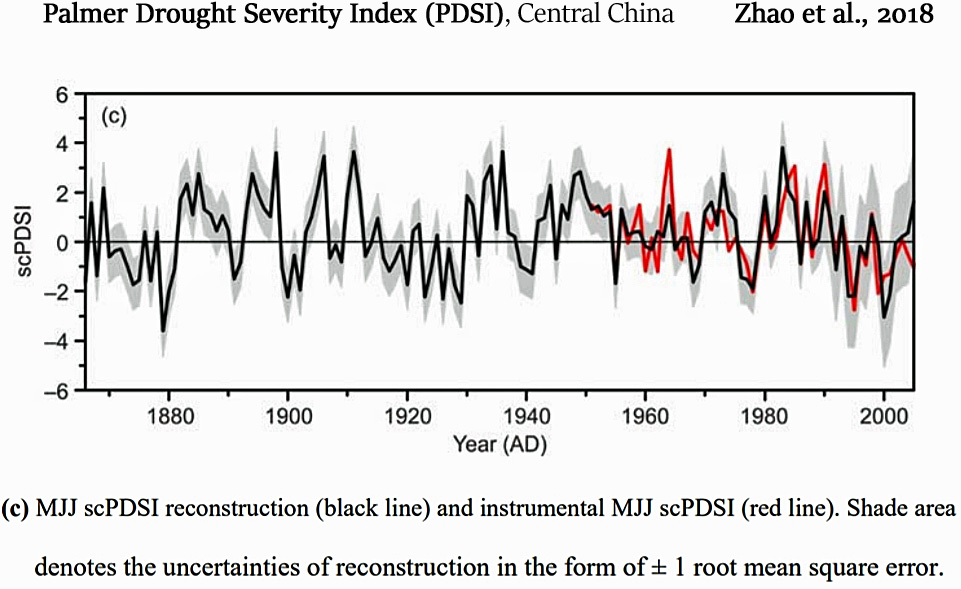
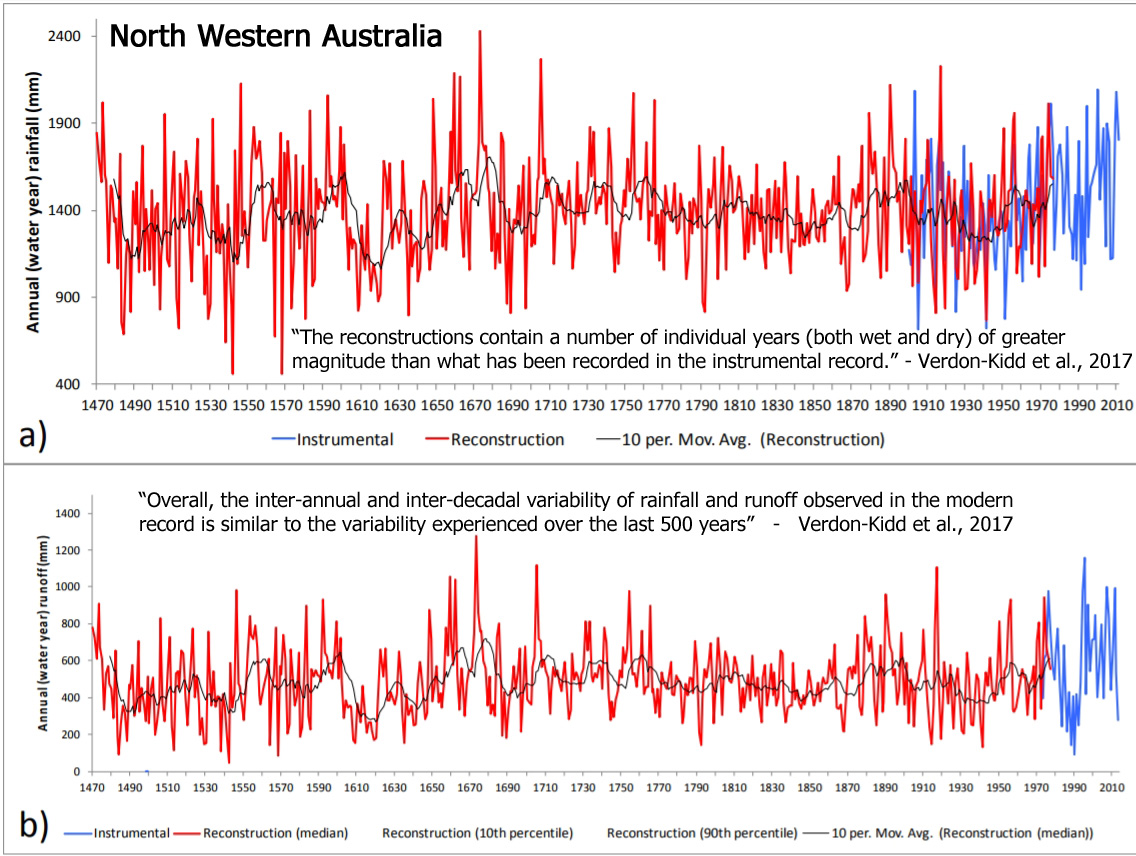
“Overall, the inter-annual and inter-decadal variability of rainfall and runoff observed in the modern record (Coefficient of Variation (CV) of 22% for rainfall, 42% for runoff) is similar to the variability experienced over the last 500 years (CV of 21% for rainfall and 36% for runoff). However, the modern period is wetter on average than the pre-instrumental (13% higher for rainfall and 23% higher for runoff). Figure 9 also shows that the reconstructions contain a number of individual years (both wet and dry) of greater magnitude than what has been recorded in the instrumental record.”
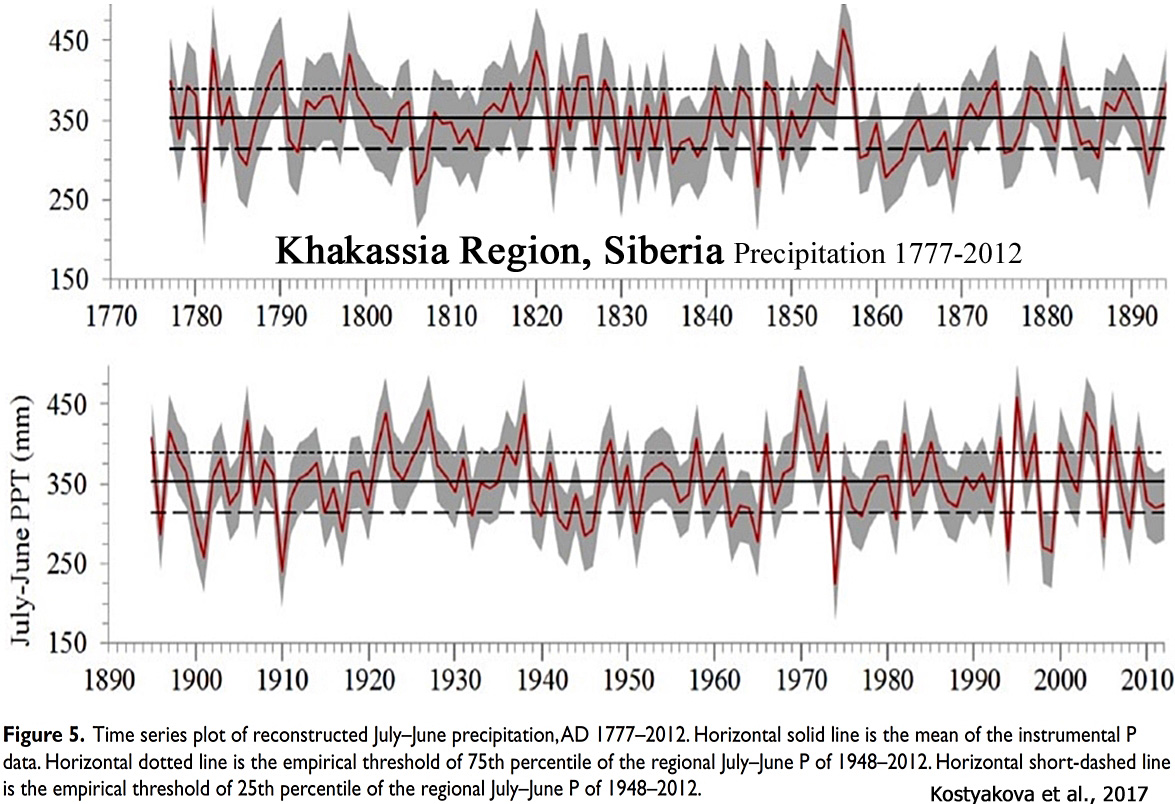
“A nested July–June precipitation reconstruction for the period AD 1777–2012 was developed from multi-century tree-ring records of Pinus sylvestris L. (Scots pine) for the Republic of Khakassia in Siberia, Russia. … The longest reconstructed dry period, defined as consecutive years with less than 25th percentile of observed July–June precipitation, was 3 years (1861–1863). There was no significant difference in the number dry and wet periods during the 236 years of the reconstructed precipitation.”
“20th century precipitation variability in southern Tibet falls within the range of natural variability in the last 4100 yr, and does not show a clear trend of increasing precipitation as projected by models. Instead, it appears that poorly understood multidecadal to centennial internal modes of monsoon variability remained influential throughout the last 4100 yr. … Until we have a predictive understanding of multidecade to multi-century variability in the Asian monsoon system, it would be wise to consider the risk of prolonged periods of anomalously dry and wet monsoon conditions to be substantial (Ault et al., 2014). Such variability may also explain why the predicted anthropogenic increase in Asian monsoon precipitation is not widely observed.”


The warmth due to increased water vapor is most evident at the poles and especially the Artic. According to Joe Bastardi this increased water vapor is a result primarily of the last strong El Nino. In my neck of the woods, in north central Indiana, the only appreciable effect on temperature was significantly higher night time lows during the height of the summer from late June through July. During a typical summer you’ll find me and my neighbor solving the worlds problems over an adult beverage or two around a fire in one of our fire pits. This summer that activity was cut down considerably because so many nights were just to warm to enjoy a fire.
Thanks for compiling this set of papers, showing another AGW supposition unsupported by empirical data. One favorite chart displaying this lack of hydrology effect comes from John Christy’s 2016 US House Subcommittee hearing:
https://i0.wp.com/edberry.com/SiteDocs/Christy11.jpg
The complete testimony is here:
https://docs.house.gov/meetings/SY/SY00/20160202/104399/HHRG-114-SY00-Wstate-ChristyJ-20160202.pdf
Is this not exactly what I have been saying all along and have been pilloried for my views? “The high positive feedback from water vapour is probably a myth.”
https://notrickszone.com/2018/11/16/renowned-physicist-freeman-dyson-theories-of-climate-are-very-confused-models-are-wrong/#comment-1278916
https://notrickszone.com/2018/11/27/40-year-meteorologist-says-recent-global-warming-due-to-natural-ocean-cycle-related-water-vapor-not-co2/#comment-1279667
https://notrickszone.com/2018/12/20/arctic-glaciers-advanced-16-km-during-2008-2016-in-a-region-that-was-6c-warmer-9000-years-ago/#comment-1281434
https://notrickszone.com/2018/12/20/arctic-glaciers-advanced-16-km-during-2008-2016-in-a-region-that-was-6c-warmer-9000-years-ago/#comment-1281666
No, no one has ever “pilloried” you for questioning the belief that water vapor positive feedback is not supported by observational evidence. The views you have been pilloried for are the ones in which you claim that (a) CO2-caused global warming (i.e., CO2 IR heats up the oceans) is rooted in real-world “established physics” (though you have yet to produce this evidence), your claim that (b) the influence of solar and cloud forcing on temperatures in recent decades is not even “vaguely plausible” despite significant observational evidence to the contrary, and (c) your claim that the instrumental temperature record has not been doctored (warming the present, cooling the past artificially) to align better with models, consistent with your belief that the BEST data set is run by skeptics.
https://notrickszone.com/2018/12/01/new-university-of-exeter-study-finds-climate-models-skewed-overhype-co2-uncertainties-rigorously-concealed/comment-page-1/#comment-1279954
“The main reason why the models overestimate the importance of CO2 as a driver of climate change is that nobody has, as yet, come up with an even vaguely plausible alternative or supplementary explanation for the temperature changes that we have actually seen.”
https://notrickszone.com/2018/12/10/the-list-grows-now-85-scientific-papers-assert-co2-has-a-minuscule-effect-on-the-climate/comment-page-1/#comment-1280657
“There is a major problem facing us if we wish to ascribe global warming to solar effects. The plot of total solar irradiation against time shows a very pronounced eleven year cycle/oscillation. The amplitude of this oscillation completely dwarfs any longer term changes that there might be. … I would suggest that we have to look elsewhere.”
https://notrickszone.com/2018/12/05/france-2-0-police-brutally-beat-protesters-as-german-environment-minister-aims-to-boost-fossil-energy-prices/comment-page-1/#comment-1280267
“AGW is ‘only’ a theory – but it is one based on long established physics, none of which is unique to climate science and which, in general, has received ample empirical verification elsewhere.”
https://notrickszone.com/2018/12/20/arctic-glaciers-advanced-16-km-during-2008-2016-in-a-region-that-was-6c-warmer-9000-years-ago/comment-page-1/#comment-1281780
“The idea that scientists would deliberately fiddle their results strikes me as ridiculous. Most scientists have the brainpower to be able to earn far more than they do by engaging in something other than science. They choose not to because of the enormous satisfaction that they get from following their almost childlike curiosity. Fiddling their results would remove this satisfaction meaning that they would have impoverished themselves unnecessarily.”
This is only a partial reply to your post. I will be dealing in more detail with some of your points later on. First let me be clear that I have no wish to withdraw or modify anything that I wrote which you have quoted. In fact, there is only one thing that I have ever written on this blog that I would change. This was where I wrote rising instead of falling – a mistake which you picked up.
Second, I still believe that Muller was a sceptic when he launched the Berkeley Earth project. After all, he was one of the first people to endorse the debunking of the hockey stick by the Canadian raincoats. In fact, as he said himself, he launched the project because he was sceptical about the then existing data series. He has indeed moved to a less sceptical position over recent years, but it is what he was when he created the BEST series that is relevant. It is no surprise that you do not regard Muller as a sceptic because you have already accused me of not being one. This to me means that you have a definition which is pretty close to denialism.
Insofar as GHG theory is concerned, I have made it clear that I endorse the basic idea when we are discussing near surface AIR temperatures – mainly over land. I have repeatedly said that ocean heat content and, to a lesser extent, sea surface temperatures are not a good metric for evaluating the theory. Please don’t continue to misrepresent me with your fixation. GHG theory is like a chain. Each and every single link in the chain has been rigorously tested and, so far, no faults have been identified. As I have pointed out, we cannot test the chain itself because we cannot change CO2 concentrations up and down at will. I have described every link in the chain. If you want more information, then I suggest that you consult one of the standard textbooks on the subject. But please avoid the popular science versions. They will probably talk about back radiation, which, though real, is a very minor part of the overall story.
Finally, I would like to emphasise once again that I do not regard GHG theory as being even as much as half of the overall story. We do need a supplementary or alternative theory. I just don’t find the explanations based on clouds and the sun fit the data at all well.
Unbelievable! You are a believer through and through. No faults have been identified in the “theory”/belief that CO2 IR heats up water when increased (and cools down water when decreased)? Um, can you explain how there have been “no faults” identified in a “theory”/belief that has never been demonstrated in the real world?
I assume you understand that uncertainty and error bars are a main focus for skeptics, especially when it comes to science. But with your faith-like statement “each and every single link in the chain has been rigorously tested and, so far, no faults have been identified”, I will assume you do not understand just how deep the uncertainty and errors are in the assumptions about CO2 and warming. A good place to start on the path to actually practicing skepticism, or thinking like a real skeptic does, would be with this rather simplified introduction to the issue:
Frank, 2008
“It turns out that uncertainties in the energetic responses of Earth climate systems are more than 10 times larger than the entire energetic effect of increased CO2.”
Uh, no. You’ve done no such thing. In radiation physics, the heat flux is ocean-to-air. The atmosphere cannot warm until the oceans do. Greenhouse gases must be the mechanism that heat the ocean to keep the surface warm for the GHG “theory” to have scientific merit. Identify where in “established physics” it specifies/measures how much water bodies are heated up/cooled down by increasing or decreasing CO2 in the air above them. You can’t, of course. Because it doesn’t exist in “established physics”. It’s an assumption rooted in non-real-world modeling – but yet you believe in it anyway.
You obviously want to dismiss this fact (that it’s an assumption, not “established physics” as you’ve claimed) as simply inconvenient, and therefore you don’t have to deal with it. That’s why you keep on writing things like “we are discussing near surface AIR temperatures” and not ocean heat content. I assume you are aware that surface AIR temperatures are predominantly determined by ocean temperatures — and not the other way around. You’re aware, but because it’s inconvenient to your belief that there are “no faults” GHG theory, you simply avoid responding to this challenge every time.
No. The reason why I do not classify Muller as a skeptic is because he has written things like this:
Muller: “I, for example, am not only convinced that global warming is real, and caused by humans, but I can make a compelling case that it is so.”
I do not regard you as a skeptic because you (a) downplay or fully dismiss uncertainty, (b) claim there are “no faults” in the GHG “theory”/belief…which you claim is rooted in “established physics”, you (c) avoid responding to the question as to why you believe that CO2 heats water bodies without real-world evidence/measurements/physics supporting this belief, (d) you believe there is no chance that data set overseers would fiddle with temperature records for the sake of confirmation bias/agenda, and (e) you believe that it is not even “vaguely plausible” that changes in surface solar radiation found in satellite observations since the 1980s could explain warming.
Ooh. Please specify what “denialism” is when it comes to the physiological merits of the GHG “theory”/belief. What, specifically, is being denied? What truth?
But you think that CO2 does fit the data? Why?
McLean, 2014
http://file.scirp.org/Html/22-4700327_50837.htm
“The reduction in total cloud cover of 6.8% [between 1984 – 2009] means that 5.4 Wm−2 (6.8% of 79) is no longer being reflected but acts instead as an extra forcing into the atmosphere… To put this [5.4 Wm-2 of solar radiative forcing via cloud cover reduction between 1984-2009] into context, the IPCC Fifth Assessment Report…states that the total anthropogenic radiative forcing for 2011 relative to 1750 is 2.29 Wm−2 for all greenhouse gases and for carbon dioxide alone is 1.68 Wm−2. The increase in radiative forcing caused by the reduction in total cloud cover over 10 years is therefore more than double the IPCC’s estimated radiative forcing for all greenhouse gases and more than three times greater than the forcing by carbon dioxide alone [from 1750 to present]. … According to the energy balance described by Trenberth et al. (2009), the reduction in total cloud cover accounts for the increase in temperature since 1987, leaving little, if any, of the temperature change to be attributed to other forcings.“
“Skeptik” wields the scalpel of logic as deftly as an assassin suffering from cerebral palsy.
I have never been a great believer in conspiracy theories – especially in science. In the case of climate science, cui bono/who would benefit from instigating the AGW scare?
In most democratic countries the major concern of most governments is their re-election. The best way to ensure this is to have a prosperous economy. Making energy unnecessarily scarce and expensive is hardly the best way to achieve this! So, we can rule out governments.
What about the fossil fuel industry and their major customers? Nothing would suit them better than the debunking of AGW. I would expect that anyone with a decent debunking up his sleeve would be inundated with offers of financial support for his work!
Only the renewables industry would have any interest in perpetuating a scam. But they are a response to the AGW meme rather than instigators of it.
This leaves us with the scientists. Any conspiracy would have to involve very large numbers of them. In such a scenario it is almost inevitable that somebody would break ranks, speak out of turn, let the cat out of the bag, spill the beans, blow the whistle or whatever metaphor takes your fancy. Yet we have a deafening silence. This silence is unlikely to be based on fear or money. Many academic scientists have what are known as tenured posts. This means that they cannot be sacked for saying inconvenient things. Indeed, the whole purpose of tenure is to allow academics to speak truth unto power. Many of the scientists involved will also be retired. Would they lose their pensions for speaking out? It is notable that Roy Spencer and Judith Curry have retained their academic posts and that Richard Lindzen has not been stripped of his honorary titles!
The idea that scientists would adjust their data to fit the models is rather silly. For a start, the models don’t agree at all well with each other. Which model would they try to fit? Actually most scientists take an almost childish delight in proving other scientists wrong. This is why science has proved to be such a successful begetter of technology. Bad science is quickly discarded.
In the case of climate science there are three main groups: the paleo reconstructors; the model builders and the measurers. When reading the Climategate1 e-mails I was struck by the somewhat amused contempt that each group had for the others.
What do we do when we move a station from an urban environment to a more rural one? I would prefer that we call it a separate new station rather than try to splice the two time series together. This is more or less what BEST do. However, as I found myself when I tried it out about seven years ago, this is computationally very demanding. This is probably why the earlier series used the splicing and adjustment technique.
Finally, I find it amusing that sceptics/denialists should try to rubbish the data as part of their attempt to rubbish AGW. As I have already shown, the data does a pretty good job of this on its own, (see comments on rates of increase of Ln(CO2) when compared with rates of increase in temperature and the enormous variation in apparent sensitivity from one period to another!)
I’m not a believer in conspiracy theories either. That’s why the entire premise of your comments about conspiracies in climate science is flawed. A conspiracy isn’t required to launch AGW any more than a conspiracy was required to launch the scientific consensus of a global cooling in the 1970s. All that’s needed is enough people with authority agreeing with each other.
That’s why Dr. Moniz won the Nobel Prize in 1949 for his lobotomy procedure, which led to 10s of thousands of lobotomies performed thereafter in the 1950s. Those scientists agreed the science was sound due to a large dose of confirmation bias and groupthink. That’s all that was needed to perpetuate the practice. Nothing conspiratorial or secretive or Let’s-scam-everyone-for-monetary-gain! is required. People don’t want to be thought of as “deniers”. So they conform to the zeitgeist. The pressurizing is very effective. Just ask Dr. Ridd:
https://ipa.org.au/publications-ipa/professor-peter-ridd-standing-scientific-integrity-james-cook-university
In climate science, it amounts to looking at the data that shows the oceans are cooling, agreeing with one’s peers that the data that show that the oceans are cooling must be wrong (because CO2 is causing warming), and therefore the wrong data need to be corrected to show warming instead. Again, no conspiracy or “secret operation” is required. They even write about it: https://earthobservatory.nasa.gov/Features/OceanCooling/
Do you believe that that’s what’s happened? Because it’s the other way around. 4,500 temperature stations have been removed from the GHCN temperature record since the 1970s, almost all of them from rural or non-urban areas, where no significant net global warming has consistently been observed since the 1930s. But you, of course, don’t think that removing temperature stations from rural or non-urban areas has had an effect on the GHCN data.
Perhaps you can explain this, Skeptik, since you’re a believer that the instrumental record hasn’t been fiddled with at all due to the integrity of scientists.
Between 1880 and 1950, the temperature data showed a +0.5 C warming as of 1987 (GISS):
https://notrickszone.com/wp-content/uploads/2017/02/NASA-Global-Surface-Temps-1987-0.5C-1880-1950-768×751.jpg
Today, that +0.5 C of warming between 1880 and 1950 has disappeared. The temperature record now shows zero warming during that span:
https://notrickszone.com/wp-content/uploads/2017/02/NOAA-Data-Manipulation-No-Warming-1880-1950.jpg
Where do you suppose that half a degree of warming disappeared to, Skeptik? How did it disappear? What’s the explanation?
Do you think there could be any motivation at all to remove 0.5 C of warming from a time period when anthropogenic CO2 emissions were effectively flat?
Why do you think the data set overseers were talking about just removing 0.15 C from the “1940s blip”?
http://di2.nu/foia/1254108338.txt
“So, if we could reduce the ocean blip by, say, 0.15 degC, then this would be significant for the global mean — but we’d still have to explain the land blip. I’ve chosen 0.15 here deliberately. … My 0.15 adjustment leaves things consistent with this, so you can see where I am coming from. It would be good to remove at least part of the 1940s blip, but we are still left with ‘why the blip’.”
Why would they say it would be “good” to just remove temperatures from that period anyway? What’s the motivation?
Let us examine the empirical evidence for the sun being, or not being, a major driver of climate change. To begin with we need to recognize that the period up to and including 1975 is very different from the period from 1979 onwards. Let us deal with the latter period first.
To begin with, let us try a simple thought experiment and ask ourselves what we would expect to happen if the sun were to be suddenly switched off. We would expect the earth to cool and asymptotically approach a temperature close to absolute zero. But how fast would this happen? A clue is provided by the diurnal temperature range. On a global basis, the average daily minimum temperature, (sometime in the night), is of the order of 7.70 degrees Celsius, whereas the average daily maximum temperature, (sometime during the hours of daylight), is of the order of 19.23 degrees C. So, in the matter of about 12 hours, the temperature changes by about 11.53 degrees. This represents about 4.02% of the average absolute temperature meaning that 95.98% of it is retained. How long would it take at this rate for the temperature to drop by half of its absolute value? The answer is between 17 and 18 twelve hour periods. On this basis, we can hardly maintain the idea that it takes a long time for the changes in TSI to have their main effect. Yes, this is a very very crude calculation but it is unlikely to be out by more than a factor of much more than three. This means that we are talking about weeks rather than years or decades so that any averaging to “hide the 11 year oscillation” is not really justified.
The diurnal temperature range is useful in other ways too. Unless something very peculiar is going on, then we would expect that the percentage change in temperatures caused by changes in TSI would be much the same both for the background value and the fluctuations around it. On this basis we would expect that the maximum change in temperature range due to changes in TSI would be of the order of 0.1 degrees C with the 11 year smoothed out value being as low as 0.0027 degrees C! Such changes would not be detectable – a conclusion that we could have reached by using standard radiation physics, as I have already mentioned elsewhere.
But we are not finished with DTR just yet. One would expect that the main effects of changes in TSI would be experienced when the sun is actually shining, i.e. during the day. This means that if we have warming, as we have, then we would expect the daytime warming to be larger than the night time one. Yet the reverse is the case! Actually this is just what GHG theory predicts. The difference is small and may not be totally reliable but . . .
When we consider that the eleven year cycle is undetectable in the temperature record and that the smoothed values show TSI to be in decline when the earth is warming then it becomes virtually impossible to maintain the position that changes in TSI are the cause of changes in temperature.
Finally insofar as the modern era is concerned, I have compared the temperature of every single station in the unadjusted GHCN database which has more than eleven years’ worth of data with the TSI record. The correlations are all over the place but, just to give a flavor of the situation, the average correlation coefficient is just 0.073. This covers no less than 4,188 stations!
Turning to the earlier period, we note that there is very little true empirical data on the sun’s output available. All we have is sunspot counts supplemented by dubious proxy data and models. This is hardly a rock solid foundation on which to build any theory! Over the years, I have read dozens and dozens of papers purporting to show that the sun is the main driver of climate change. Yet they all suffer from this basic fault as well as most of them invoking and 11, (or in some cases 22), year smoothing to evade the issue of the missing oscillation. Prior to 1900, we would appear to have no proxies at all – merely models and sun spot counts.
There is a danger in using proxy data. Most proxies are not merely proxies for just one variable. Suppose, for the sake of argument, that we have something which is a proxy for both A and B. Clearly if we attempt to examine the relationship between proxy A and real B we will get a correlation – but it will be a completely spurious one! How do we know that our supposed proxy for TSI is not also a proxy for temperature? We don’t!
I probably won’t reply to any further claims about the sun unless they are really new and get over the problems raised here.
You keep on concocting this same straw man argument even though we have pointed out to you many times that that’s what it is. You keep on arguing with a position that we are not advancing…and glossing past that which we have advanced (albeit simplistically thus far).
The TSI variation is not what directly drives temperature. It’s the decadal-scale variation in cloud cover, modulated by solar/geomagnetic activity, that drives the temperature change. Solar brightening via surface solar radiation, explains the warming since the 1980s, as the positive radiative imbalance amounts to about +1 to +2 W m-2 per decade from the 1980s to 2000s from changes in cloud cover. This dwarfs even the alleged/model-based radiative forcing value for increasing CO2 concentrations (i.e., +0.2 W m-2 per +22 ppm CO2 per Feldman et al., 2015).
It’s probably pointless to try to keep presenting you with scientific papers explaining this, as you are obviously close-minded and unwilling to consider anything other than what matches your presuppositions, but I’ll indulge you nonetheless. This is for the benefit of those who are actually skeptical of the claim that CO2 modifies the ocean-to-atmosphere heat flux.
According to Feldman et al. (2015), the 22 ppm increase in CO2 concentration resulted in a 0.2 W m-2 per decade radiative forcing.
Due to changes in the Sun’s geomagnetic constitution that affect changes in decadal-scale cloud cover over the course of the last 3 decades, the forcing from absorbed surface solar radiation via the reduction in cloud cover is about 10 times greater than the (tiny) alleged per decade forcing from CO2 concentration changes. And, unlike CO2, SW radiation resulting from changes in cloud cover can penetrate by 10s of meters into the ocean, whereas IR cannot penetrate past the hair-thin skin layer. Therefore, even tiny changes in cloud cover can modulate ocean heat content on magnitudes-greater scale than tiny parts-per-million (0.000001) changes in atmospheric CO2 — even assuming that the forcing values for CO2 are not just theoretical and model-based, but real.
—
http://www.sciencemag.org/content/308/5723/850.abstract
“Long-term variations in solar radiation at Earth’s surface (S) can affect our climate, the hydrological cycle, plant photosynthesis, and solar power. Sustained decreases in S [surface solar radiation] have been widely reported from about the year 1960 to 1990. Here we present an estimate of global temporal variations in S by using the longest available satellite record. We observed an overall increase in S [surface solar radiation] from 1983 to 2001 at a rate of 0.16 watts per square meter (0.10%) per year [1.6 W m-2 per decade].”
—
https://link.springer.com/article/10.1007/s00704-016-1829-3
“The present paper describes how the entire series of global solar radiation (1987–2014) and diffuse radiation (1994–2014) were built, including the quality control process. Appropriate corrections to the diffuse component were made when a shadowband was employed to make measurements. Analysis of the series reveals that annual mean global irradiance presents a statistically significant increase of 2.5 W m−2 (1.4 %) decade−1 (1988–2014 period)
—
http://www.atmos-chem-phys.net/13/8505/2013/acp-13-8505-2013.html
“[T]here has been a global net decrease in 340 nm cloud plus aerosol reflectivity [1979-2011]. … Applying a 3.6% cloud reflectivity perturbation to the shortwave energy balance partitioning given by Trenberth et al. (2009) corresponds to an increase of 2.7 W m−2 of solar energy reaching the Earth’s surface and an increase of 1.4% or 2.3 W m−2 absorbed by the surface.”
—
http://www.atmos-chem-phys.net/12/9581/2012/acp-12-9581-2012.html
“The Earth’s climate is driven by surface incident solar radiation (Rs). Direct measurements have shown that Rs has undergone significant decadal variations. … By merging direct measurements collected by Global Energy Budget Archive with those derived from SunDu [sunshine duration], we obtained a good coverage of Rs [surface incident solar radiation] over the Northern Hemisphere. From this data, the average increase of Rs [surface incident solar radiation] from 1982 to 2008 is estimated to be 0.87 W m−2 per decade [2.3 W/m-2 total]”
—
ftp://bbso.njit.edu/pub/staff/pgoode/website/publications/Palle_etal_2005a_GRL.pdf
“Traditionally the Earth’s reflectance has been assumed to be roughly constant, but large decadal variability, not reproduced by current climate models, has been reported lately from a variety of sources. There is a consistent picture among all data sets by which the Earth’s albedo has decreased over the 1985-2000 interval. The amplitude of this decrease ranges from 2-3 W/m2 to 6-7 W/m2 but any value inside these ranges is highly climatologically significant and implies major changes in the Earth’s radiation budget.”
—
Sapozhnikova et al., 2018
http://iopscience.iop.org/article/10.1088/1755-1315/211/1/012039/pdf
“In spite of the small changes in the solar constant, they are supposed to have a modulating influence on the local (regional) climate [Frӧhlich, 2010; Lean and Rind, 2008], which can be more sensitive to changes in the solar activity [Grey et al., 2010; Lockwood, 2012]. … The cross-spectrum and the coherency spectrum point to the relation of the cloudiness to the solar cycle, with the variations in the cloudiness occurring, according to the phase spectrum, approximately in phase with the solar cycle. The cloudiness variations modulate the solar radiation intensity at the surface level by screening the direct and increasing the diffusive radiation, and it could be the reason for the (СО2+Н2О) variations on the scale of the solar cycle period. Comparison of the phase spectra […] shows that the solar cycle-like variations of CO2+H2O are approximately in phase with the variations of the cloud cover.”
—
Van Geel and Ziegler, 2013
https://www.researchgate.net/profile/Bas_Geel/publication/275459414_IPCC_Underestimates_the_Sun's_Role_in_Climate_Change/links/5543916f0cf234bdb21bd1e8.pdf
“[T]he IPCC neglects strong paleo-climatologic evidence for the high sensitivity of the climate system to changes in solar activity. This high climate sensitivity is not alone due to variations in total solar irradiance-related direct solar forcing, but also due to additional, so-called indirect solar forcings. These include solar-related chemical-based UV irradiance-related variations in stratospheric temperatures and galactic cosmic ray-related changes in cloud cover and surface temperatures, as well as ocean oscillations, such as the Pacific Decadal Oscillation and the North Atlantic Oscillation that significant affect the climate. … [T]he cyclical temperature increase of the 20th century coincided with the buildup and culmination of the Grand Solar Maximum that commenced in 1924 and ended in 2008.”
Since TSI estimates based on proxies are relatively poorly constrained, they vary considerably between authors, such as Wang et al. [40] and Hoyt and Schatten [41]. There is also considerable disagreement in the interpretation of satellite-derived TSI data between the ACRIM and PMOD groups [42,43]. Assessment of the Sun’s role in climate change depends largely on which model is adopted for the evolution of TSI during the last 100 years [44,45,46]. The ACRIM TSI satellite composite shows that during the last 30 years TSI averaged at 1361 Wm-2, varied during solar cycles 21 to 23 by about 0.9 Wm-2, had increased by 0.45 Wm-2 during cycle 21 to 22 to decline again during cycle 23 and the current cycle 24 [47]. By contrast, the PMOD TSI satellite composite suggests for the last 30 years an average TSI of 1366, varying between 1365.2 and 1367.0 Wm-2 that declined steadily since 1980 by 0.3 Wm-2. On centennial and longer time scales, differences between TSI estimates become increasingly larger. Wang et al. [40] and Kopp and Lean [48] estimate that between 1900 and 1960 TSI increased by about 0.5 Wm-2 and thereafter remained essentially stable, whilst Hoyt and Schatten [41] combined with the ACRIM data and suggest that TSI increased between 1900 and 2000 by about 3 Wm-2 and was subject to major fluctuations in 1950-1980 [46,49]. Similarly, it is variably estimated that during the Maunder Solar Minimum (1645- 1715) of the Little Ice Age TSI may have been only 1.25 Wm-2 lower than at present [40,50,51,52] or by as much as 6 ± 3 Wm-2 lower than at present [39,41], reflecting a TSI increase ranging between 0.09% and 0.5%, respectively (fig. 2).”
To me the IPCC line “A significant part of this uncertainty range arises from our limited knowledge of clouds and their interaction with radiation.” says the most. And in fact they underplays their ignorance of how this planet’s damp atmosphere behaves. Yet despite this very little money goes into researching exactly how our clouds operate — empirical evidence for all type of cloud, how and why they appear, their evolution, how they dissipate, how energy exchanges are manifested within and about them. The UN-IPCC’s entire argument is founded on this basic ignorance, their ‘science’ is incomplete and so it’s irrational. Their CO2 supposition is pure baloney with zero credibility or evidence of it’s operation in chaotic nature our climate system.
However the evidence of this planet’s climate history, and credible proxy derived evidence of variation CO2 levels show that these CO2 variations do not drive our climate but are (with other things like oceanic outgassing, seismic events, etc.) just an effect of it.
The only way they would get more money to study clouds is if they declared that man were the cause of them.
Cloud cover varies as shown by NASA GISS shows, so why has it taken a dive and never recovered after the 1990s?
https://isccp.giss.nasa.gov/zD2BASICS/B8glbp.anomdevs.jpg
Climate scientists have finally managed to show that the “science is settled”.
In that there is no such thing as dangerous climate change, caused by increased CO2.
It is now time to call a halt to “green” politics and the ruinous renewable energy scam.
Happy New Year😁
1649 “The British Parliament invoked a law that made it a crime, punishable by burning at the stake, to forecast the weather.”
Living can be dangerous business when you innocently make a foolish attempt to manipulate the weather, forecast, which could be construed as using witchcraft to change the weather. lol
You just never know what someone could be up to, so you have to be extra careful at all times.
It was smack dab in the middle of the LIA, so forecasting weather probably meant more bad news by then, the tolerance for bad weather had reached all-time lows.
Wouldn’t it be analogous to suggesting to jail AGW deniers?
Sort of in the save vein of thought.
You can’t be a skeptic, if you doubt climate change due to the use of fossil fuels and all of the pesky carbon emissions, you are eligible for an extended stay at a graybar hotel, a re-education camp, have to solve problems with a dose of harsh reality behind bars.
Just as looney as the British Parliament legalizing the use of the death penalty for anybody telling you it’s going to be colder than hades one day next week.
When the lunatics are in charge of the asylum, expect bedlam.
Climate Change Alarmists are in denial of their lunacy.
Any kind of denial is a punishable offence.
Right now, here in the nascent stages of the Anthropocene epoch, it is minus fourteen below zero F heading for -24 F by 6am.
I demand that everybody in the here and now begin to burn more coal and oil to heat up the planet even more.
I want and demand more Anthropogenic Global Warming NOW, dammit.
At -24 F, don’t worry, people are staying warm burning oil and coal, can’t be denied, it is going to happen night and day, day after day, fossil fuel consumption is not going to stop just because some more CO2 gas is accumulating in the atmosphere.
Even if you don’t use fossil fuels, you are not going to change the results in a century or two all that much.
You definitely want to stay alive while you can fog a mirror, using fossil fuels in copious amounts can prevent freezing to death in the dead of winter.
You are a complete moron if you can’t deal with the reality of fossil fuel consumption by people. You are in voluntary denial.
It is not rocket medicine.
Fossil fuels are necessary for civilization to function.
When the Rainbow Warrior needs fuel, what is the first choice?
Wind? Just needs a mast and sails.
The Sun? Well, yeah, the sun helps, the sun will generate a little wind so you can sail with no fossil fuels at all.
Heat from the sun helps a lot, not just some.
It is a one hundred percent guarantee that the Rainbow Warrior will pull up to the fueling dock and fill up with bunker fuel so the boat not only can float, but move as well.
“The ship has a fuel capacity of 110,000l, fresh water capacity of 32,000l and an electric drive system (10kt on only 300kW). It has 30 berths.”
That’s the idea, the ship is useless if it just sits there.
Nice to have the sun do the work it does, warms the air, warms the water, warms the earth beneath your feet.
On a hot day in summer, the sun’s rays pack a punch. On a black dirt field, the sun bears down on the earth, the ground gets so hot, your bare feet can’t stand the heat, the soil has been warmed more than you can stand with no shoes on your feet.
You can take that to the bank. The sun’s energy deposits more than just light, the sun’s energy does translate to money, sustenance, economics, food and shelter.
You won’t have oil without the sun’s energy and the sun’s energy also became coal. The sun is at work and its energy does undergo a transformation to the benefit of mankind.
Humans use the earth’s resources to continue to live and survive.
How and what gets done depends on how much they know. If you can construct what’s been built, you know they have a great deal of intelligence. How the resources are allocated and distributed is always a bone of contention.
Regardless of what is done to survive, the work to do it all has to be done. What is done to get it all done is sometimes not the thing to do.
It is vague and nebulous from one demographic change to the next, yet always done the best people can. For people, if it can be done, it’ll most likely get done. The Three Gorges Dam is one of many that is a testament to what can be accomplished.
The International Space Station is more than just hardware. It’s been flying through space and it keeps on trucking, space flight is not an easy job.
Humans have accumulated knowledge for a hundred thousand years, they can do almost anything, it seems.
Even if it is war, it is a part of life and can’t be denied. Looks like a permanent state of war with what is going on nowadays. Too bad, something nobody wants at all, yet it still happens. Inexplicable to most, nobody understands, have to raise tolerances, which might be impossible. Not everybody is going to see eye to eye.
Must be human nature.
The sun is the source of it all.
Without the sun, the earth is toast.
[…] Read rest at No Tricks Zone […]
[…] by K. Richard, December 31, 2018 in NoTricksZone […]
[…] Read more … […]
[…] https://notrickszone.com/2018/12/31/new-science-a-main-tenet-of-anthropogenic-global-warming-has-been… […]
[…] https://notrickszone.com/2018/12/31/new-science-a-main-tenet-of-anthropogenic-global-warming-has-been… […]
[…] Continental Energy Storage in CMIP5 Climate Change Simulations. Important study: Waste heat is a major source of national warming, significantly pollutes climatic record. Feet of clay: The official errors that exaggerated global warming. Feet of clay: The official errors that exaggerated global warming–part 2. Feet of clay: The official errors that exaggerated global warming – part 3. The Difference Between Energy, Work and Power – and Why it Matters to Climate Prediction. New NASA Data Blow Gaping Hole In Global Warming Alarmism. New Science: A Main Tenet Of Anthropogenic Global Warming Has Been Falsified By Observations. […]
[…] A Main Tenet Of Climate Change Has Been Falsified By Observations […]