Hachijojima is a rural-type island off the coast from the megapolis of Tokyo in the Pacific.
What makes Hachijojima interesting is that it is ideal for comparing its trend to a heavily urban environment, like Tokyo’s.
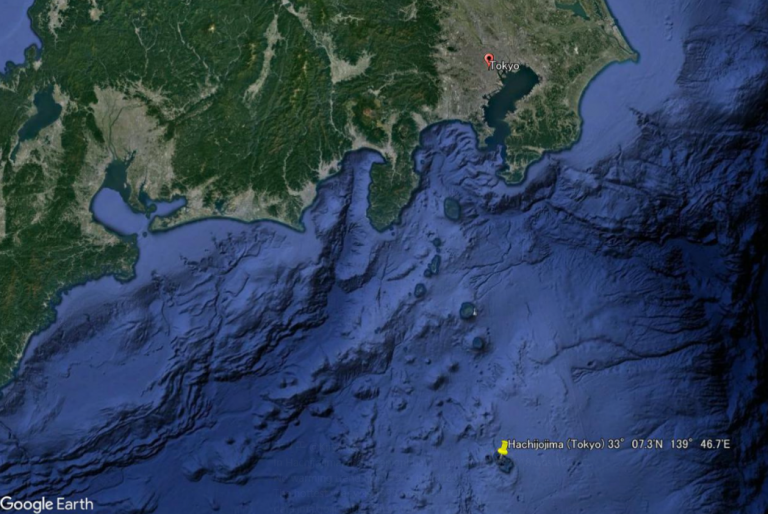
Hachijojima is located roughly 300 km, out to sea, from Tokyo and thus is hardly impacted by urbanization. Image: Google Earth.
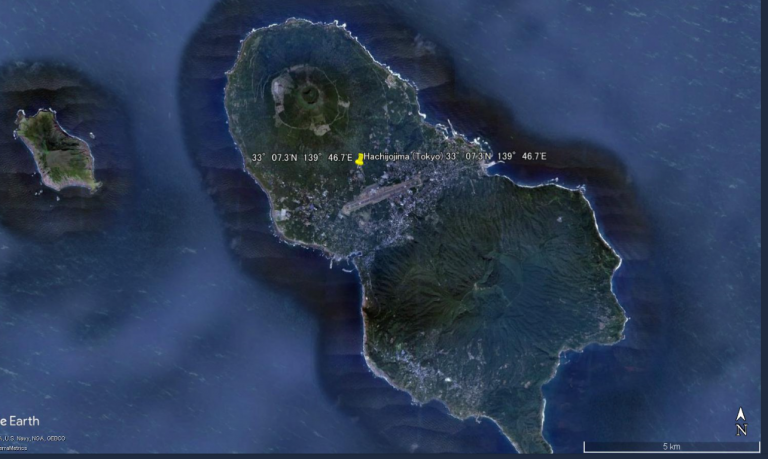
What follows is a close up of the island and the approximate location of the measurement station:
Hachijojima is relatively very rural and unaffected from the factors of urbanization. Image: Google Earth
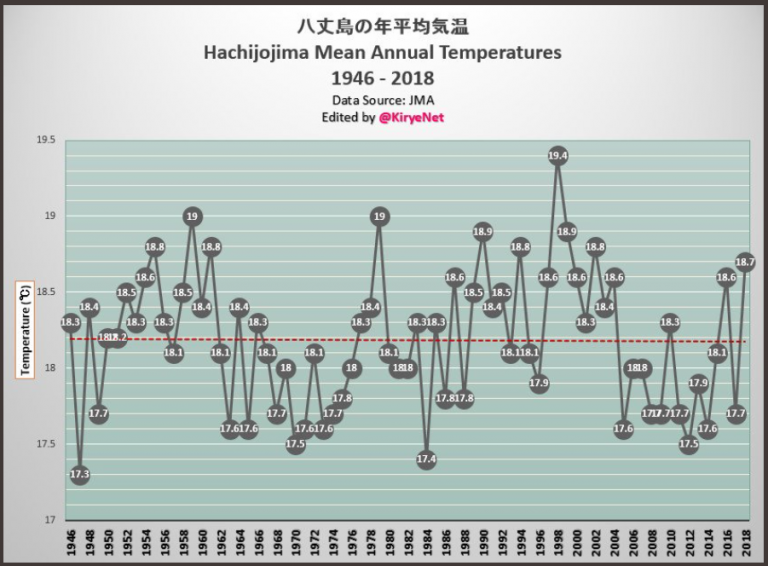
Such a comparison can allow us to see the urban signal on measured data, like temperature. The following chart shows that there has been no warming at this island over the past 70 years, using the unadjusted data from the Japanese Meteorology Agency (JMA):
There’s been no trend at all in the mean annual temperature at Hachijojima over the past 70 years! Chart: Kirye.
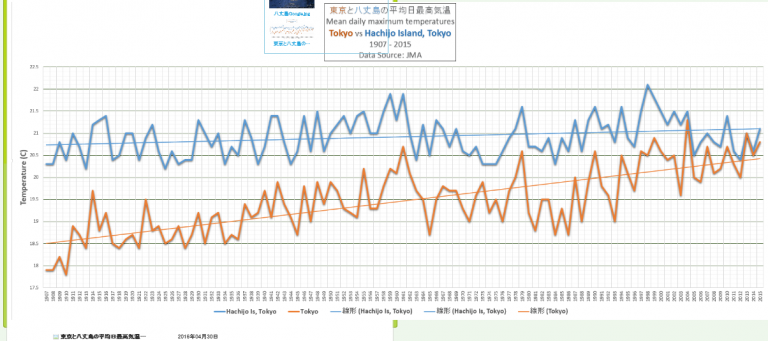
Now when we compare rural Hachijojima to massively urban Tokyo, using the mean daily maximum temperature, we can clearly see the urban heat island (UHI) effect:
While Hachijojima has seen no only a modest warming trend since 1980, modern urban Tokyo has seen a strong warming. This is very likely due to the urban heat island effect where steel, concrete and asphalt store energy from the sun and fuels consumed by cars, buildings and factories. Chart: Kirye.
UHI effect since start of Japanese industrialization
The data for both stations go way back to 1907:
Click here to enlarge. Chart: Kirye.
From 1907 to 1935, the trend for both was very similar, with no rise. Then there was a rise for both stations from the 1930s to 1961. Note how in this period Tokyo temperature rose more quickly than Hachijojima. Next came the cooling of the the 1960s, 1970s and early 1980s, followed by the most recent warming.
Tokyo warms, while rural island cools!
Note how the most recent warming since the 1980s has been far stronger in Tokyo then it has been in rural Hachijojima. Tokyo, once significantly cooler, is about as warm as Hachijojima today.
And since the peak in 1998, Hachijojima has been cooling a bit while Tokyo has been warming!
Can all this be explained by CO2? Honestly not.
Obviously the urban heat island (UHI) effect is the real driver in Tokyo and is corrupting urban data, while natural ocean factors may be at work to account for the difference as well.
=====================================================
Pierre Gosselin contributed to this article


Why was Tokyo so much colder than Hachijojima at the beginning of the 20th century?
It’s 300 km further north.
UHI likely a big factor
But, but climate scientists tell us the urban heat island effect is trivial.
However their grant money depends on continued warming.
Go figure🤮
I live in the heart of a medium-sized US city and the thermometer on the outside of my kitchen window consistently reads at least 5F more than the airport temperature. The UHI is alive and well.
And, Happy New Year to you, Pierre!
” kitchen window ” The UHI is . . .
… Utter House Involvement.
Proper Location for an Outdoor Thermometer LINK
the sensor should be placed a distance four times the height of the nearest building. So if your roof is 6 meters (20 feet) high, the sensor should be placed 24 meters (80 feet) from your house.
Very few meet those standards even with remote sensors unless they are weather geeks and in the suburbs it would be impossible for most. This Christmas I got a heck of deal. Menards had La Crosse model S88907 on sale for $27.00. Blue tooth connected remote sensor. Bought two for gifts. Kicking myself for not buying a couple more.
Technically you’re correct, John, but I nevertheless maintain that the “proper” placement of an outdoor thermometer is somewhere that I can see it clearly just outside my kitchen window, …in stocking feet and skivvies. :o)
If I want an official temperature, there are 2 well sited locations near me that post online. (NOTE – they can both differ by a degree or more, which tells me that homogenization is for the birds, and don’t get me started on avg., temps!)
Since some of us are telling stories, here’s my own anecdotal contribution.
When living in Philadelphia years ago, we would occasionally go camping in French Creek State Park over a long weekend because in the summers…. (just that bit about how hot it is)
But while just as hot during the day at French Creek, the nights were so cold you waited until you couldn’t wait any longer before getting out of your sleeping bag to go and relieve your bladder. Meanwhile, in Philly, nightime temps were barely lower than during the day.
NOTE – F.C. is about 40 miles due west of Philly.
Elevation above sea level…
Philly – about 70 meters
F.C. . – about 230 meters.
So the best one could expect from lapse rate contribution is that F.C. should have been about a degree C cooler than Philly (it’s humid there, too). No way that would account for the nighttime difference.
The home page of the Gistemp website used to have a graph of temperatures in Tokyo. The accompanying text showed that they were using this as an example of UHI effects.
In my googling Hachijojima, (Island Where Hachijo Is Spoken?), I came across the perfect synonym in that dialect for “Warmism,” and that is “だんしん” or “乱心”.
But we already knew that, didn’t we? ;o)
Google Translate tells me that means >>”Dasshin” or “Murder”.<<
Is that correct?
I probably should have included the link. Sorry.
https://www.jlect.com/search.php?r=&h=&k=&l=hachijo-daito
だんしん【乱心】
(Noun) Madness, insanity, mental instability
There is another explanation that may partly explain the difference alongside UHI. That is that underlying temperature trends are quite different for the two places, despite being only 300 km apart. Take a default Gistemp Maps for Nov-18 against the November 1951-1980 average at the 250 km smooth. Despite the obvious smoothing, there are still quite large tend differences over fairly short distances. For instance there is cooling over the Great Lakes area and significant warming in Florida.
This is after data has been homogenized. But homomogenisation is based on the assumption that nearby stations are exposed to almost the same climate signal and that thus the differences between nearby stations can be utilized to detect inhomogeneities. But if most long-term temperature stations are in urban areas, and temperature trends do vary between nearby stations then homogenisation could remove genuine differences in trend whilst leaving in UHI impacts.
https://manicbeancounter.files.wordpress.com/2019/01/GISS-Surface-Temperature-Analysis_-Global-Maps-250km-Nov-2018v1951_1980.jpg
[…] https://notrickszone.com/2019/01/01/tale-of-two-stations-striking-contrast-urban-tokyo-warms-strongly… […]